


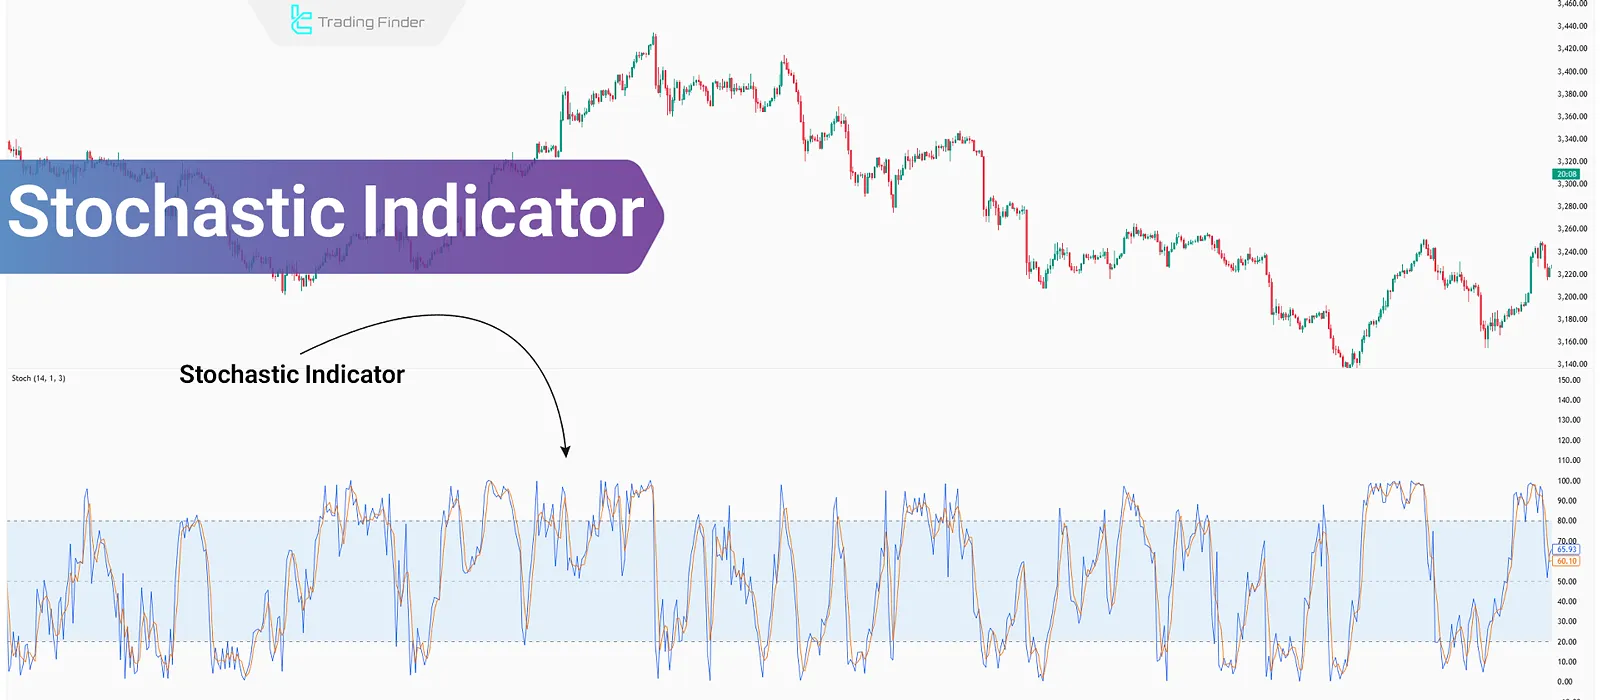
The stochastic indicator analyzes price momentum by examining price movements over a specific time period. This stochastic oscillator is a momentum-based indicator used in technical analysis.
When it is combined with other tools like the Relative Strength Index (RSI) or the Moving Average Convergence Divergence (MACD), it enhances the success rate of trading strategies.
Using this indicator, it becomes possible to identify various types of divergence, including hidden divergence; moreover, traders can enter positions and analyze the market through the overbought and oversold zones provided by this indicator.
In many strategies, this tool is also used as a core component of the stochastic divergence strategy.
What Is the Stochastic Indicator?
The stochastic indicator identifies price momentum by analyzing past market data such as closing prices and price range within a specific period (typically 14 days).
This indicator displays the data in a range between 0 and 100. If it moves above the 80 level, it indicates overbought conditions. If it moves below the 20 level, it indicates oversold conditions.
In the Stochastic Indicator tutorial article on the Investopedia website, the method of working with this indicator and stochastic analysis is explained:
History and Philosophy of the Stochastic Indicator
The stochastic indicator was developed by George Lane in the 1950s. Lane aimed to examine price behavior from the perspective of speed and closing position. He believed that momentum reveals signs of weakness or strength before a trend reversal occurs.
This approach became the foundation for many analytical models suchas stochastic divergence and various momentum patterns.
For this reason, the stochastic indicator is known as one of the earliest tools for early detection of reversals. Today, this indicator is used in almost all analytical platforms.
Pros and Cons of the Stochastic Indicator
The stochastic indicator is highly sensitive and generates relatively more signals than other momentum indicators.
However, these signals alone are not sufficient for entering a trade and should be used in conjunction with other technical analysis concepts such as classical chart patterns.
Pros | Cons |
High sensitivity and frequent signals | Relatively high number of false signals |
Simple signal structure | Delay in signal issuance |
Applicable to all financial markets | Requires complementary confirmations |
Easy and quick to learn | Needs setting adjustments in different conditions |
Best Settings for the Stochastic Indicator in Different Timeframes
In the default configuration, the stochastic indicator is used with parameters 14 for K and 3 for D. However, a single fixed setting cannot be applied to all assets. In lower timeframes, shorter periods create faster reactions but increase noise, making such settings suitable for scalping and some models of the forex stochastic strategy.
In higher timeframes, longer settings generate slower but more reliable signals. It is recommended that each trader personalize the settings based on their trading style and the volatility of the instrument to increase the accuracy of stochastic indicator forex signals.
Components of the Stochastic Indicator
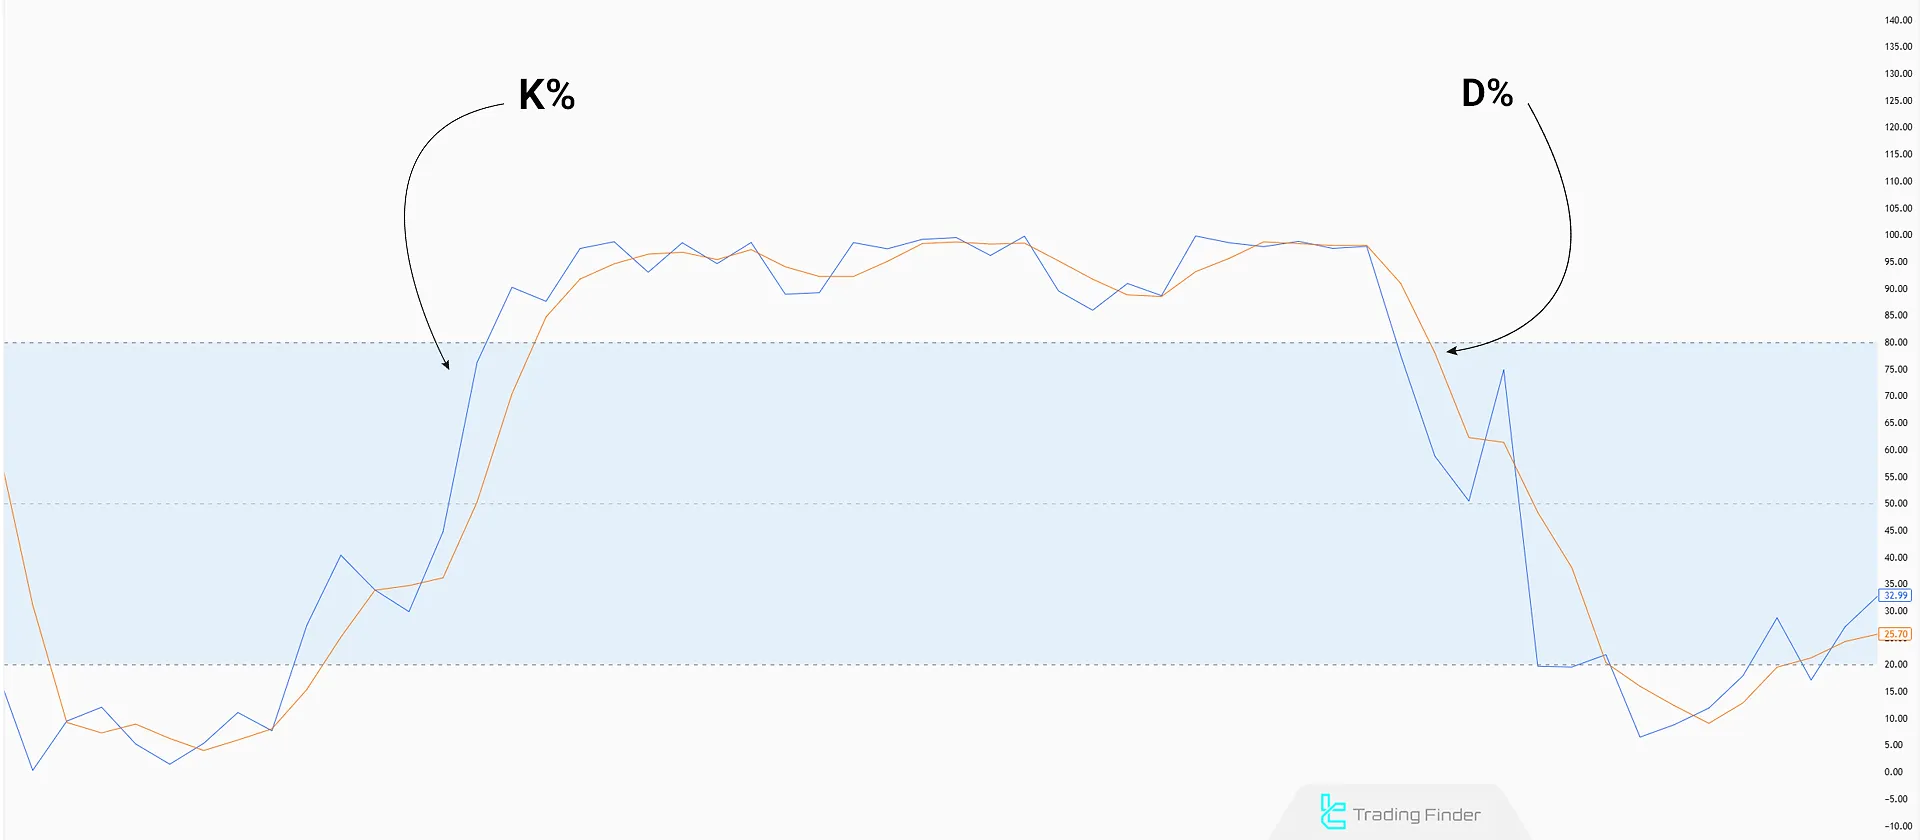
This indicator consists of two lines: %K and %D. The crossover of these two lines is considered a signal for identifying the next possible price move.
- %K Line: Calculates the ratio of the current price to the highest and lowest prices over a defined period;
- %D Line: A simple moving average (SMA) of the %K line, which helps filter out noise in the indicator.
Types of Stochastic Indicators and Their Functional Differences
The stochastic indicator is offered in three main versions:
- Fast
- Slow
- Full
The fast version is more sensitive and quickly reflects minor price changes. The slow version smooths the %K line to generate more accurate and lower-noise signals.
The full version allows customized adjustment of both the %K and %D lines, making it suitable for many traders engaged in the stochastic forex trading strategy.
How the Stochastic Oscillator Works?
The stochastic indicator uses two lines fast (%K) and slow (%D) to reflect price momentum.
When the fast line (%K) crosses below the slow line (%D), it generates a sell signal. When the fast line crosses above the slow line from below, it generates a buy signal.
On the Data Trader YouTube channel, various strategies using this indicator are taught through video tutorials:
Another important function of this indicator is the detection of overbought and oversold levels. The stochastic oscillator’s display is divided into three zones using the 20 and 80 lines:
- If the indicator lines enter the area above 80, it signals overbought, which may lead to a downward trend reversal;
- If the lines drop below 20, it indicates oversold conditions and the possibility of a bullish reversal.
Stochastic Indicator Formula
In its default settings, the stochastic indicator formula is calculated based on:
- C = Current closing price
- H14 = Highest price over the last 14 periods
- L14 = Lowest price over the last 14 periods
Formula:
Level Fifty in the Stochastic Indicator
The fifty level in the stochastic indicator receives less attention, yet it plays an important role in trend filtering.
When the indicator value remains above fifty for several candles, bullish momentum generally dominates the market. Conversely, staying consistently below the fifty level signals the strength of sellers. This level is highly useful when combined with stochastic pattern setups.
Identifying Divergence Using the Stochastic Indicator
The stochastic oscillator can identify both regular divergence and hidden divergence.
Regular Divergence in the Stochastic Indicator
Regular divergence helps detect changes in trend direction, whether bullish or bearish. In uptrends, traders examine highs; in downtrends, they assess lows:
- In an uptrend, if the stochastic forms lower highs (LH) while the price chart shows higher highs (HH), a bearish regular divergence is forming;
- In a downtrend, if the stochastic forms higher lows (HL) while the price shows lower lows (LL), a bullish regular divergence is present.
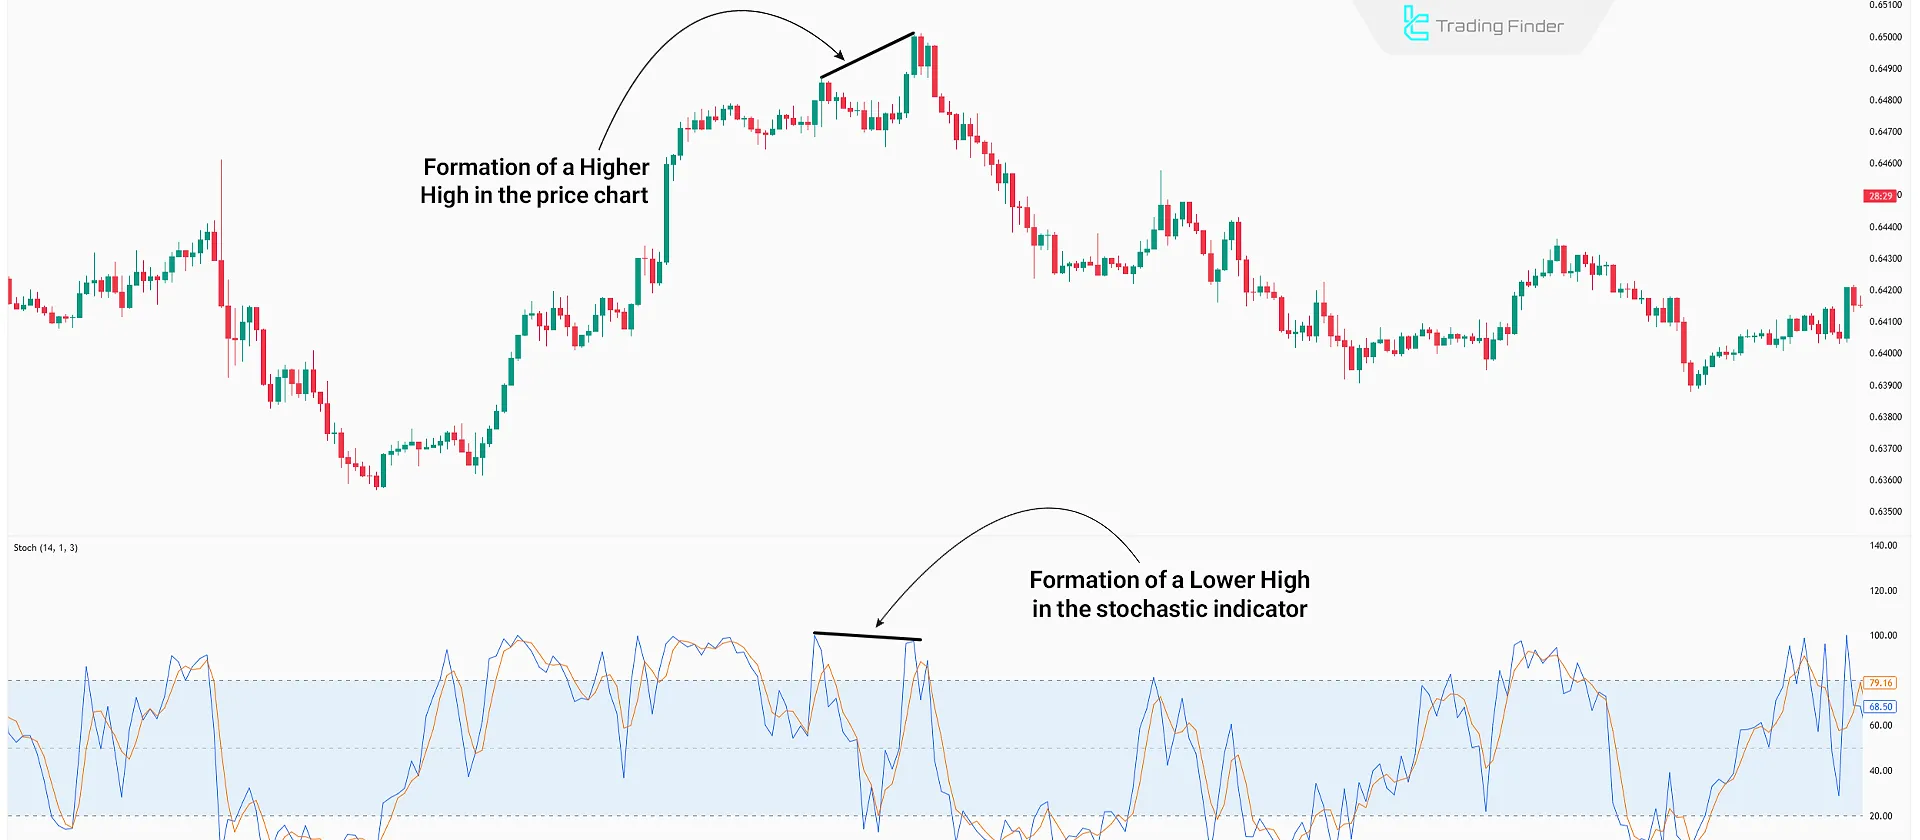
Example of Identifying Regular Divergence in the Stochastic Indicator
In the image below, the price forms a higher high, but the stochastic indicator fails to register a new high. This discrepancy between price and momentum indicates a regular bearish divergence, which usually precedes a potential trend reversal.
Such a pattern is considered an example of stochastic oscillator divergence. This situation gains more validity when it occurs in the overbought zone and near a chart resistance level.
Hidden Divergence in the Stochastic Indicator
In hidden divergence, the likelihood of the continuation of the existing trend is analyzed. If confirmed, the price trend is expected to persist.
- In an uptrend, if the price forms higher lows but the stochastic shows lower lows, a bullish hidden divergence is confirmed;
- In a downtrend, if the price forms lower highs while the stochastic displays higher highs, a bearish hidden divergence is formed.
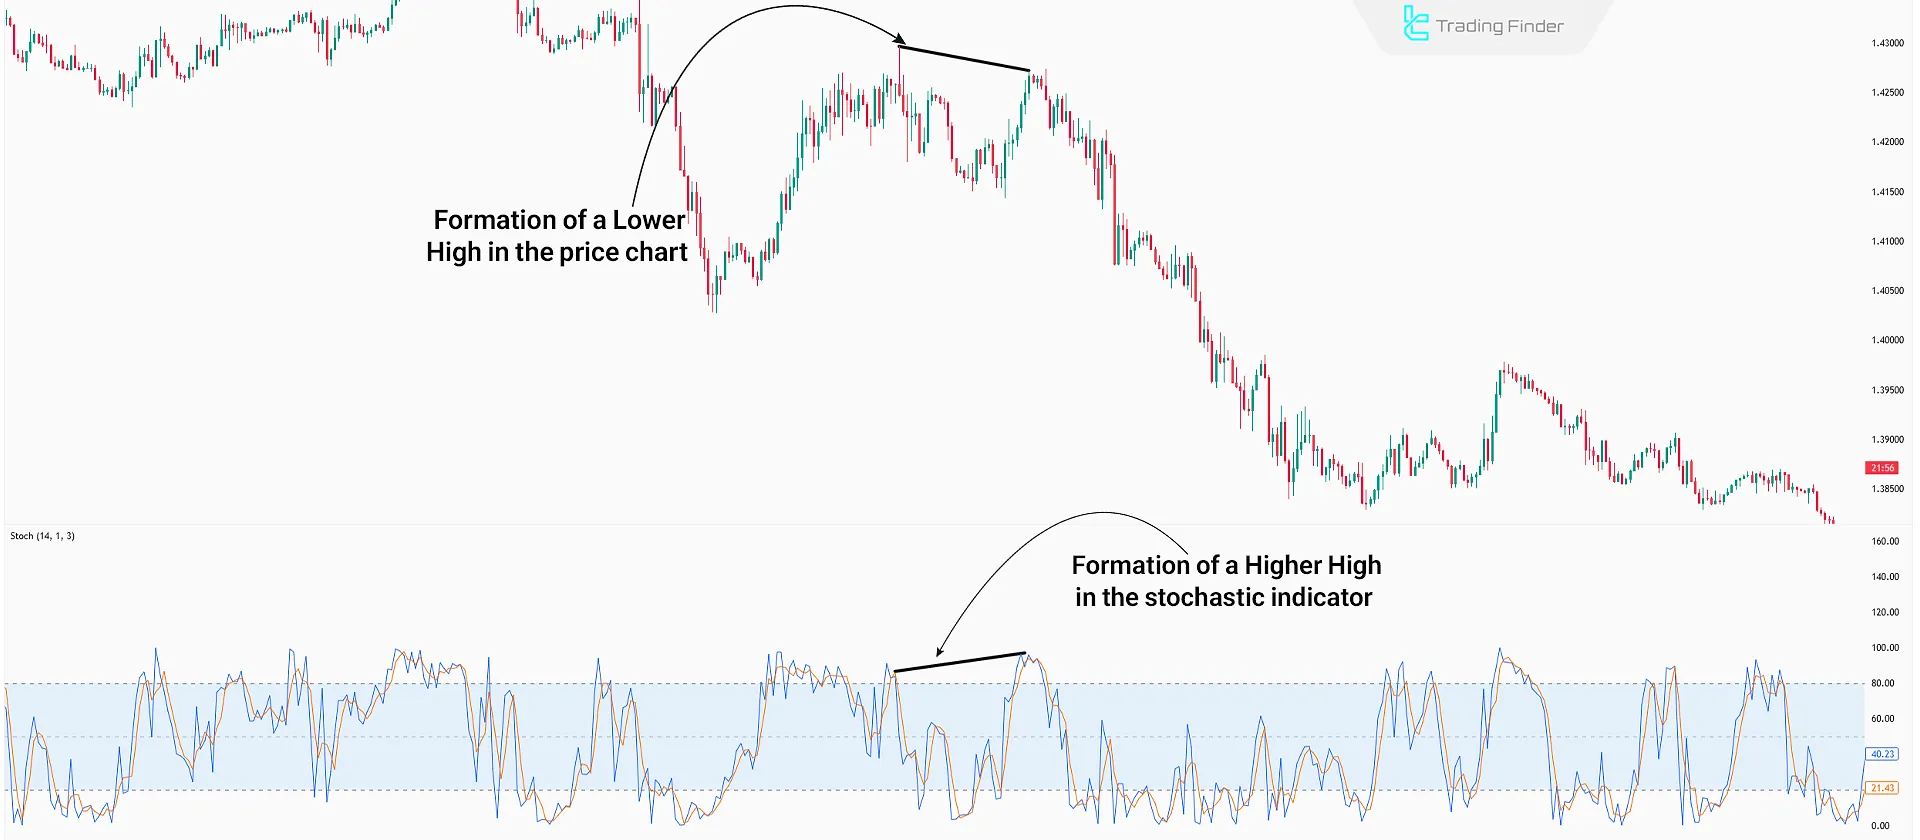
Example of Identifying Hidden Divergence in the Stochastic Indicator
In this example, the price forms a lower high while the stochastic indicator displays a higher high.
This divergence is a bearish hidden divergence and typically signals the continuation of the existing downtrend. This situation is one of the key examples of divergence stochastic in strong trends.
Trading Strategy Using the Stochastic Oscillator and Candlestick Patterns
This trading strategy combines the stochastic indicator with candlestick patterns, filtering signals to improve accuracy and success rate.
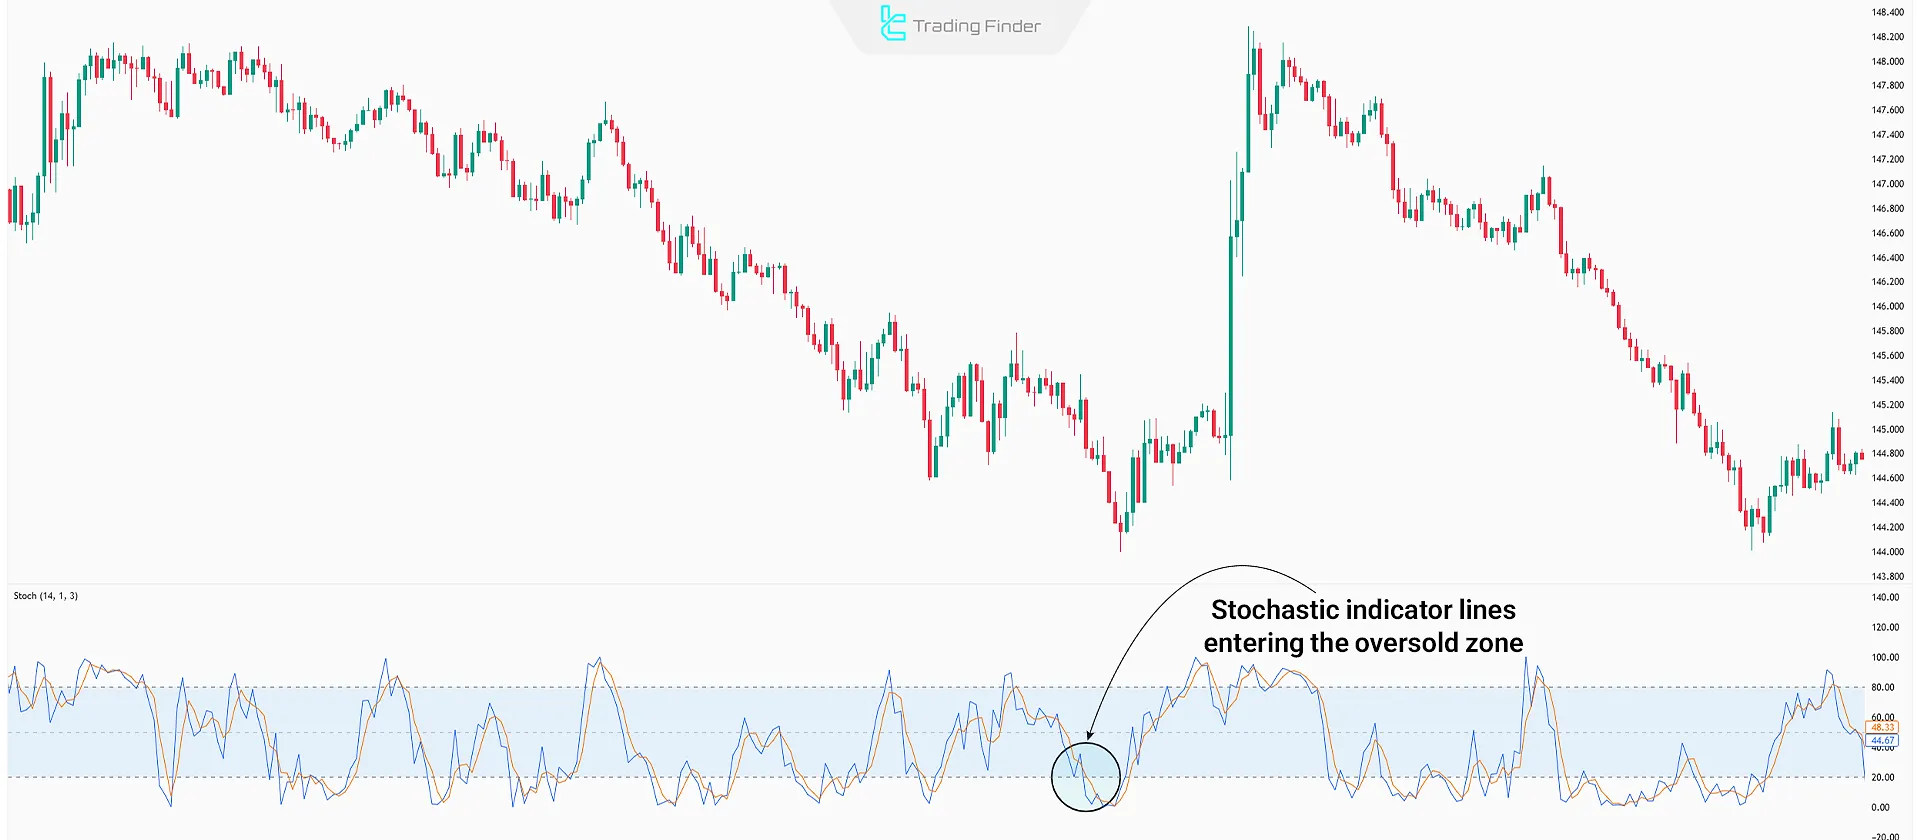
#1 Stochastic Lines Enter the Extreme Zone
The first step is for the stochastic lines to enter the overbought or oversold areas:
- If the lines enter the overbought area, Look for a sell opportunity;
- If lines enter the oversold area, Look for a buy opportunity.
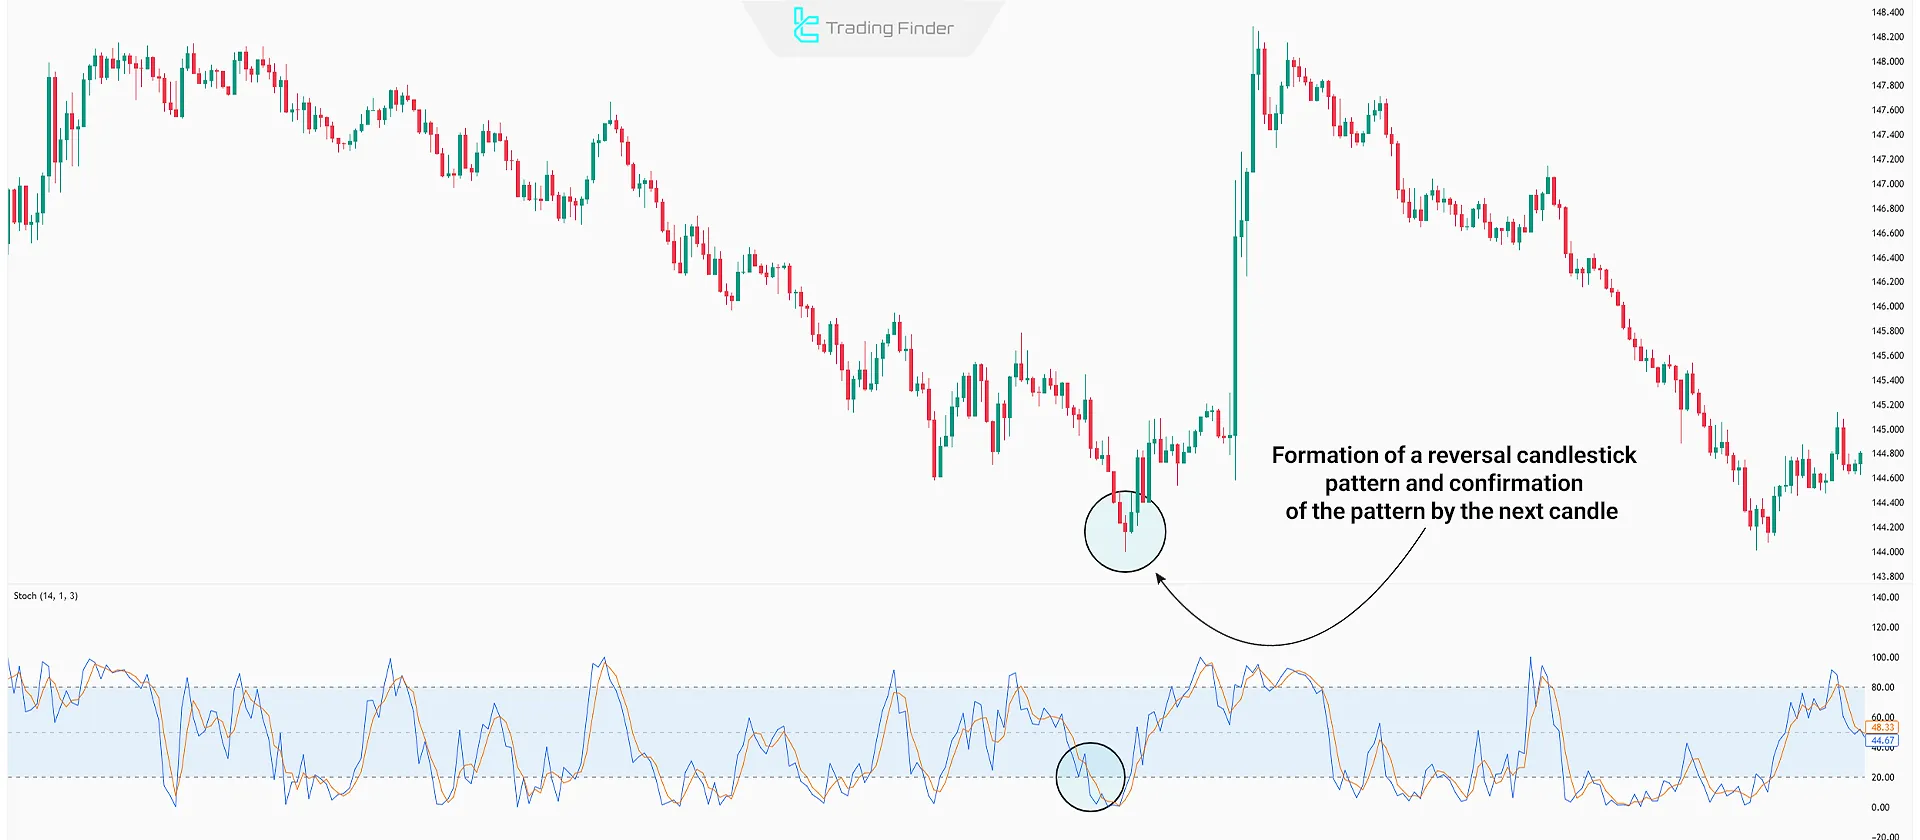
#2 Formation of Candlestick Pattern
Once the price enters an extreme zone, a candlestick reversal pattern such as the Hammer should form on the price chart and be confirmed by the next candle.
Note: Entering a trade before the confirmation candle may reduce the success rate of this strategy.
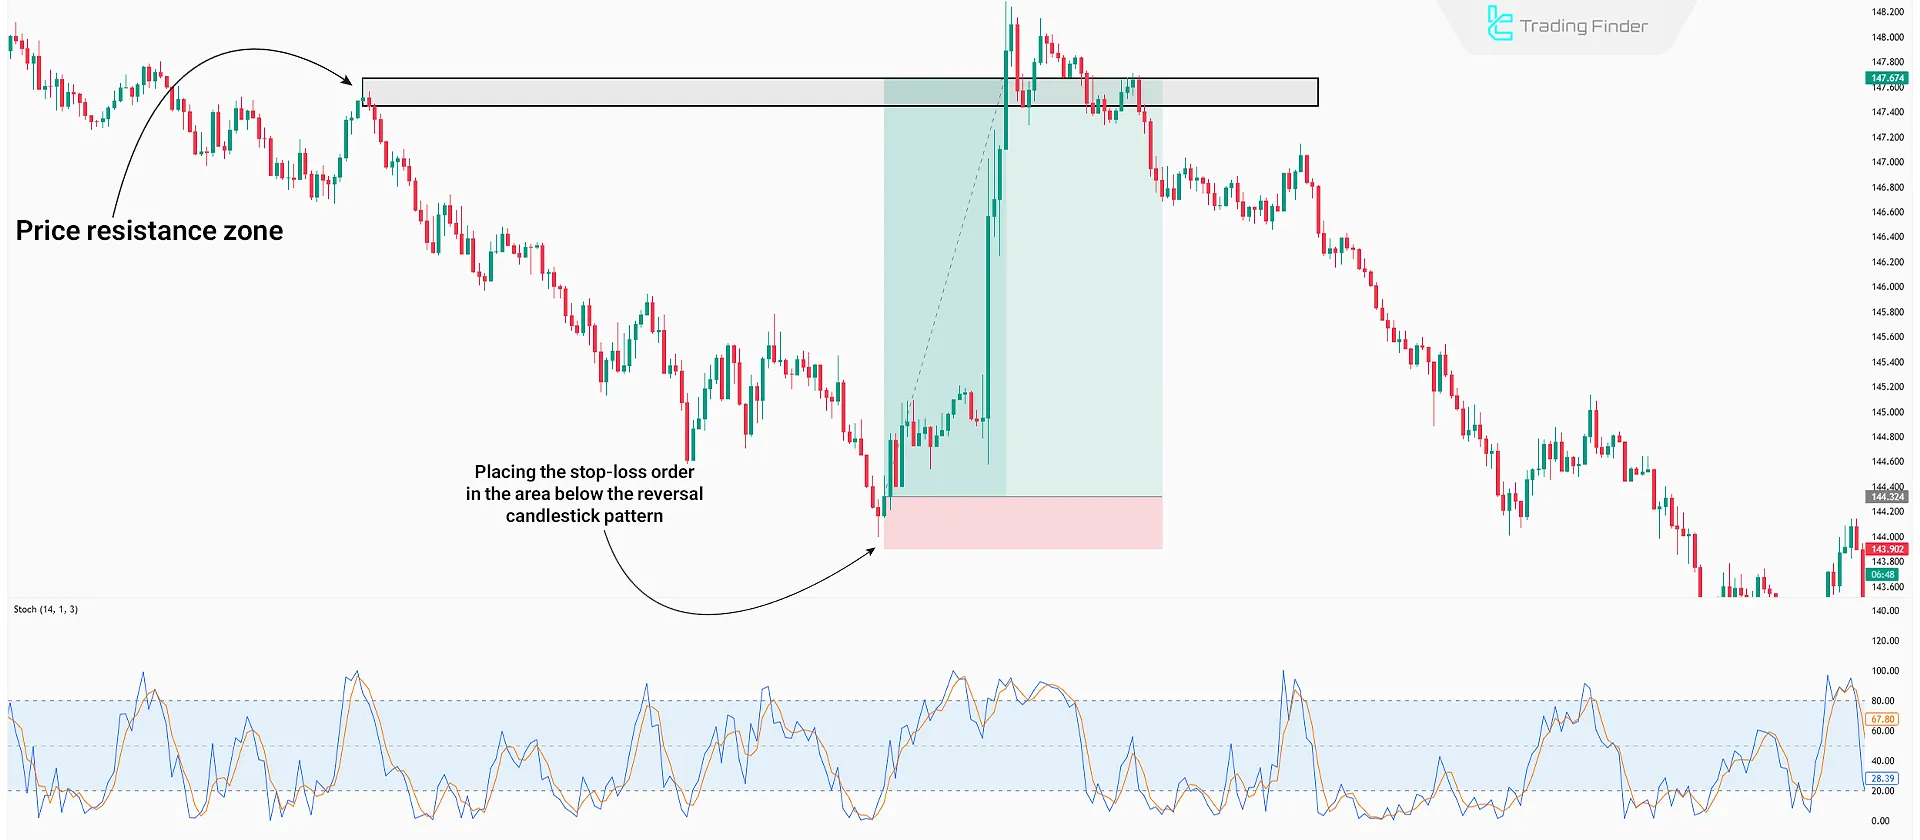
#3 Trade Entry
After the confirmation of the reversal candlestick pattern by the next candle, a trade signal is generated in the direction of the candlestick confirmation.
- The stop-loss order should be placed above the reversal candlestick (in case of a sell trade) or below it (in case of a buy trade);
- The take-profit level should be placed at the next key level, such as a support or resistance area.
Examples of Entry and Exit Rules Based on Crossovers and Overbought or Oversold Zones
A buy entry becomes suitable when the %K line crosses above the %D line from below, the indicator moves out of the zone below twenty, and a bullish confirmation candle forms.
For sell entries, the opposite conditions apply. These patterns form the basis of many stochastic trading strategy models.
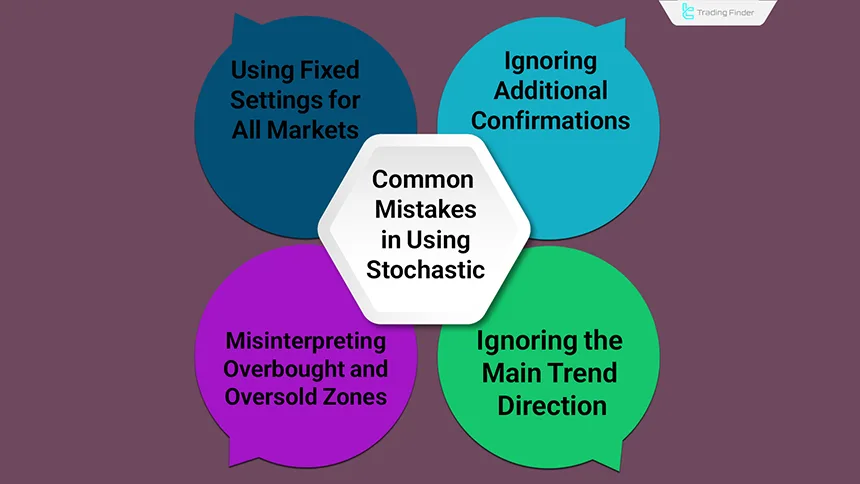
Common Mistakes in Using the Stochastic Indicator
When using the stochastic indicator, several recurring errors among traders often lead to false signals or emotional decisions:
- Misinterpreting overbought or oversold zones: Many traders assume that whenever the indicator enters the overbought or oversold region, they must immediately open a countertrend trade; however, in strong trends, the stochastic may remain in these zones for an extended period without any reversal occurring;
- Ignoring the direction of the main trend: Entering trades solely based on %K and %D crossovers without considering the broader market structure is one of the primary causes of mistakes. Signals aligned with the trend always have higher validity;
- Using fixed settings for all markets: A single period setting is not suitable for all assets. The indicator parameters must be adjusted based on price volatility and timeframe;
- Neglecting additional confirmations: The stochastic indicator performs better when combined with tools such as support and resistance levels, moving averages, or candlestick patterns to reduce the likelihood of errors.
Combining the Stochastic Oscillator with Other Technical Indicators
The stochastic indicator is highly compatible with other technical tools. Combining this stochastic oscillator with indicators like the Moving Average (MA), Relative Strength Index (RSI), or MACD can improve the effectiveness of your trading analysis.
Stochastic Indicator + Moving Average (MA)
A long-period moving average (e.g., 200-period) can act as dynamic support or resistance.
When the stochastic indicator issues a bullish signal and the price is positioned above the moving average, the signal becomes more reliable.
Combined Decision-Making Pattern with the Moving Average
To reduce false signals, the stochastic indicator can be used alongside a moving average. When the price is positioned above the moving average, buy signals become more reliable, and the opposite is true for sell signals.
This method is used in many strategies based on the stochastic oscillator.
Stochastic Indicator + Relative Strength Index (RSI)
Using the RSI alongside the stochastic oscillator helps traders enter positions faster with more confirmation.
For instance, if a divergence appears on the stochastic but the lines haven’t yet reached overbought or oversold zones, traders can consult the RSI for confirmation.
If the RSI also indicates overbought or oversold conditions, the trader may proceed with the trade in the direction of the divergence.
Stochastic Indicator + MACD
When divergences appear on both the stochastic indicator and the MACD histogram, traders can use this to filter out false signals more effectively.
For example, if a divergence is identified on the stochastic oscillator but is not confirmed on the MACD histogram, the validity of the stochastic signal is reduced therefore, that signal should be ignored or treated with caution.
Difference Between Stochastic and RSI
Although both Stochastic and RSI are momentum oscillators, their calculation logic is different. The Stochastic indicator measures the closing position of price relative to its range, while RSI evaluates the strength of bullish and bearish movements.
Understanding these differences is essential for analyzing patterns such as stochastic bullish divergence.
Comparison Table of Stochastic and RSI:
Features | Stochastic Indicator | RSI Indicator |
Type of Tool | Momentum Oscillator | Momentum Oscillator |
Calculation Logic | Compares the closing position of price relative to the range in a given period | Measures the strength of upward movements against downward movements in the same period |
Oscillation Range | Between 0 and 100 | Between 0 and 100 |
Key Zones | Overbought above 80 and oversold below 20 | Overbought above 70 and oversold below 30 |
Suitable For | Range-bound and sideways markets | Markets with strong trends |
Main Signal | Crossovers of %K and %D lines and exiting overbought or oversold zones | Breaking above or below the 30 or 70 levels and divergences with price |
Reaction Speed | Faster and more sensitive to changes | Slower and more stable in trends |
Combined Application | Suitable for confirming divergences with RSI or MACD | Can be combined with Stochastic to reduce signal errors |
Application of the Stochastic Indicator in Trending and Range-bound Markets
In range-bound markets, the Stochastic indicator is one of the best tools for identifying short term reversal points. When the indicator exits the overbought or oversold zone, the probability of a price reversal increases.
In strong trends, using the fifty level or a moving average filter helps ensure that only signals aligned with the main direction are taken while countertrend signals are filtered out.
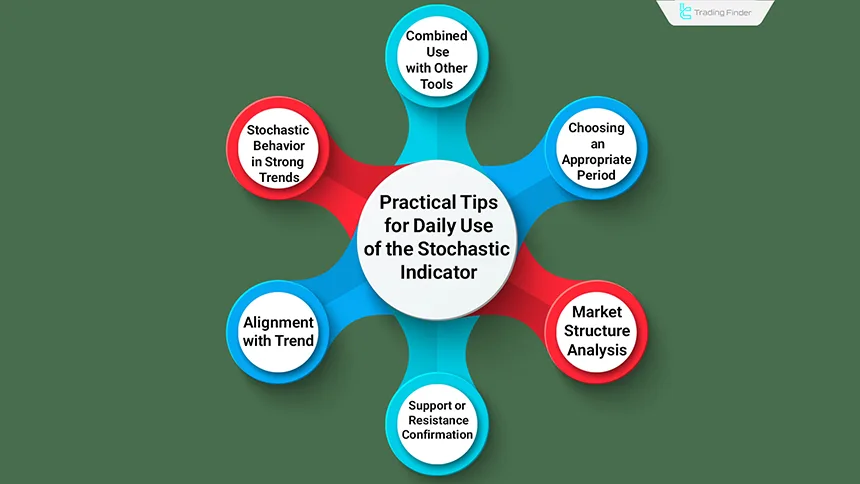
Practical Notes for Traders in Daily Use of the Stochastic Indicator
The Stochastic indicator is most effective when used alongside market structure. If the indicator exits the overbought or oversold area and a confirmation candle forms at a support or resistance zone, the probability of a price reversal increases.
Practical notes for daily use of the Stochastic indicator:
- Candlestick confirmation at support or resistance: the combination of the indicator exiting the overbought or oversold zone with the formation of a confirmation candle at a support or resistance area increases the likelihood of a price reversal;
- Market structure analysis: combining the Stochastic indicator with the examination of price highs and lows or supply and demand zones increases signal accuracy;
- Alignment with the main trend: signals generated in the direction of the dominant market trend have higher validity and generally produce better results;
- Stochastic behavior in strong trends: in powerful trends, repeated overbought or oversold conditions are not necessarily signs of reversal and may confirm trend continuation;
- Selecting a suitable period: adjusting the indicator period based on timeframe, such as 14 for daily or 9 for hourly, makes signals more accurate and practical;
- Combined use with other tools: it is better to use the Stochastic indicator alongside tools such as moving averages or trading volume to avoid false signals.
Complete Stochastic Indicator
The Complete Stochastic indicator is one of the precise momentum analysis tools that displays changes in the strength of buyers and sellers at every stage of price movement.
By combining three main lines named %K, %D, and %K Slow, this indicator tracks price behavior within the 0 to 100 range and helps the trader identify reversal points and overbought (Overbought) or oversold (Oversold) conditions in time.
In the complete version of the Stochastic indicator, the blue %K line shows the fastest reaction to price changes and directly represents market momentum.
The green %D line is a smoothed moving average that reduces the fluctuations of the K line and provides more reliable signals. Finally, the orange %K Slow line reduces reaction speed, creating an effective filter for eliminating short term noise and allowing the trader to observe the true market trend more clearly.
When the indicator lines are below the 20 level and the %D line crosses the %K Slow line upward from below, a bullish movement is likely to begin.
Conversely, in the zone above 80, if %D crosses the %K Slow line downward from above, a continuation of the bearish trend can be expected.
These patterns perform reliably in various markets including Forex, stocks, and cryptocurrencies, and are especially useful for identifying reversal points at the end of waves.
The Complete Stochastic indicator is applicable in both range-bound and trending conditions. In neutral markets, overbought and oversold zones offer the best entry and exit opportunities, while in trending markets, line crossovers serve as momentum confirmations in the prevailing direction.
Combining this indicator with tools such as the Moving Average, RSI, or Fibonacci levels increases signal validity and helps the trader develop a more structured trading strategy.
Conclusion
The stochastic oscillator is a momentum-based indicator that compares the current closing price to the high and low prices over a specified period (typically 14 days).
It consists of two lines, %K and %D, that oscillate between 0 and 100. The levels above 80 indicate overbought conditions, and the levels below 20 indicate oversold conditions.
The indicator can be combined with candlestick patterns, as well as other technical indicators like RSI, MACD, and Moving Averages, to improve signal confirmation and increase the success rate of trading strategies.


