


- TradingFinder
- Education
- Forex Education
- Technical analysis Education
Technical analysis Education
Technical analysis is a method for evaluating price movements in financial markets, emphasizing price charts, chart patterns, trends, trading volume, and indicators. Unlike fundamental analysis, which assesses an asset’s intrinsic value based on economic and financial factors, technical analysis relies on historical price behavior and structured patterns to identify high-probability trading opportunities. Classical technical analysis tools include trendlines, support and resistance levels, price channels, oscillators, and momentum indicators. These tools assist traders in defining market direction, measuring trend strength, and pinpointing precise entry and exit points. Modern technical analysis extends beyond conventional tools, incorporating market structure, liquidity dynamics, and order flow. Advanced methodologies such as price action, the Smart Money Concept (SMC), Inner Circle Trader (ICT) strategies, harmonic patterns, Elliott Waves, and the Read the Market (RTM) approach enable traders to identify institutional liquidity zones, track price manipulation, and refine execution strategies with greater accuracy. TradingFinder offers a comprehensive suite of educational content and analytical tools, bridging classical and modern technical analysis. It equips traders with specialized insights into liquidity models, market structure interpretation, and price movement assessments, enhancing their ability to navigate complex market conditions.
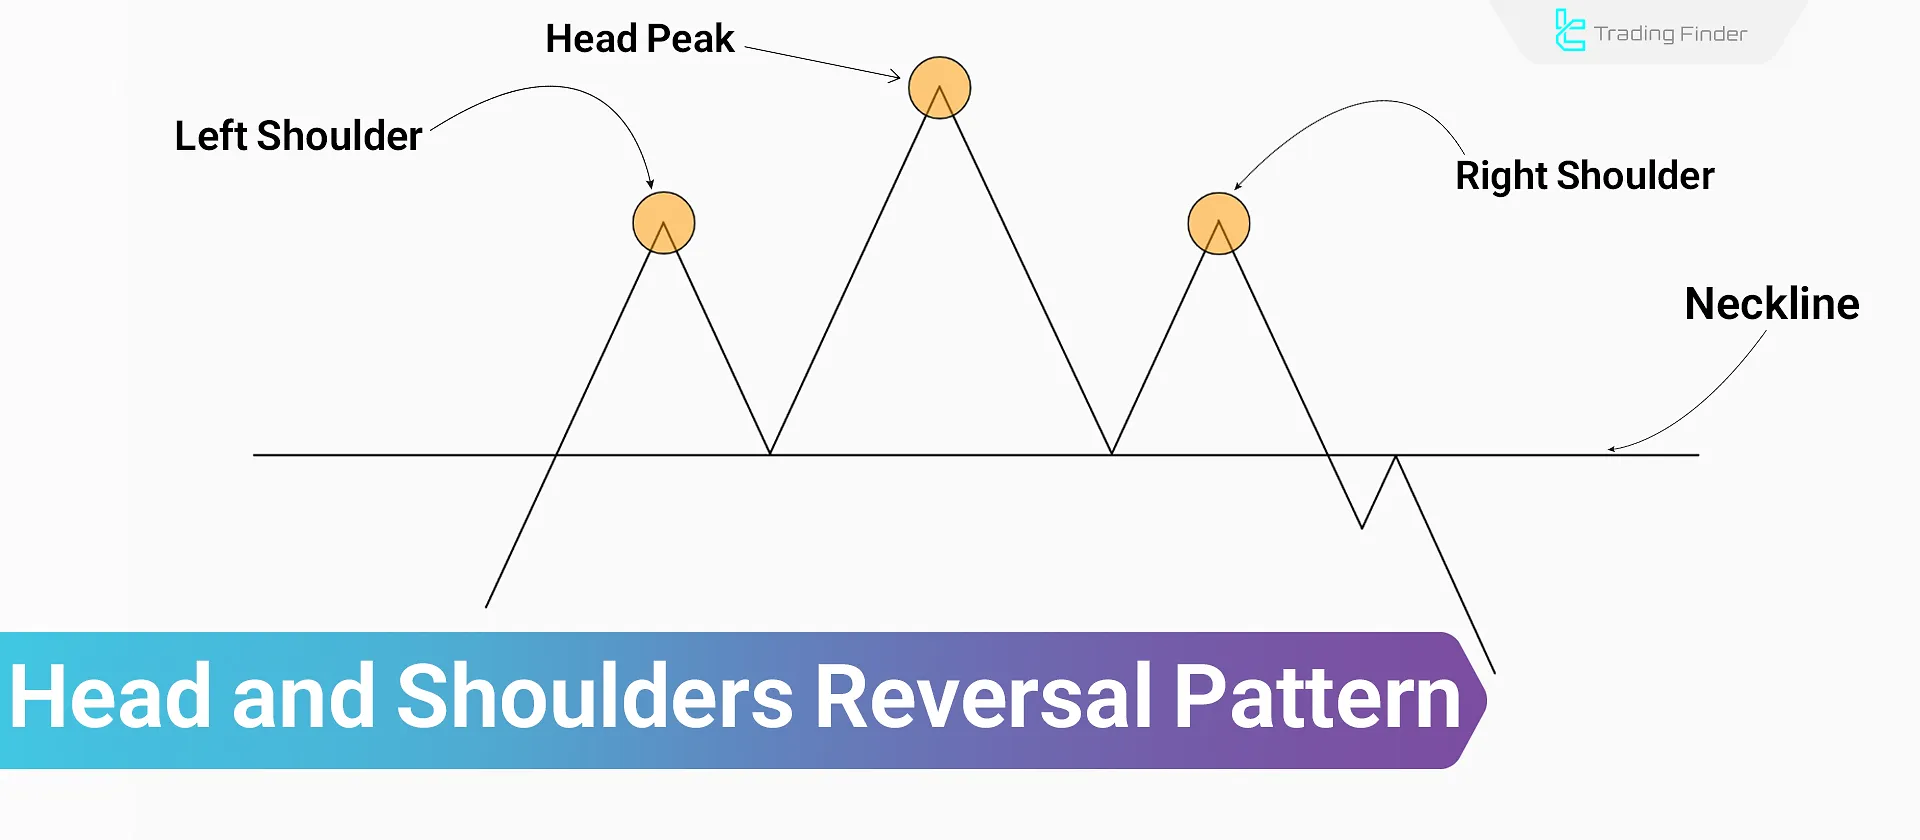
Head and Shoulders Pattern – A Combined Trading Strategy Using RSI Indicator
The head and shoulders pattern is among the classic reversal patterns that reflects shifts in supply and demand sentiment. This...
![Order Block with FVG Confirmation Strategy in ICT [SMC]](https://cdn.tradingfinder.com/image/402972/06-11-en-trade-continuations-using-order-blocks-1.webp)
Order Block with FVG Confirmation Strategy in ICT [SMC]
When traders miss the initial entry point and aim to enter in the middle of a trend, the ICT approach recommends re-entry...
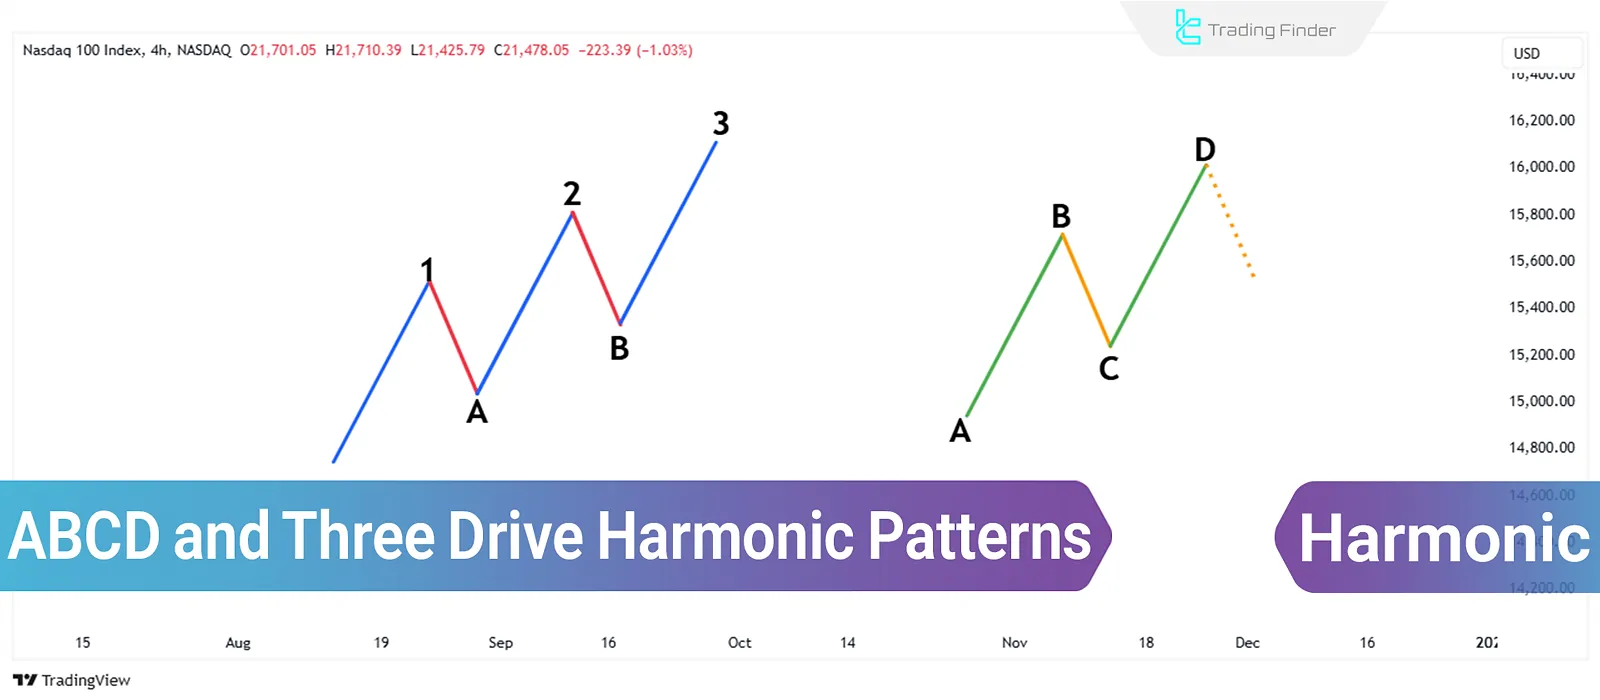
ABCD and Three-Drive; Harmonic Patterns in technical analysis & Fibonacci ratios
Harmonic patterns, based on Fibonacci ratios, are among the tools used in technical analysis. The ABCD pattern and the Three-Drive...
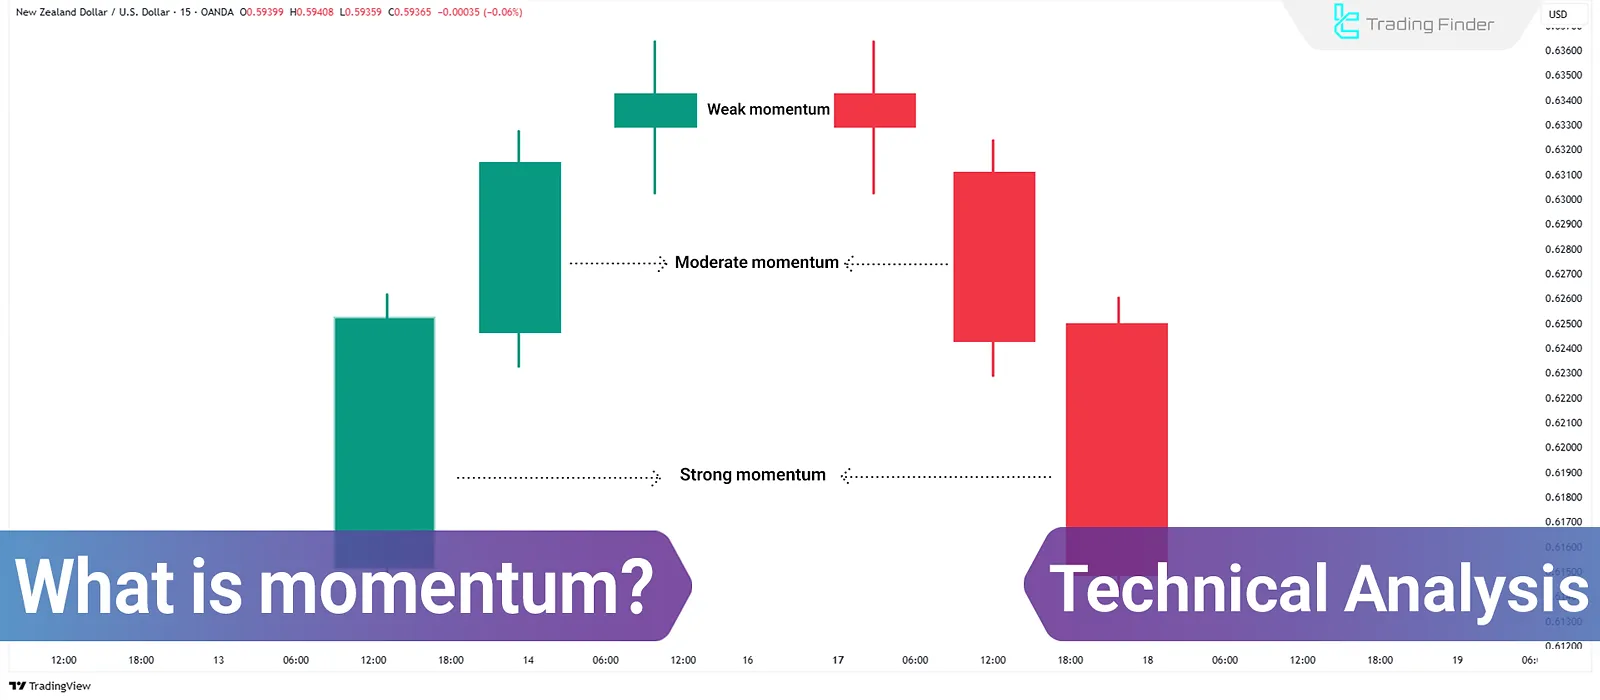
Momentum in Technical Analysis: The Speed and Strength of Price Movement
Among various technical analysis tools, momentum is one of the concepts that examines the speed and strength of pricemovements....

What is Scalping? Best Scalping Trading Strategies
Scalping is a highly fast-paced trading strategy in financial markets where the period between opening and closing trades is only...
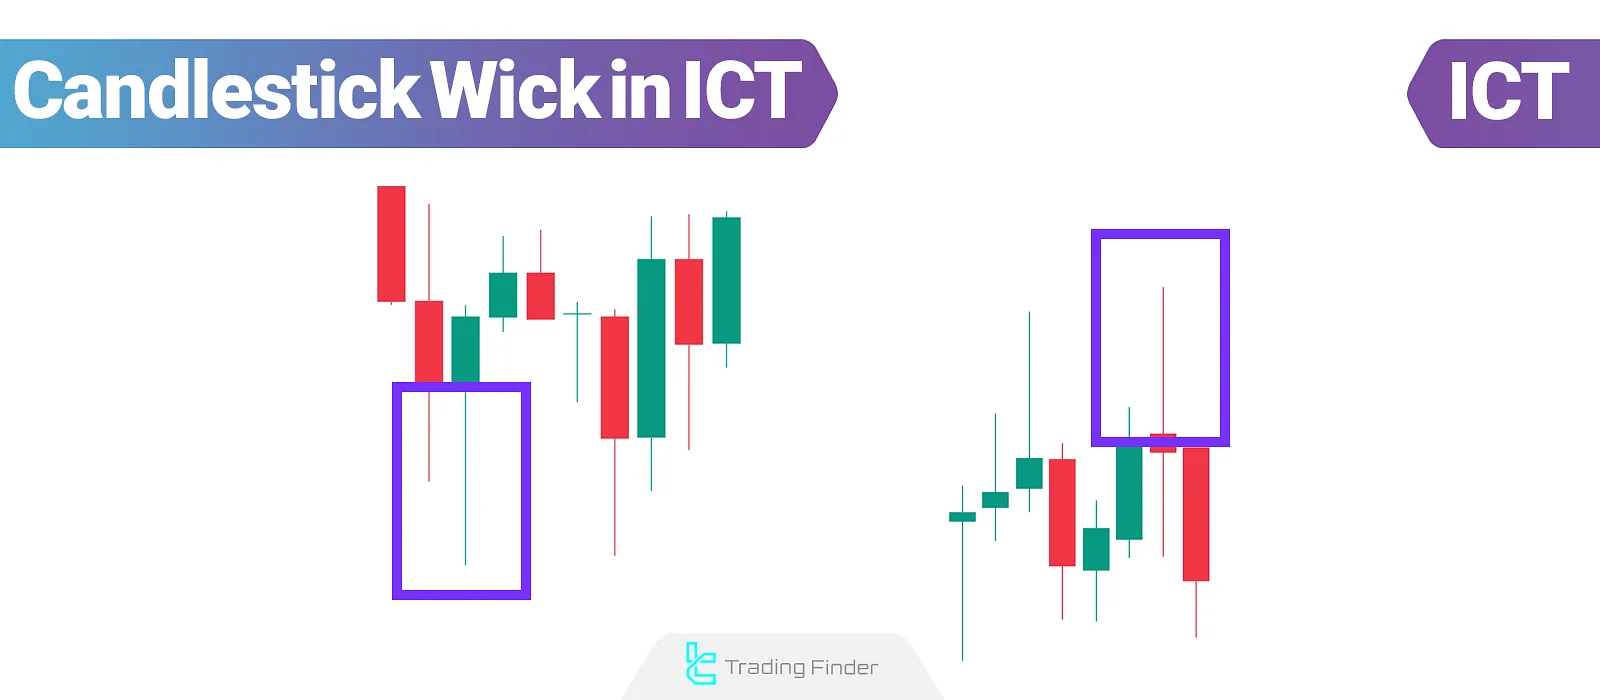
Candlestick wicks in ICT; a Guide to Identifying Market Reversals
The candlestick shadow in ICT reveals is a precise depiction of the market's reaction to key levels and its behavior relative to...
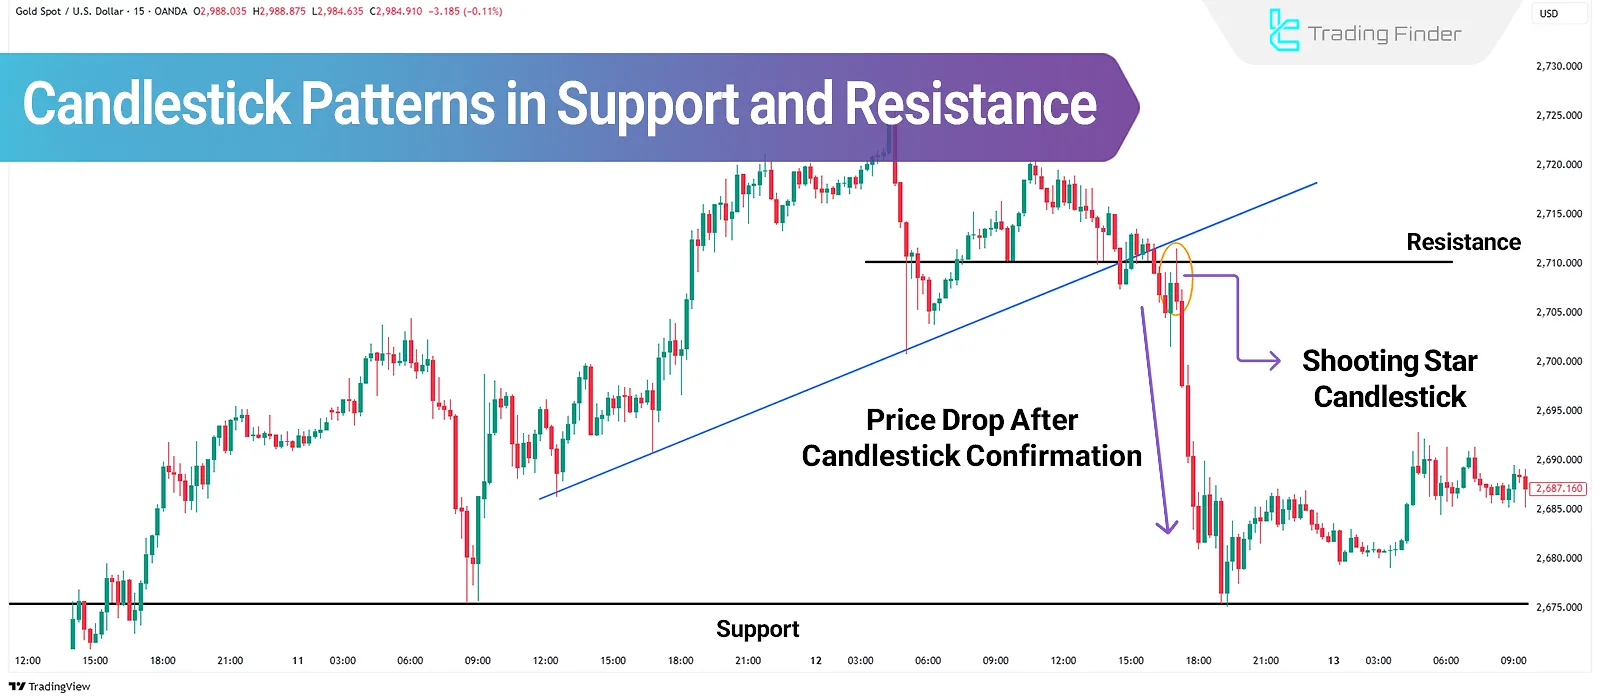
Candlestick Patterns in Support and Resistance; Candle Pattern Trading at S/R
Candlestick patterns, as the foundation of Price Action analysis, reflect order behavior at key supply and demand zones. Combining...
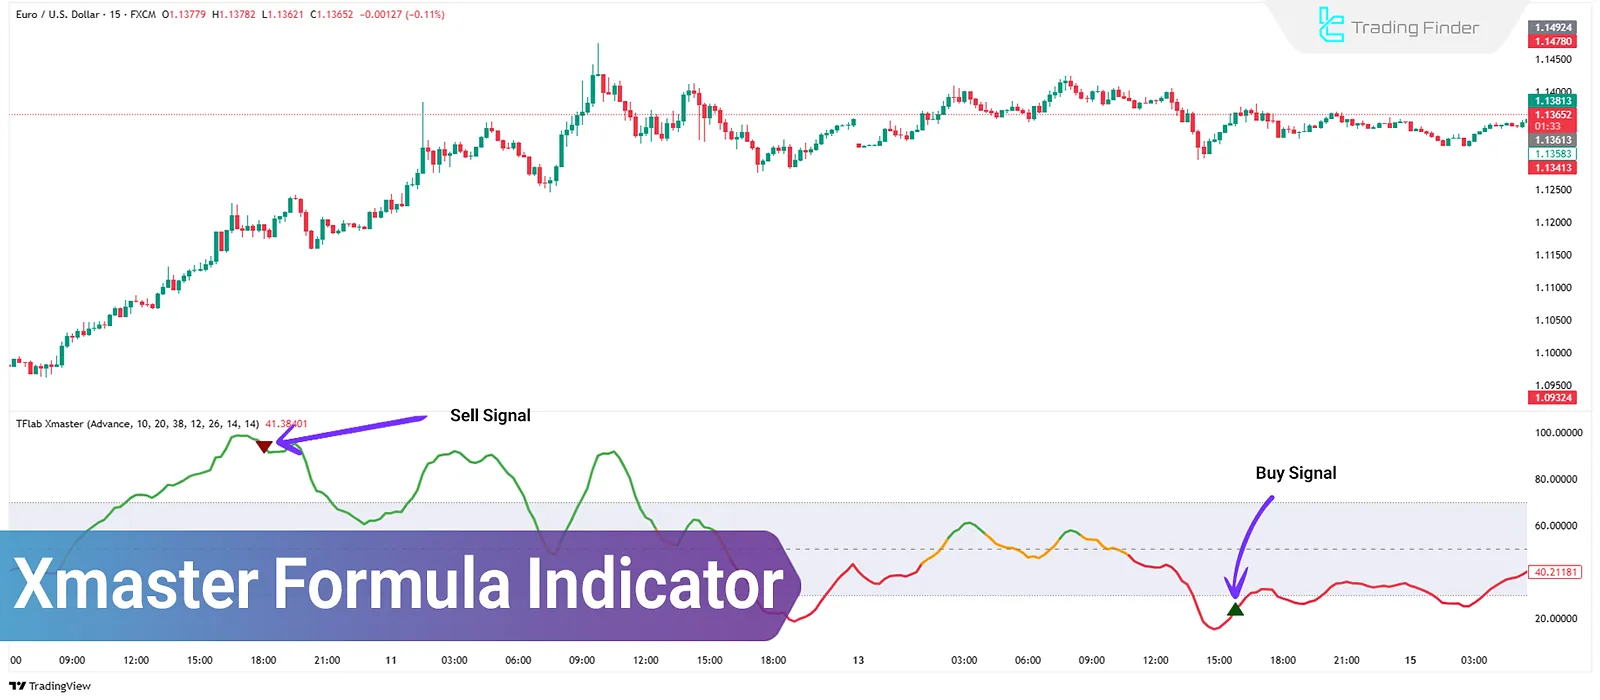
Xmaster (XHMaster) Formula Indicator: Identifying Start/End of Trends
The Xmaster Formula Forex Indicator issuesentry signals based on overbought and oversold zones. A key advantage of this indicator...
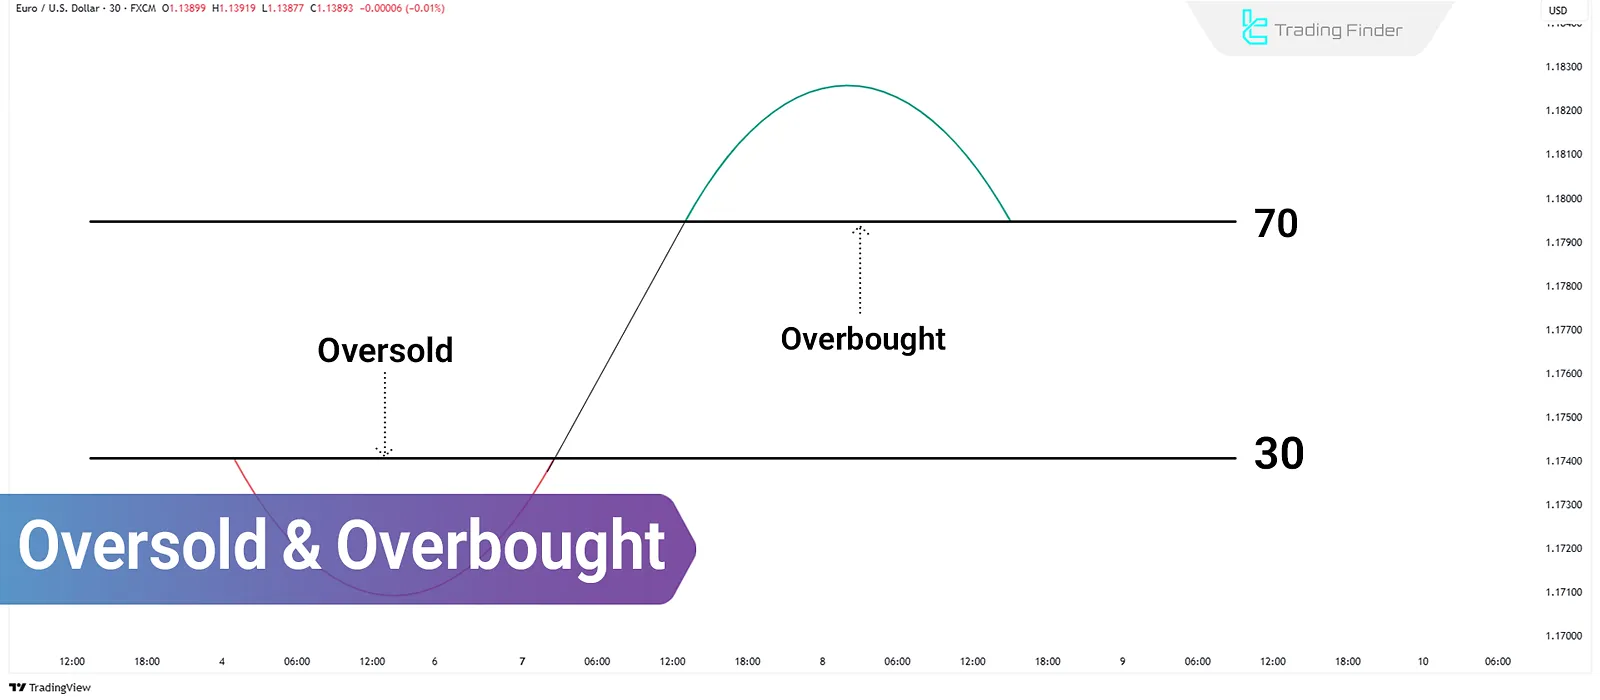
Overbought and Oversold Conditions; Using Tools Like RSI and MACD
Overbought and oversold conditions occur when the price of an asset deviates significantly from its equilibrium or historical...
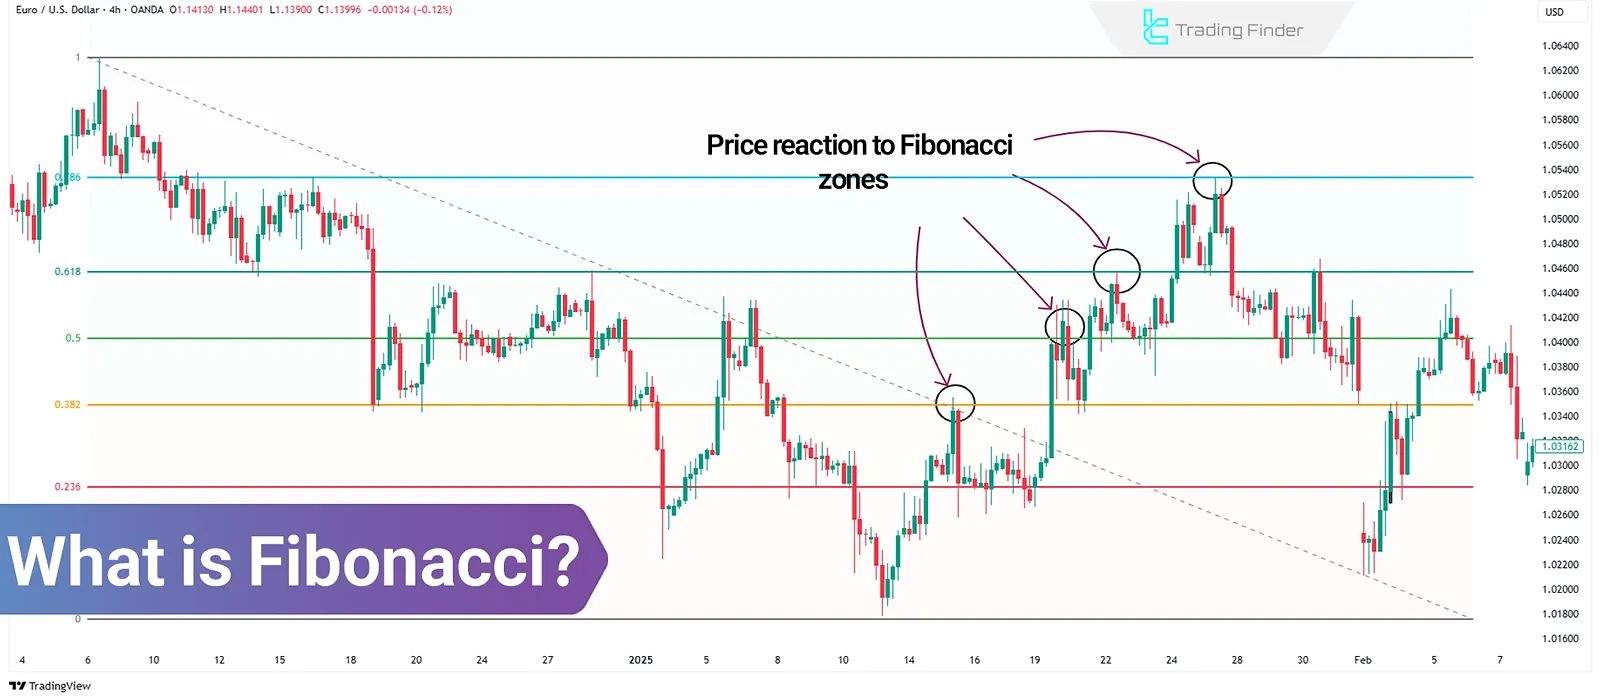
Fibonacci in Technical Analysis: Tools for Reversal & Continuation
In technical analysis of financial markets, Fibonacci ratios and levels are recognized as one of the oldest tools for...
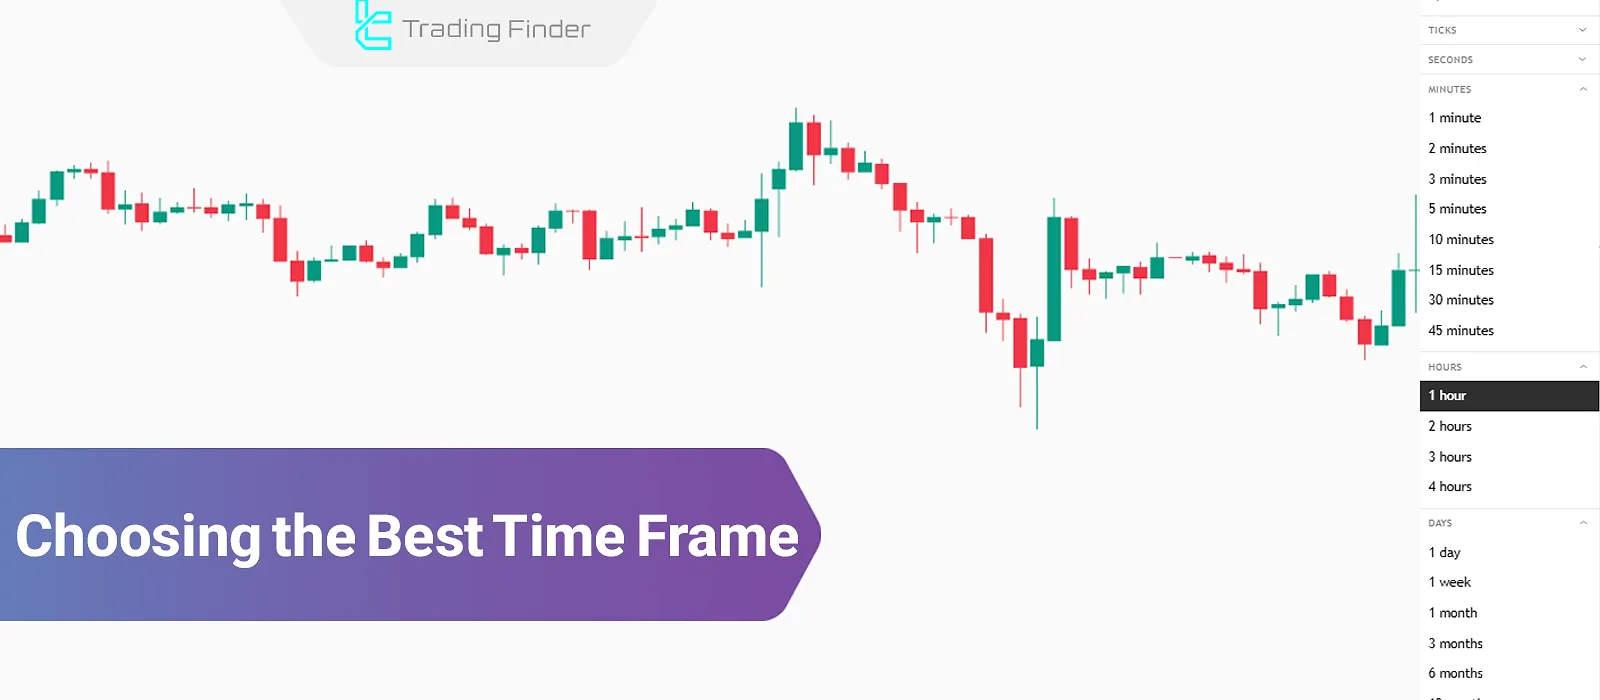
Timeframe Selection Guide – Introduction to Best Timeframe in Technical Analysis
Selecting the best time frame for trading strategies depends on various factors such as analytical style and trading approach,...
![What is MACD? [Combining Exponential Moving Averages (EMA)]](https://cdn.tradingfinder.com/image/362923/03-19-tf-en-macd-01.webp)
What is MACD? [Combining Exponential Moving Averages (EMA)]
The MACD indicator (Moving Average Convergence Divergence) is a trend-following indicator used across all financial markets,...


