


- TradingFinder
- Education
- Forex Education
- Trading Education
Trading Education
Trading refers to the buying and selling of financial assets with the aim of making a profit from price fluctuations. This activity is based on three main pillars: market analysis, risk management, and selecting a trading style suited to market conditions and individual goals. Market analysis in TradingFinder is divided into two categories: technical analysis and fundamental analysis. In technical analysis, the focus is on price behavior, and the trader identifies trend structures, support and resistance zones, and uses charts, price patterns, indicators, and tools such as price action. In fundamental analysis, TradingFinder utilizes economic data such as interest rates, inflation reports, central bank monetary policies, and corporate financials to analyze the intrinsic value of an asset. Trading styles include scalping, day trading, swing trading, and position trading. The trading style is selected by considering the timeframe used, risk tolerance, available time for trading and type of target market.
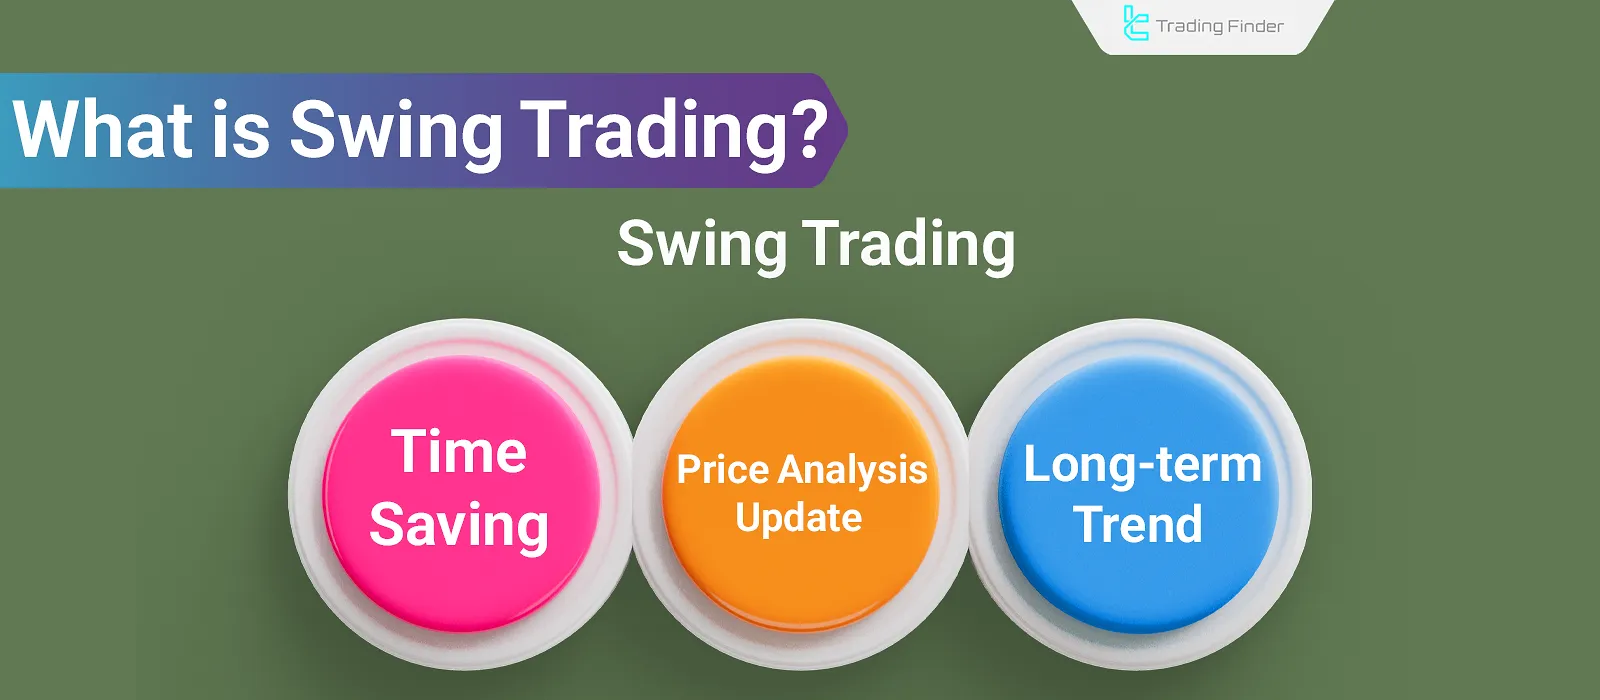
Swing Trading - Strategies Based on Price Reversals, Breakouts, & Retracements
In swing trading, traders analyze the overall market trend and various economic data to identify the long-term direction of price...
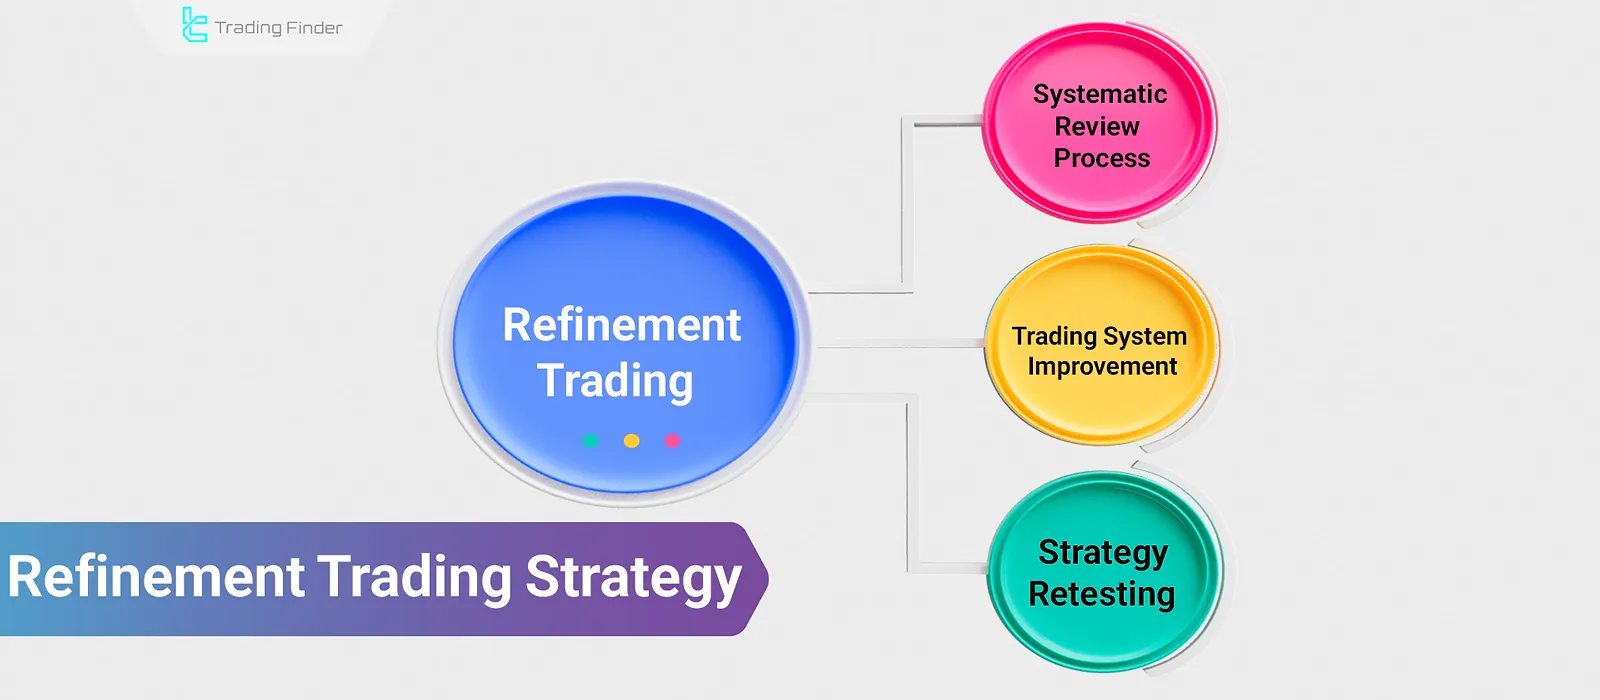
Refinement Trading Strategy; Capital Management Adjustment
In financial markets, none of the trading strategies is reliable in their initial phase. Changes in market structure, price...
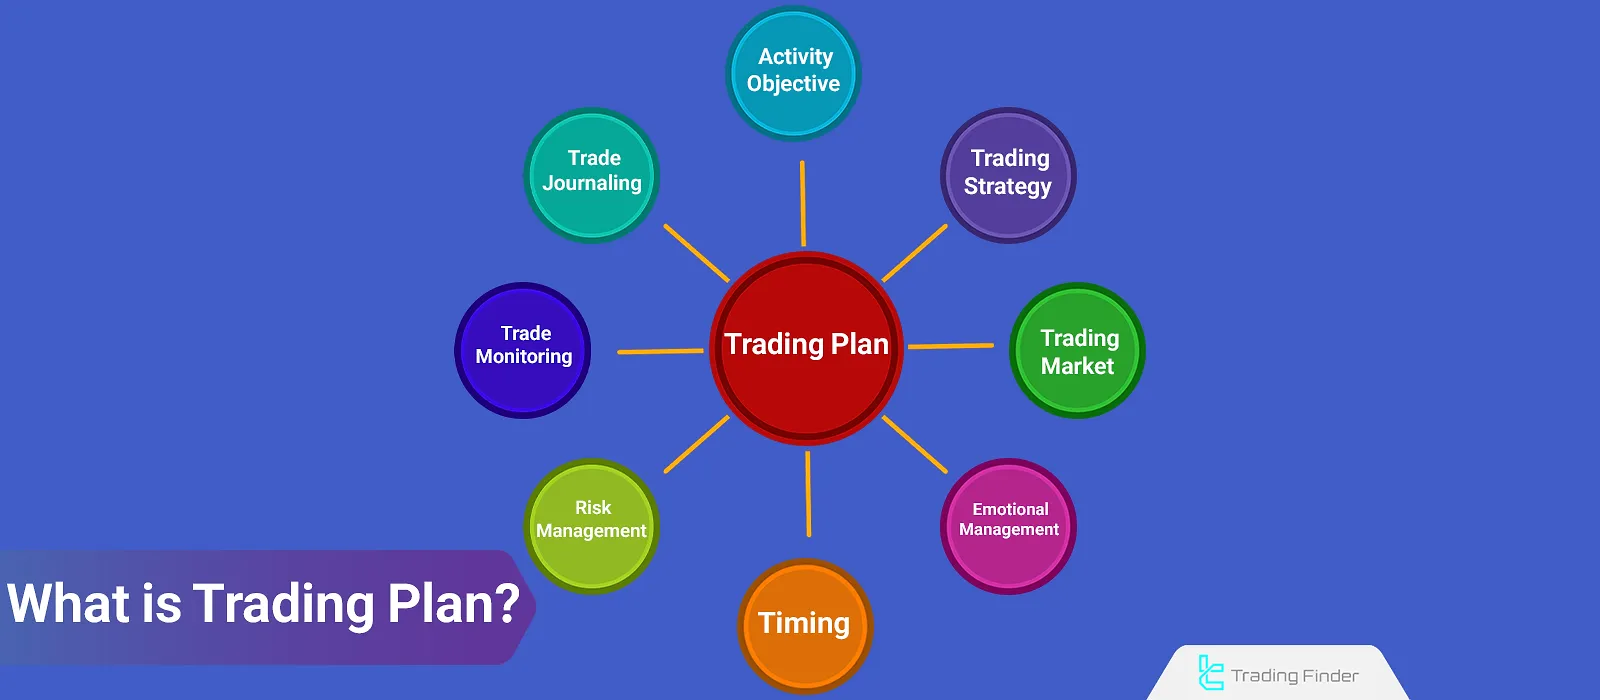
What is a Trading Plan? A Guide to Building a Trading Plan for Different Markets
Atrading plan is a set of rules that governs all activities of a trader. A properly written trading plan helps mitigate the...
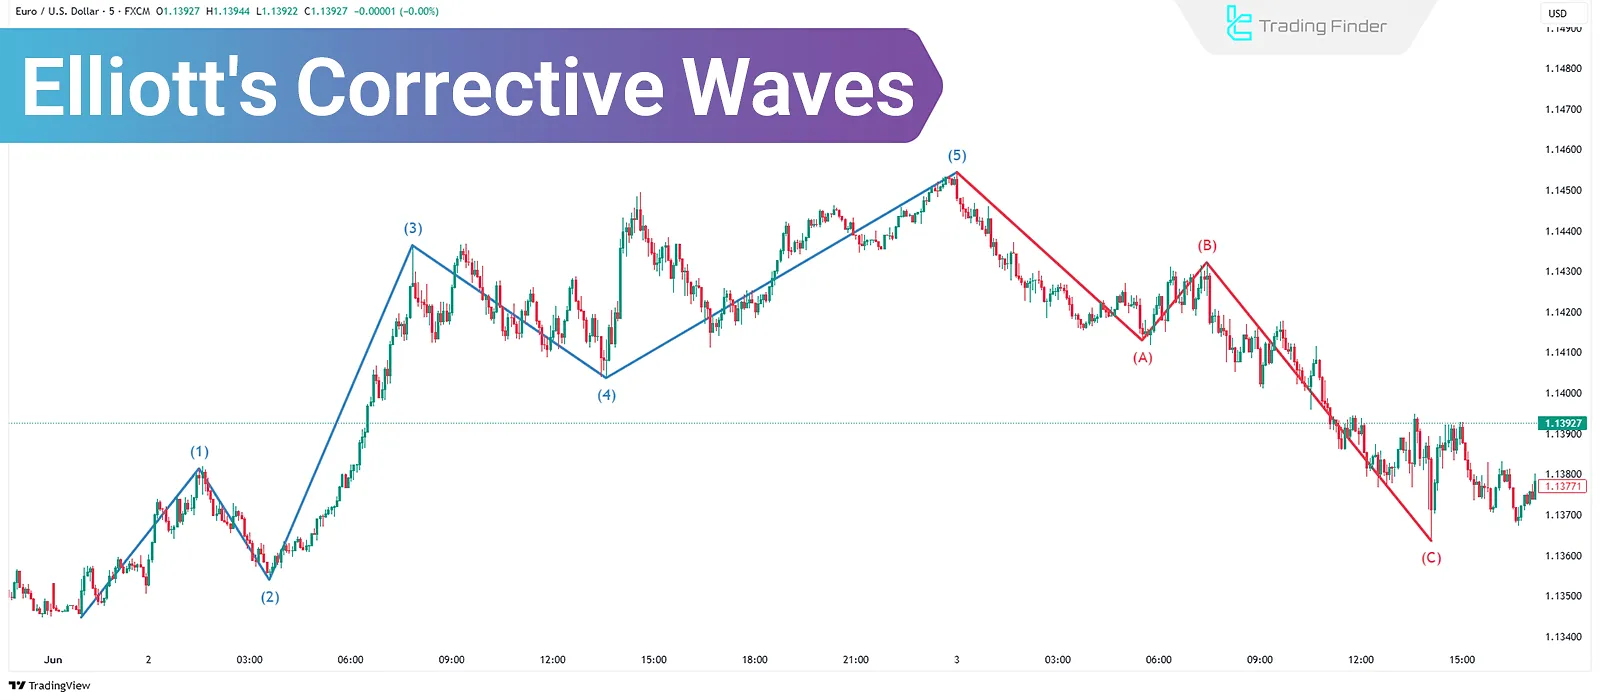
Corrective Waves in Elliott Theory; Training on the Rules of Corrective Waves
Corrective Waves in Elliott Wave Theory are composed of three sub-waves and move against the prevailing trend. Unlike motive...
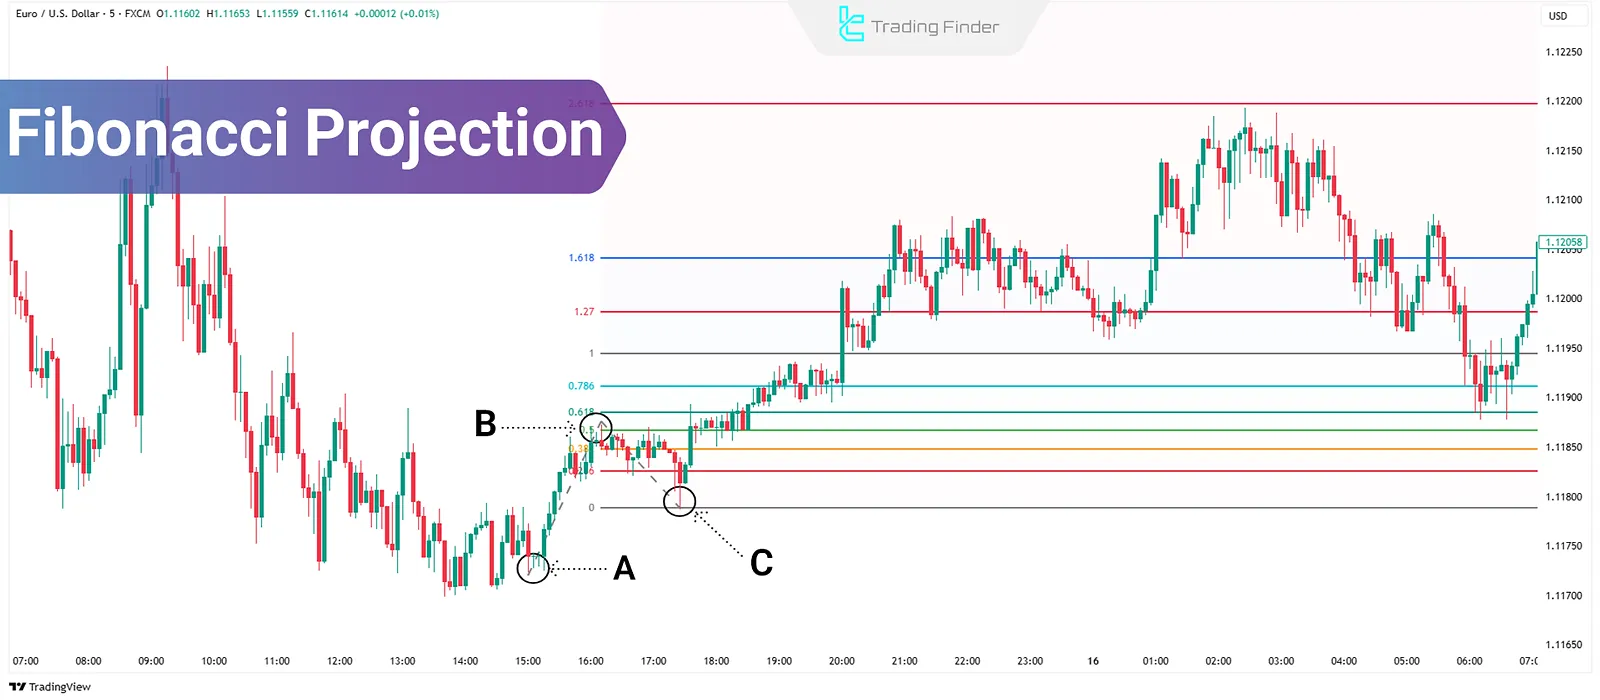
Fibonacci Projection Levels in Technical Analysis: Target Determination
Fibonacci Projection in technical analysis is a tool used to calculate price targets in the direction of a trend. By selecting...
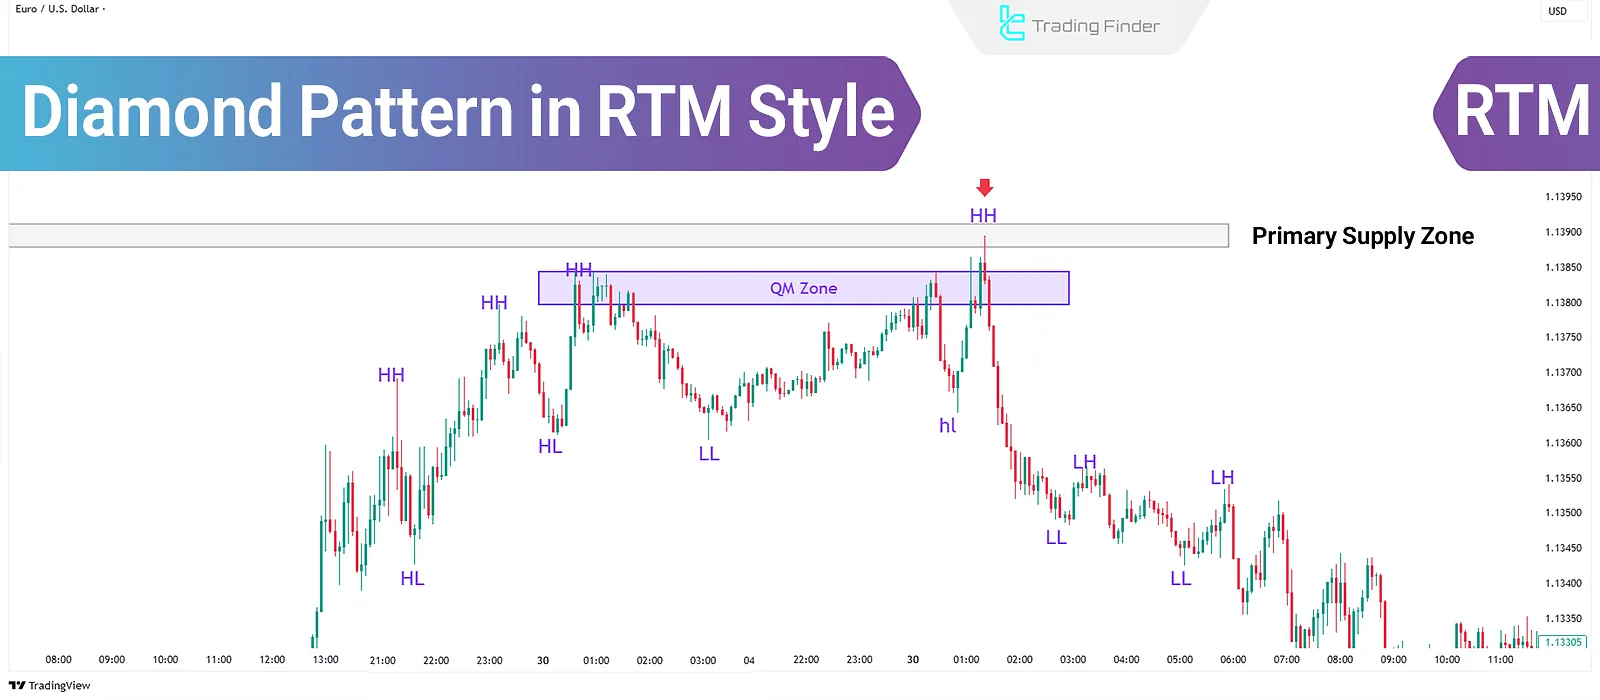
What Is the RTM Diamond Pattern? Trading the Diamond Pattern in the RTM Style
The RTM Diamond Pattern is one of the main patterns in the RTM style that deceives both buyers and sellers. This pattern appears...
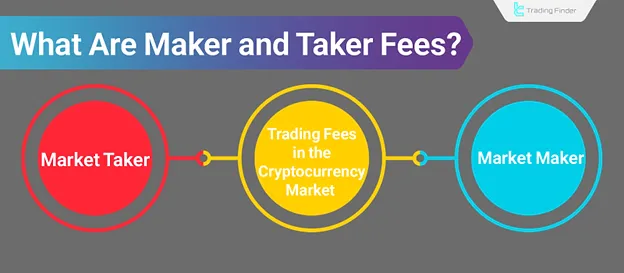
What Are Maker and Taker Fees? Difference Between Maker and Taker
When buying and selling cryptocurrencies on atrading platform, you must pay transaction fees. Generally, trading fees on crypto...
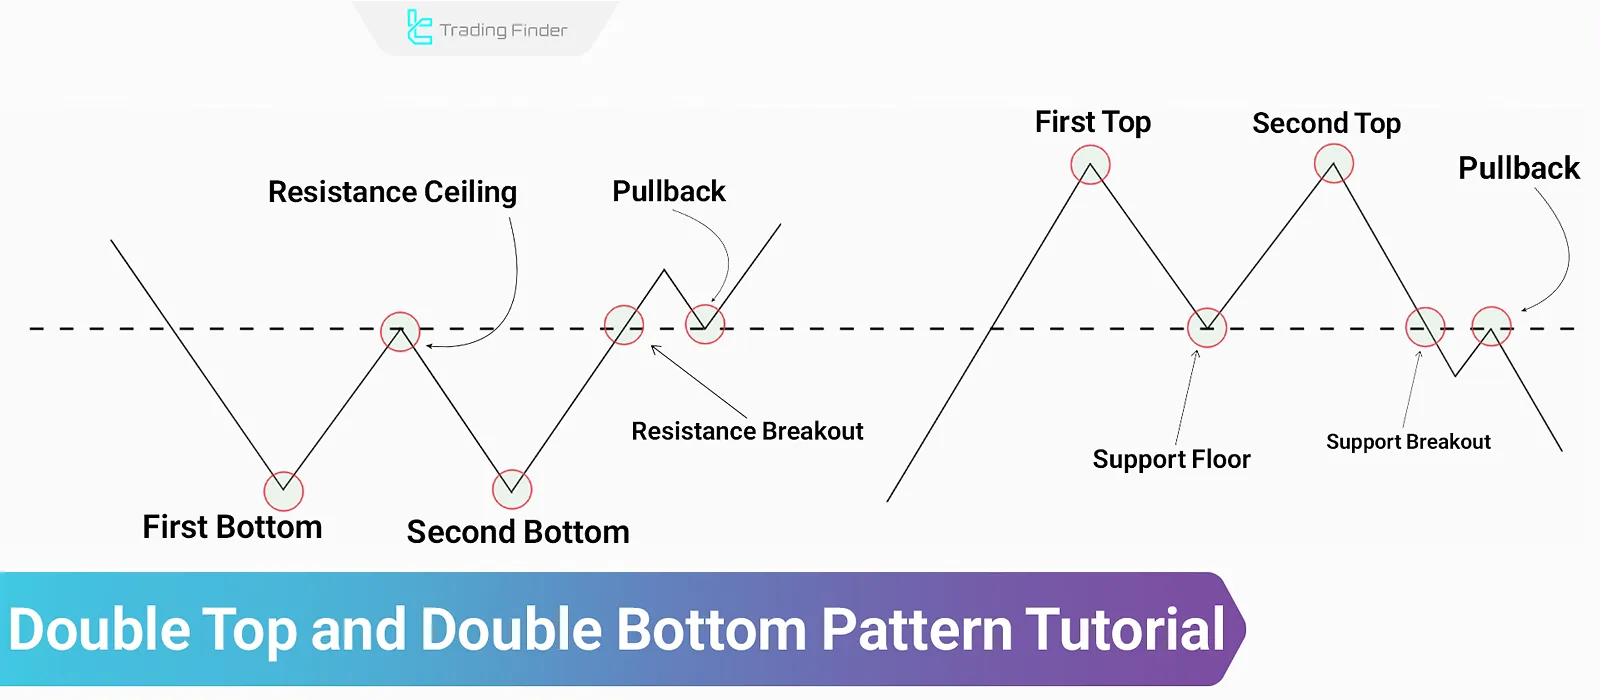
Double Top and Double Bottom – Classic Reversal Pattern
The double top and double bottom patterns are classified under classic reversal patterns in technical analysis. These patterns are...
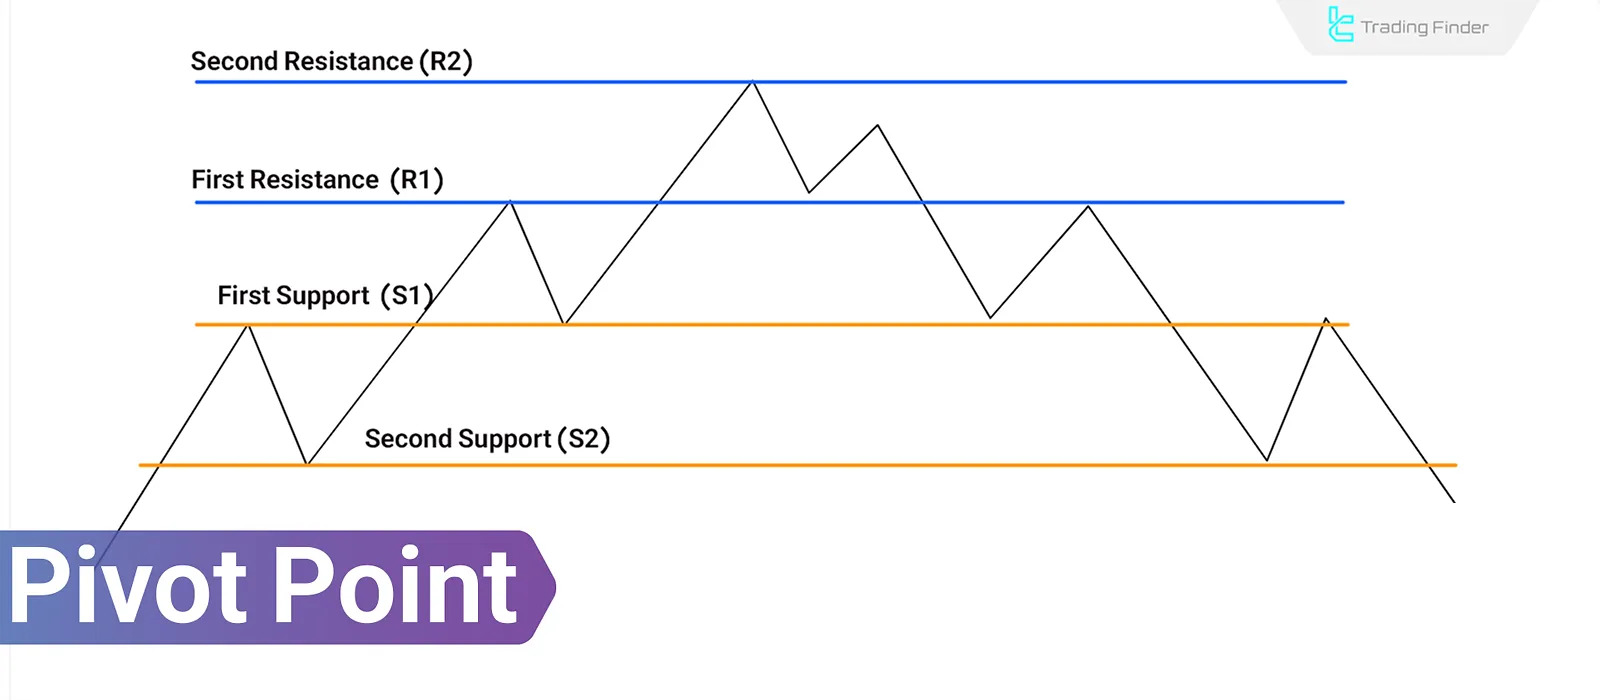
Pivot Point in Technical Analysis: Entry, Exit, Stop-Loss, and Price Targets
A Pivot Point in Technical Analysis is a computational method that identifies key market levels for the next trading day based on...
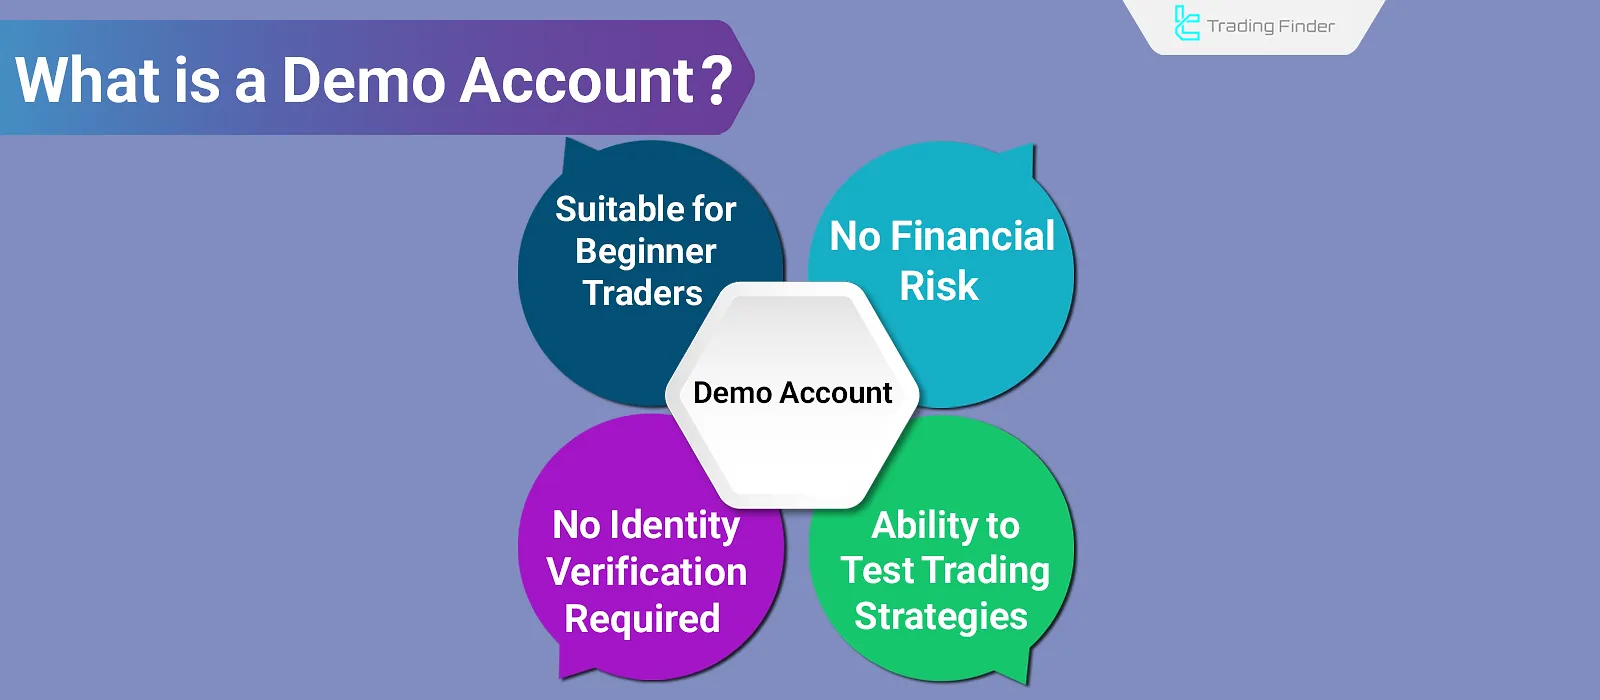
What Is Demo Account? Differences Between Demo and Real Accounts
Ademo account enables users to test and evaluate trading strategies without risking real capital, providing a safe way to enhance...
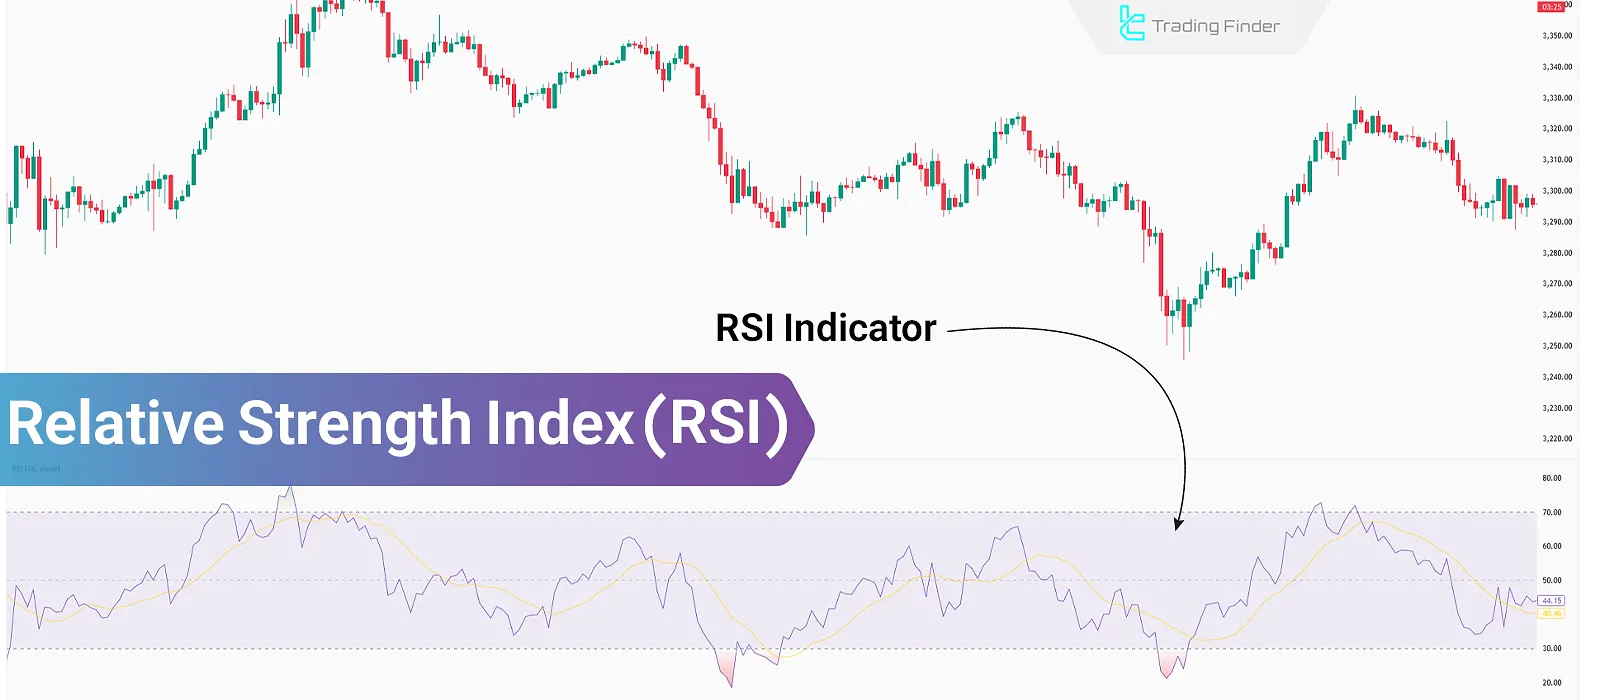
What Is the RSI Indicator? Its Applications and How to Trade It Across Different Markets
The Relative Strength Index (RSI) evaluates the strength of a trend by analyzing the open and close prices of candles over...
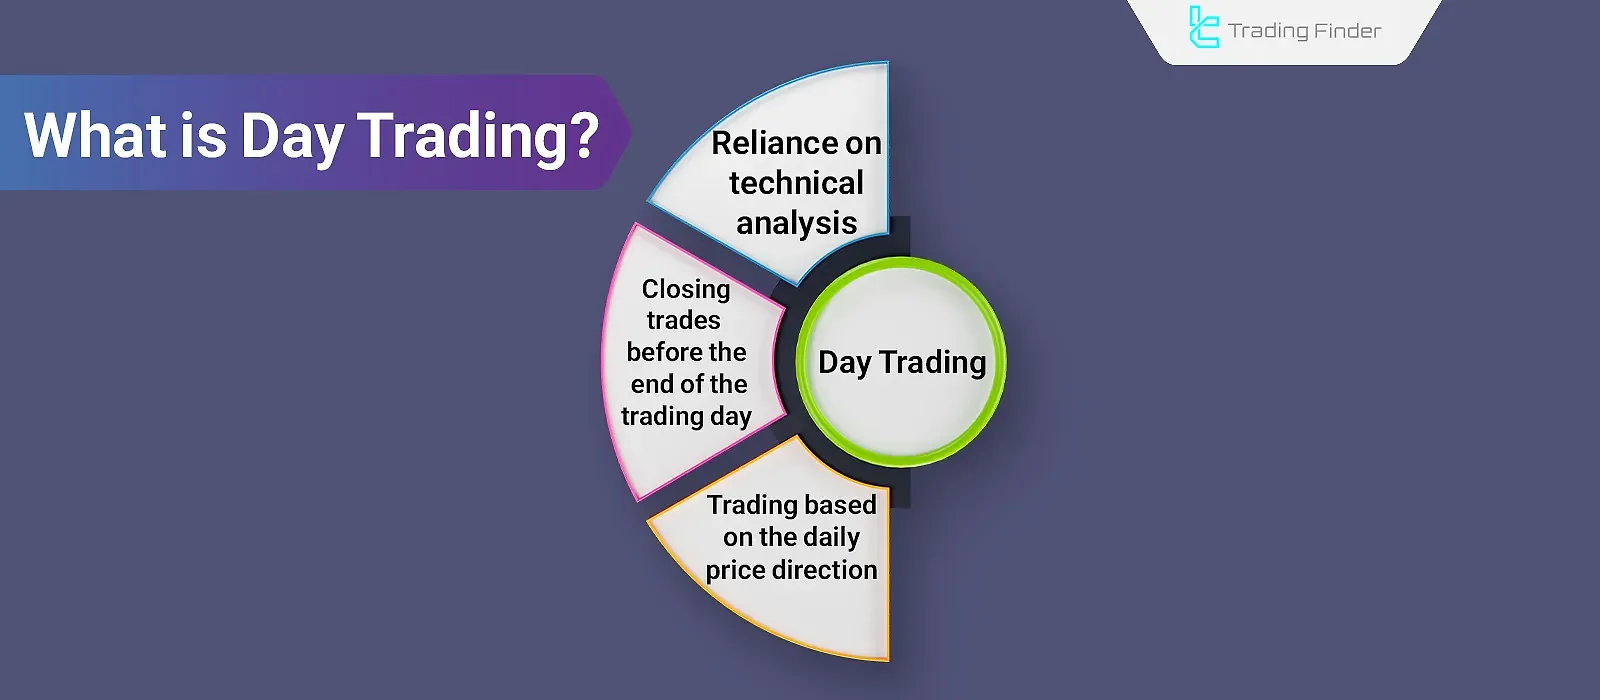
What Is Day Trading? Trade in the Direction of the Trend & Against It
In day trading, traders use technical analysis through various methods, such as ICT style and RTM style (Read The Market), to...


