


- TradingFinder
- Education
- Forex Education
- TradingView Education
TradingView Education
TradingView is an analytical trading platform and social media founded in 2011. It offers over 400 built-in indicators and hundreds of scripts that can easily be added to charts. TradingView is available as a web-based platform, desktop software (Windows, macOS, and Linux), and mobile applications (Android and iOS). One of TradingView's standout strengths is its advanced customization capabilities. Users can fully configure charts, timeframes, and analytical tools according to their needs. Moreover, all customized settings can be saved for future trades. Note that the platform isn’t completely free; to utilize it fully, traders must purchase a plan, from Essential to Ultimate. However, the basic version is available free of charge. A feature that sets this platform apart is its proprietary programming language, Pine Script. This language lets Users design custom indicators, scripts, and trading bots. Furthermore, TradingView serves as a social network for traders. Users can share their trading ideas and participate in discussions about the market. One of the features available to TradingView subscribers is the ability to replay charts in smaller timeframes. The Bar Replay feature enables traders to cut historical data from a desired point in the preferred timeframe. It allows them to backtest past charts or trading strategies and assess their performance. Paper Trading is another key feature of TradingView. This section (which can be considered equivalent to a demo account in MetaTrader) allows traders to use fake money and familiarize themselves with market conditions. This platform also features advanced alerting capabilities. Alerts can be set based on specific market conditions, such as price crossing a certain level, indicator changes, or other analytical criteria. Users receive these alerts via email, SMS, or in-app notifications.
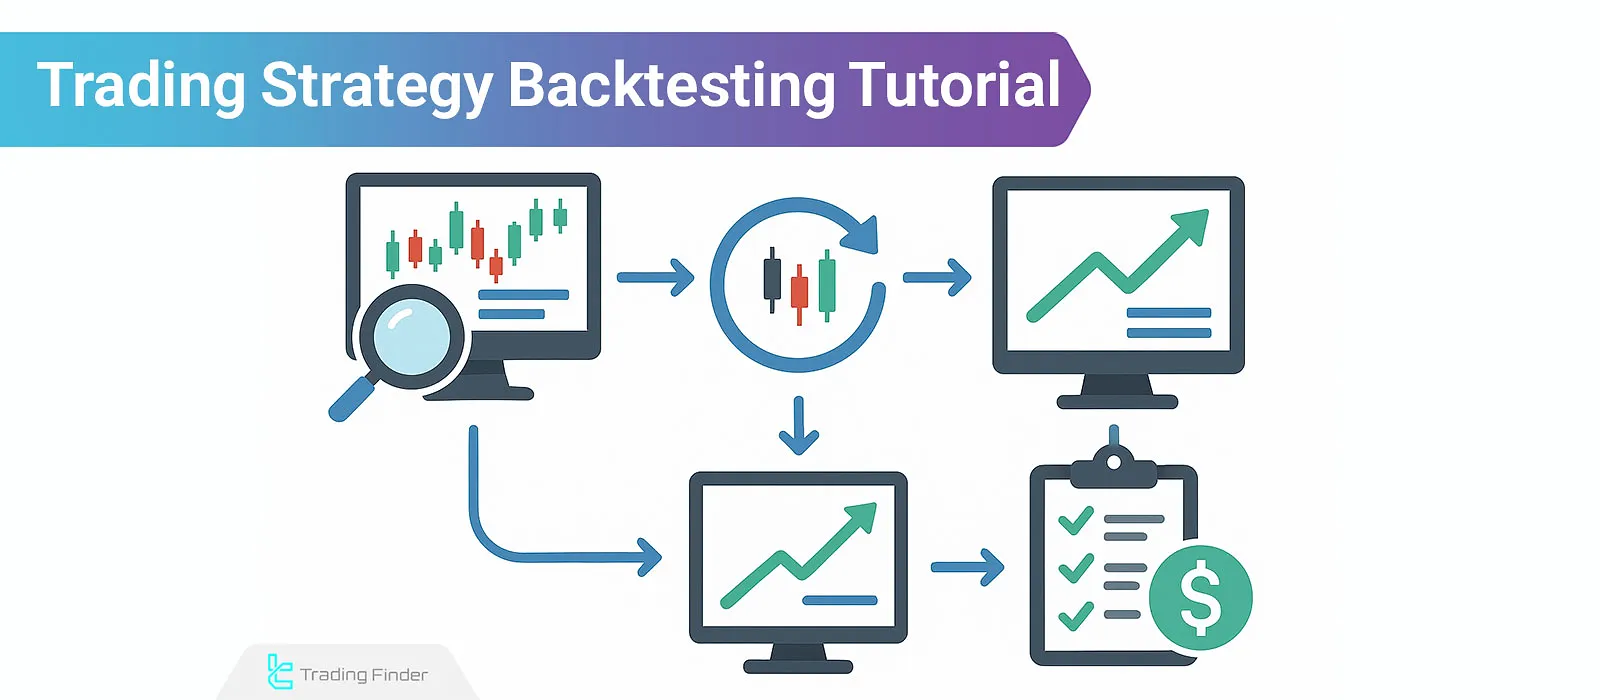
What is Back test? How to Backtest in 5 Steps
Operating in financial markets requires thorough analysis and the development of an effective trading strategy to achieve consistent...
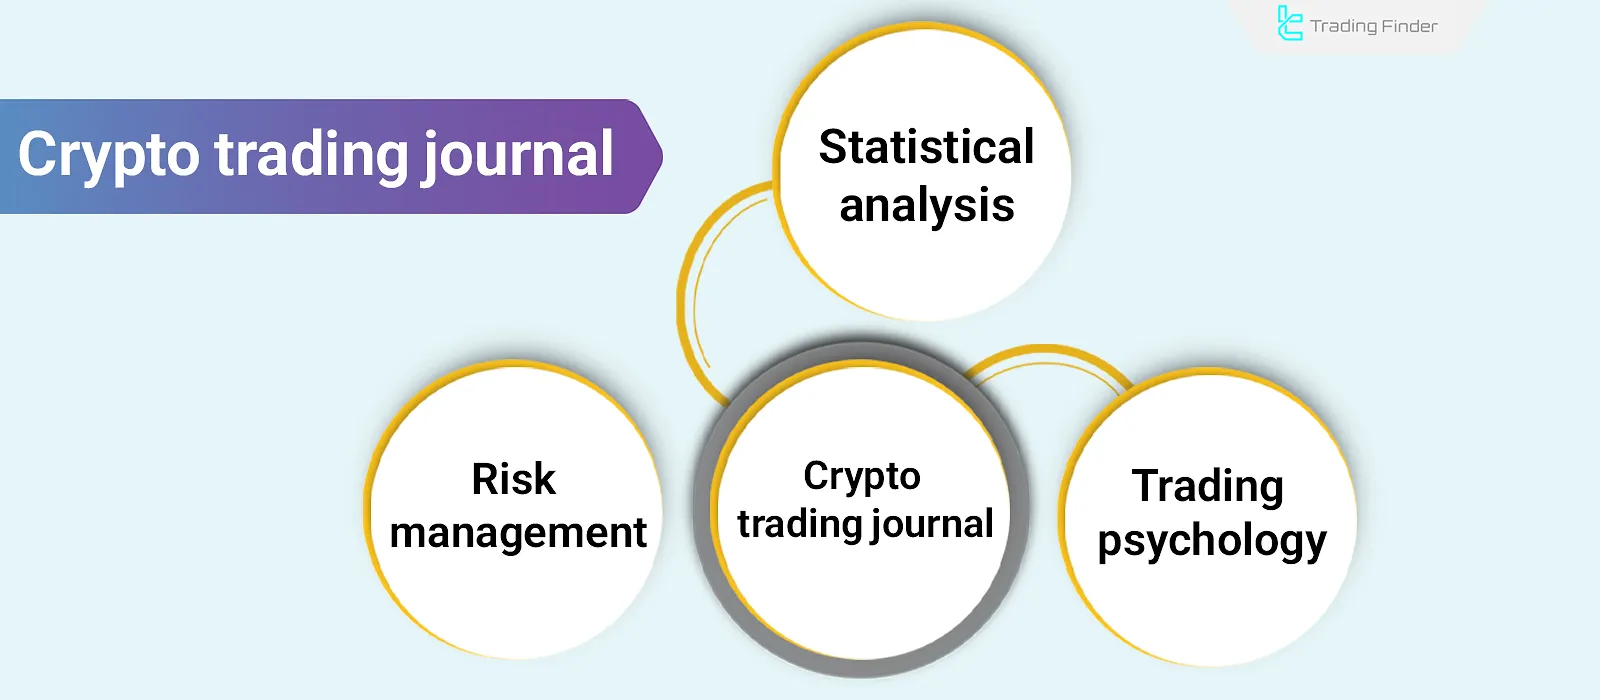
Crypto Trading Journal; Template & Best Tips
The cryptocurrency trading journal is an advanced, analytical tool that, by consistently recording quantitative and qualitative...
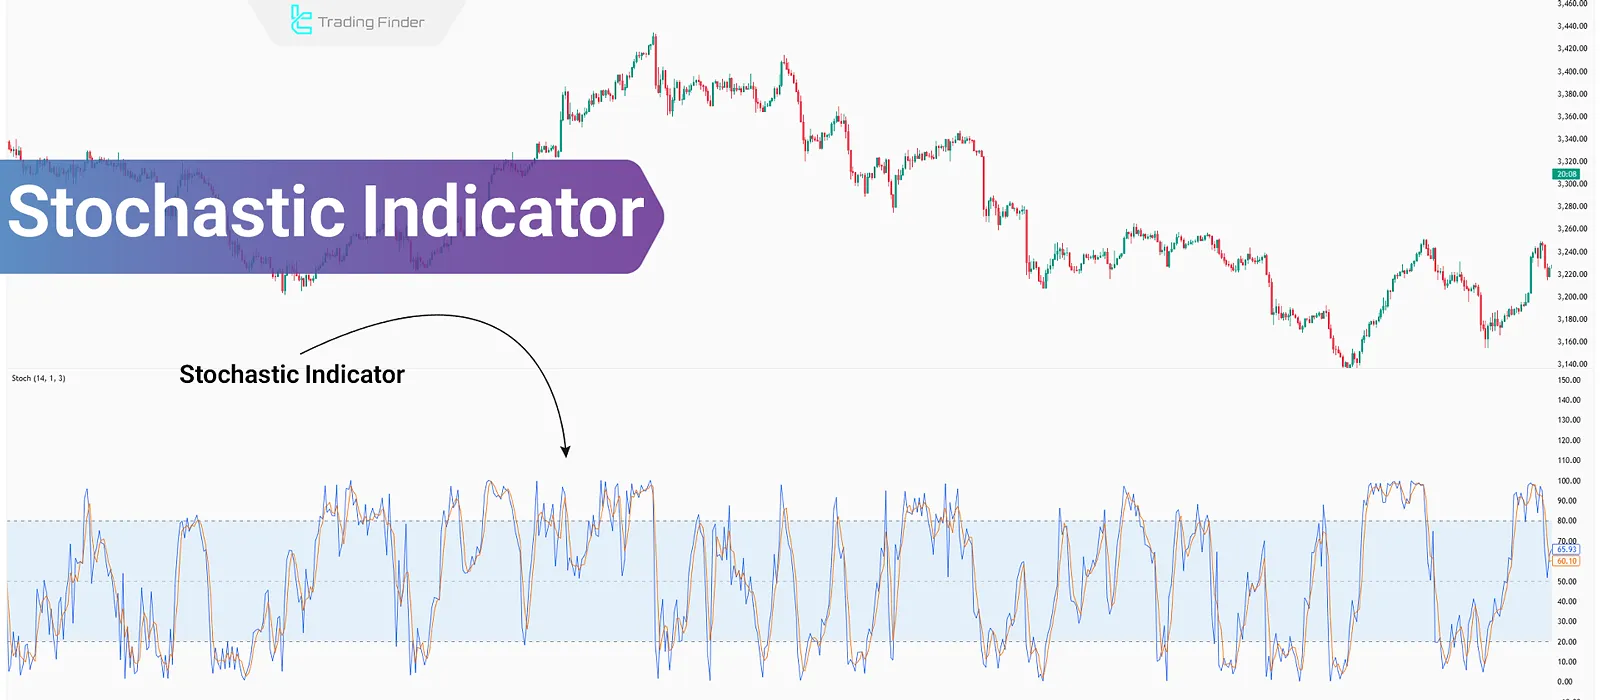
Stochastic Indicator – Stochastic Indicator Settings and Formula
The stochastic indicator analyzes price momentum by examining price movements over a specific time period. This stochastic oscillator...
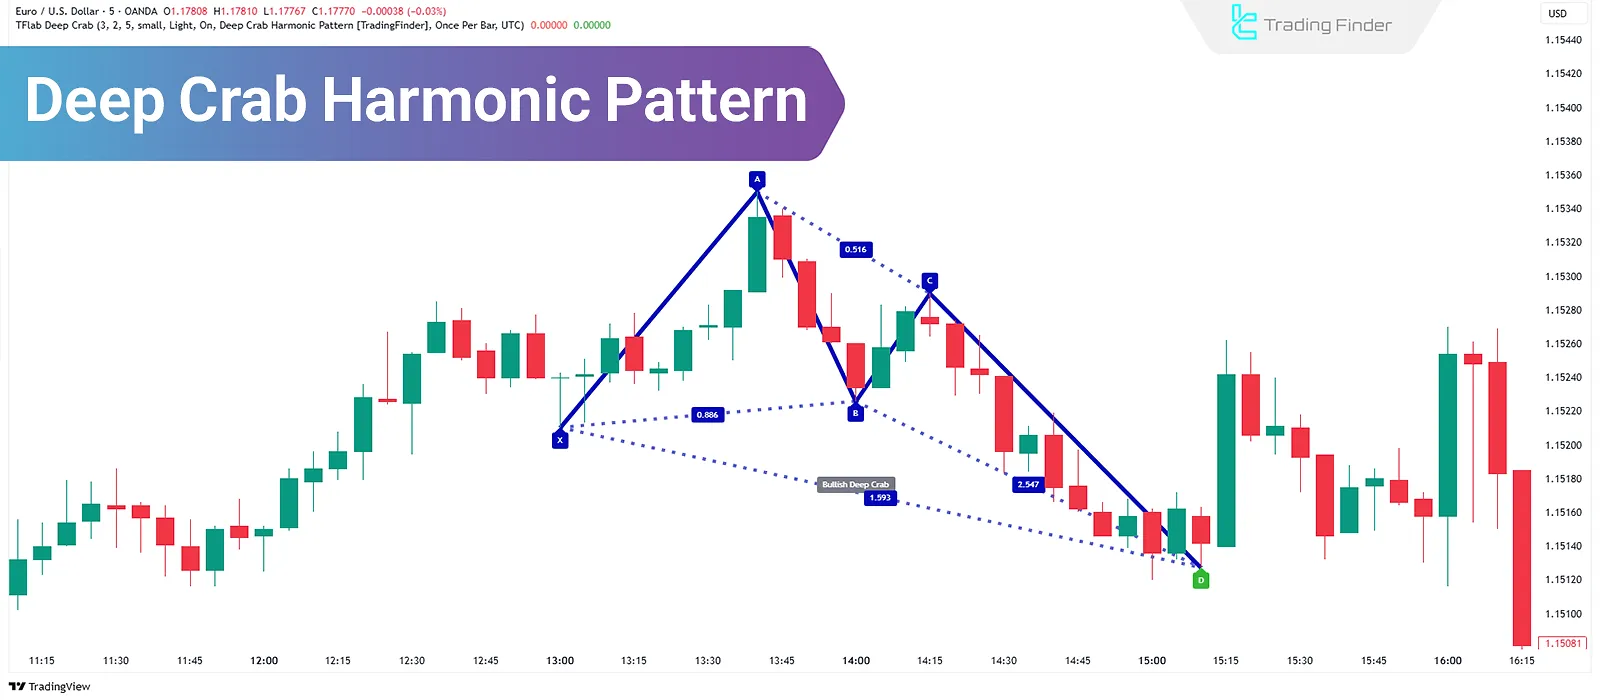
What is the Deep Crab Pattern? – Guide to Trading the Harmonic Deep Crab Pattern
Harmonic pattern traders use the Deep Crab Pattern to anticipate price reversals. By calculating and identifying points B, A, X,...
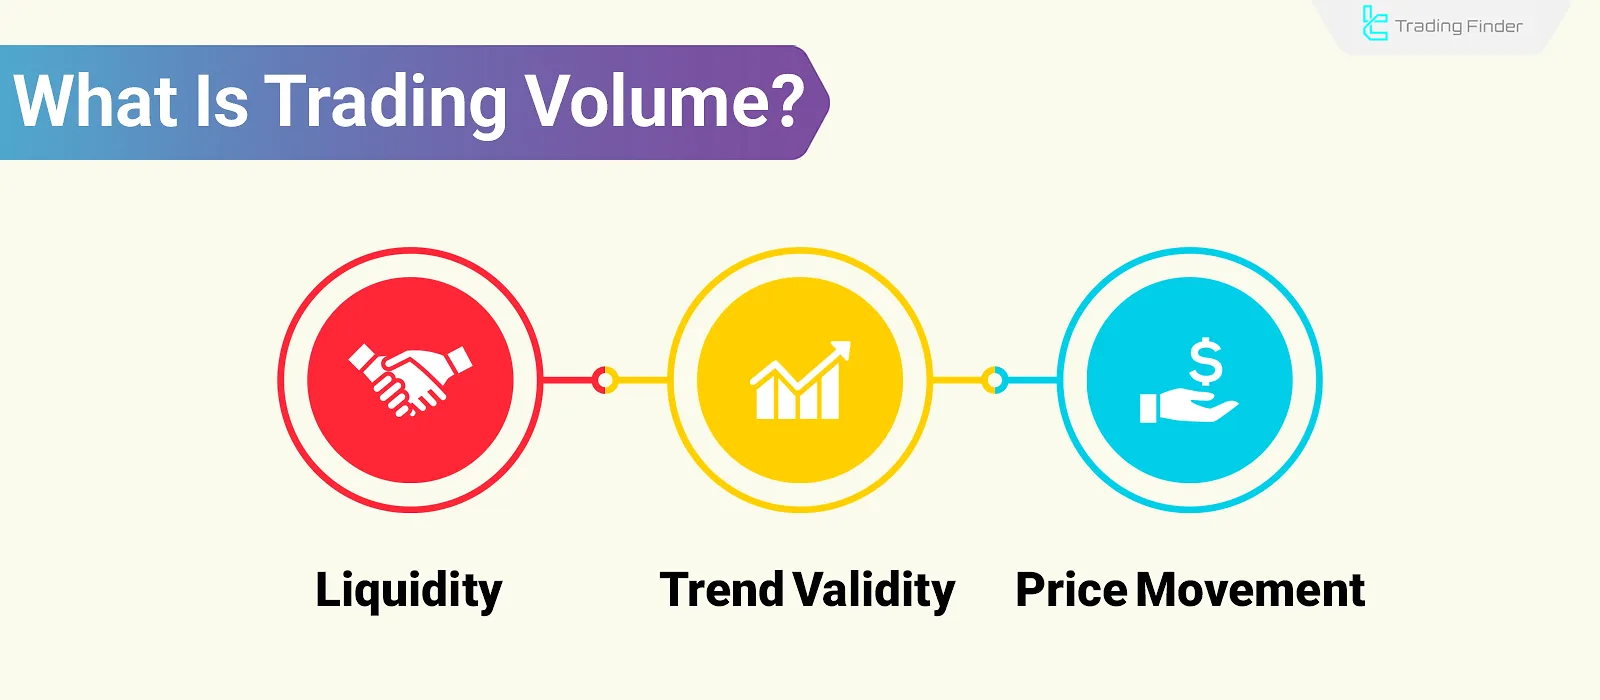
What Is Trading Volume? 9 Indicators for Market Volume Analysis
Trading volume in financial markets is considered a benchmark for assessing liquidity, price momentum, and the validity of ongoing...
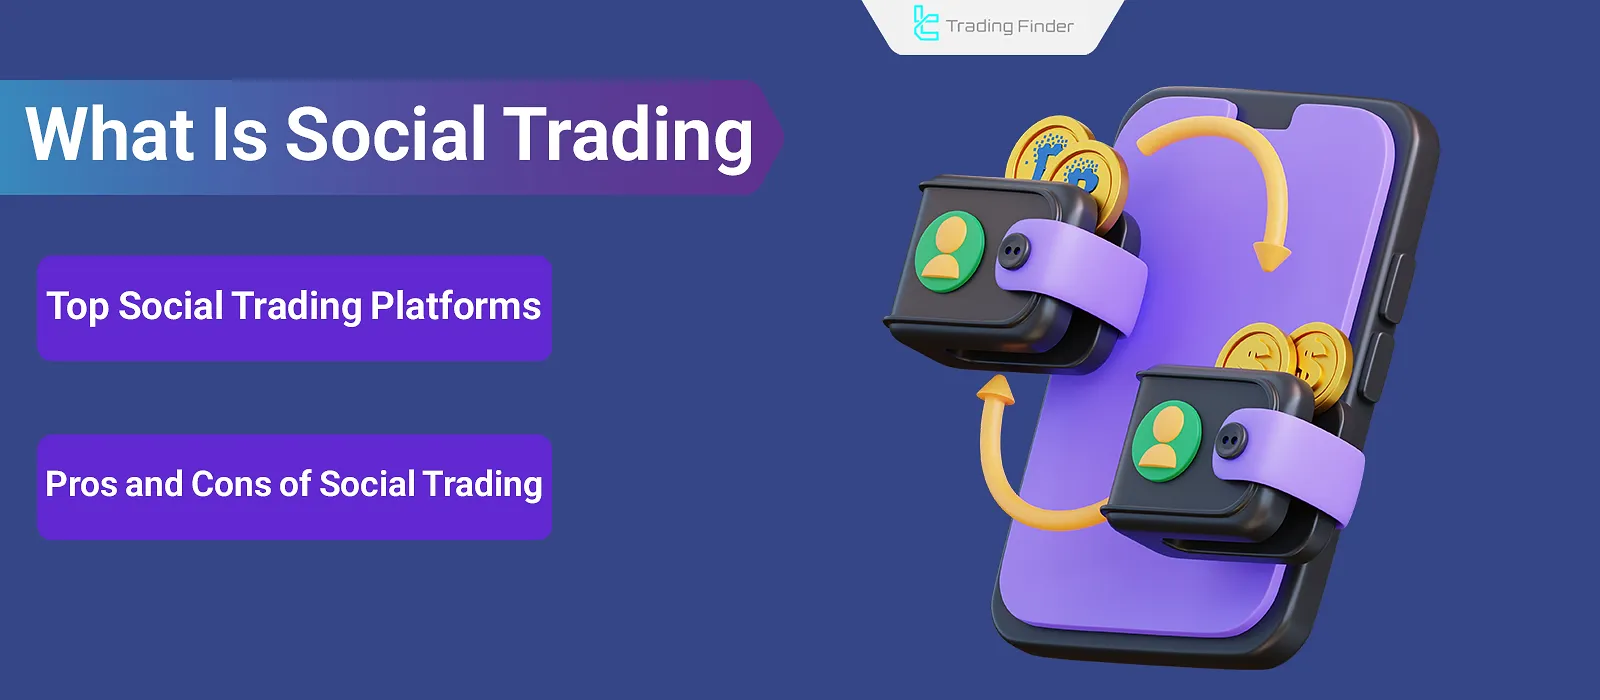
What Is Social Trading? Copy Trading, Mirror Trading, and Signal Trading
Social trading refers to leveraging the experience and skills of other individuals in your trading strategy. Onsocial trading...
![Complete TradingView Tutorial [Registration, Symbols, and Screener]](https://cdn.tradingfinder.com/image/230331/tradingview-tutorial-full-eng-01.webp)
Complete TradingView Tutorial [Registration, Symbols, and Screener]
TradingView Tutorial helps traders in various financial markets such as crypto, Forex, stocks, symbols, etc. to get familiar with...
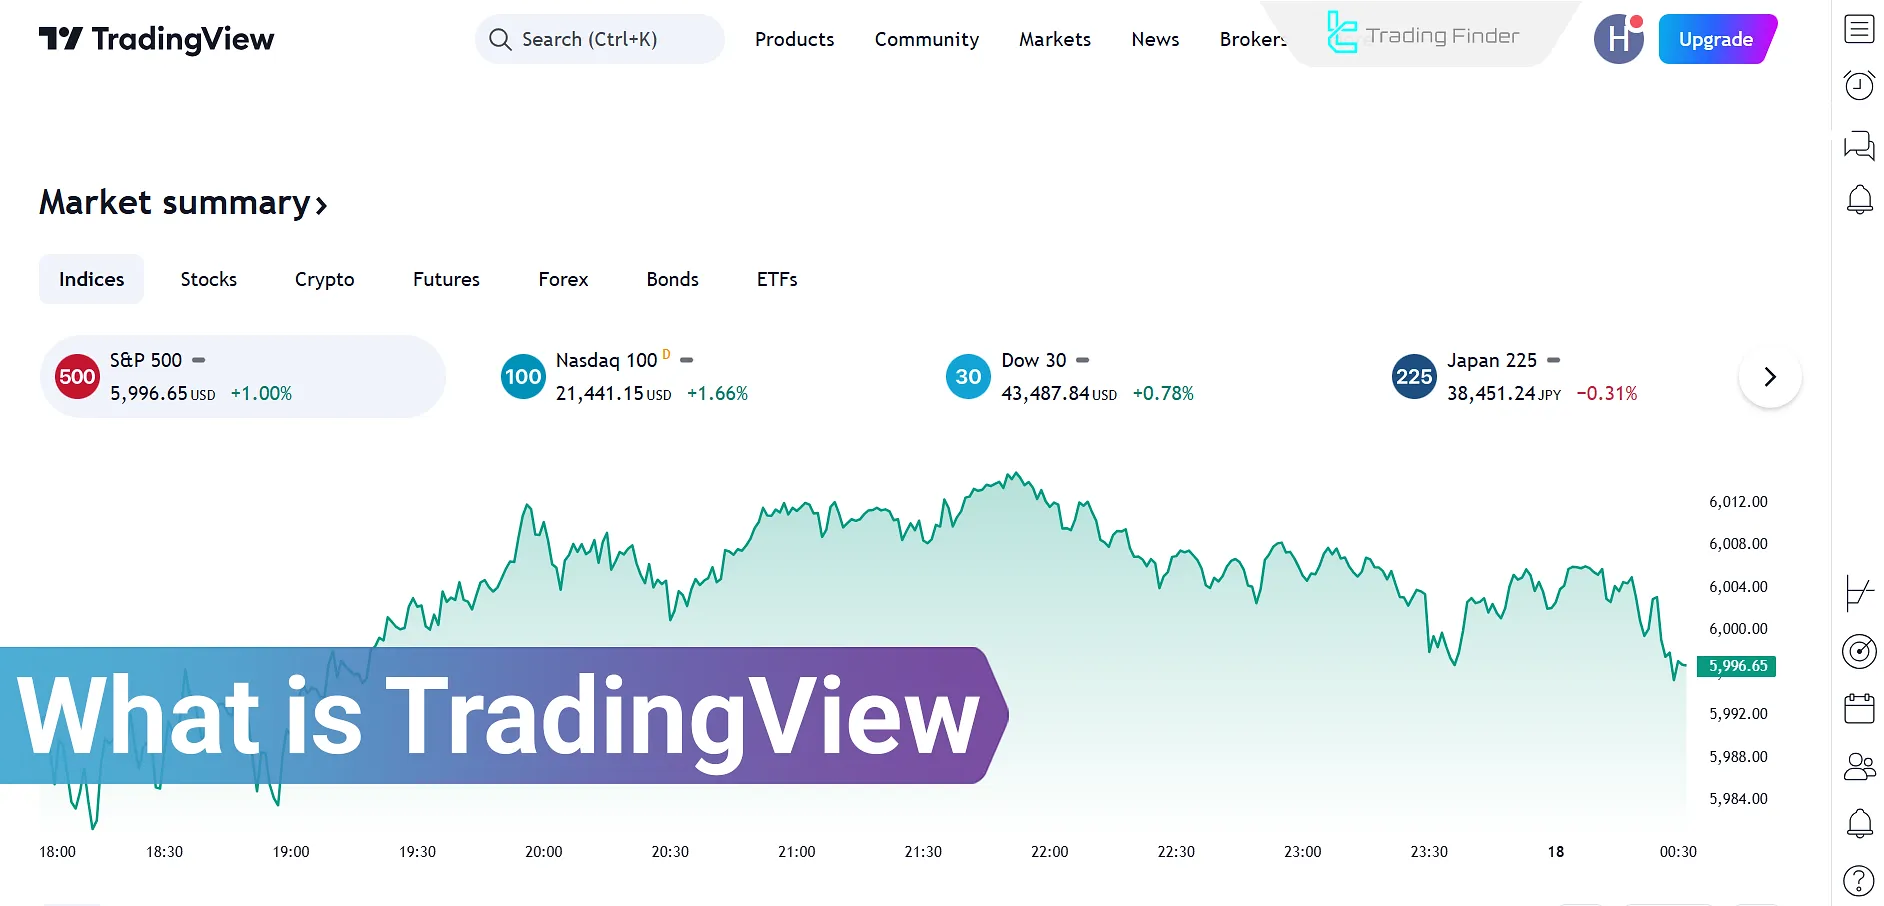
What is TradingView? Introducing the features and tools of the trading platform
TradingView is an advanced trading platform for charting and market analysis, used daily by over 50 million users...


