


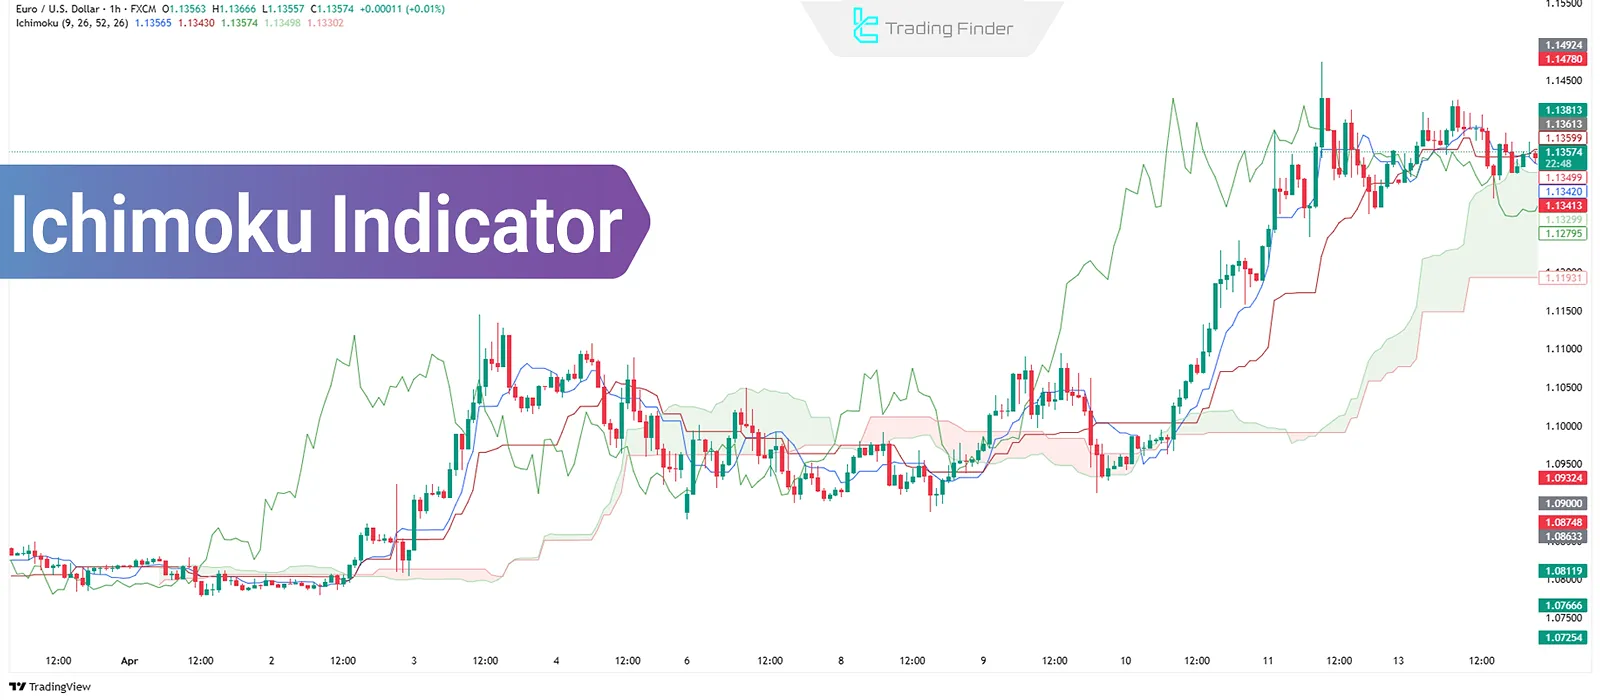
Ichimoku, as both an indicator and a complete trading system in technical analysis, simultaneously provides information about the trend, trend strength, support and resistance, and potential entry and exit points.
The indicator's multi-layered structure and unique formulation allow analysts to quickly assess the overall market condition.
Unlike many common tools based on simple price data, Ichimoku combines moving average lines with specific settings, time-shifted lines, and a visual structure called the "cloud". This structure tends to perform better in trending markets, such as the Forex market and cryptocurrencies, compared to less volatile environments.
What is Ichimoku?
Ichimoku is a technical analysis system that, by combining five key components [Tenkan-sen, Kijun-sen, Chikou Span, Senkou Span A, and Senkou Span B] offers a comprehensive view of market conditions. It simultaneously identifies trend direction, strength, dynamic support and resistance levels, and entry and exit points.
What makes Ichimoku unique is its use of time-shifted lines and the Kumo cloud structure, which allows traders to evaluate price movements effectively.
History of Ichimoku
Ichimoku was developed by Japanese journalist Goichi Hosoda in the 1930s and released to the public in the 1960s after more than 30 years of testing and refinement. His goal was to build a tool, capable of quickly showing market equilibrium and key decision points.
Its full name, Ichimoku Kinko Hyo, means "equilibrium chart at a glance". Initially used in the Japanese stock market, it gradually gained popularity in global markets, particularly in the Forex market.
Advantages and Disadvantages of Ichimoku
The table below presents the advantages and disadvantages of the Ichimoku indicator:
Advantages | Disadvantages |
Comprehensive and all-in-one analysis | Signal delay |
Applicable across all timeframes | Weak performance in ranging markets |
Detects market shifts before they occur | Lack of clear signals in choppy/sideways markets |
Provides buy and sell signals | – |
Components of Ichimoku
Ichimoku is made up of five main components, each representing a portion of information about the trend, market strength, and key price levels:
- Tenkan-sen (Conversion Line)
- Kijun-sen (Base Line)
- Chikou Span (Lagging Span)
- Senkou Span A (Leading Span A)
- Senkou Span B (Leading Span B)
Tenkan-sen
Tenkan-sen is one of the key components of the Ichimoku indicator, calculated as the average of the highest high and lowest low over the past nine candles. This line reflects the short-term trend direction and slope, and due to its high sensitivity to price movements, it usually reacts faster than the other lines.
Tenkan-sen, along with Kijun-sen, is used to generate cross signals. A change in its direction can indicate the start or weakening of a price movement. In non-trending conditions, this line often becomes horizontal and acts as a short-term support or resistance level.

Kijun-sen
Kijun-sen is another major line in Ichimoku, calculated as the average of the highest high and lowest low over the past 26 candles. This line represents the medium-term trend and the price equilibrium level.
Compared to Tenkan-sen, Kijun-sen reacts more slowly and is often used as a reference line to decide whether a trend is continuing or reversing.
When the price is above Kijun-sen, it indicates bullish pressure, and when it's below, it indicates bearish pressure. In combination with Tenkan-sen, it forms important cross signals and acts as dynamic support or resistance.

Chikou Span
Chikou Span is a line that plots the closing price of the current candle shifted 26 periods backward on the chart. This line compares today's price with the past to help traders better identify trend strength and direction.
When Chikou Span is above the price, it signals a stronger bullish trend, and when below, it indicates a bearish trend. If Chikou Span intersects with past candles, it may suggest trend weakness or a possible reversal. While it doesn't provide standalone signals, it plays an important confirmatory role when used with other Ichimoku components.

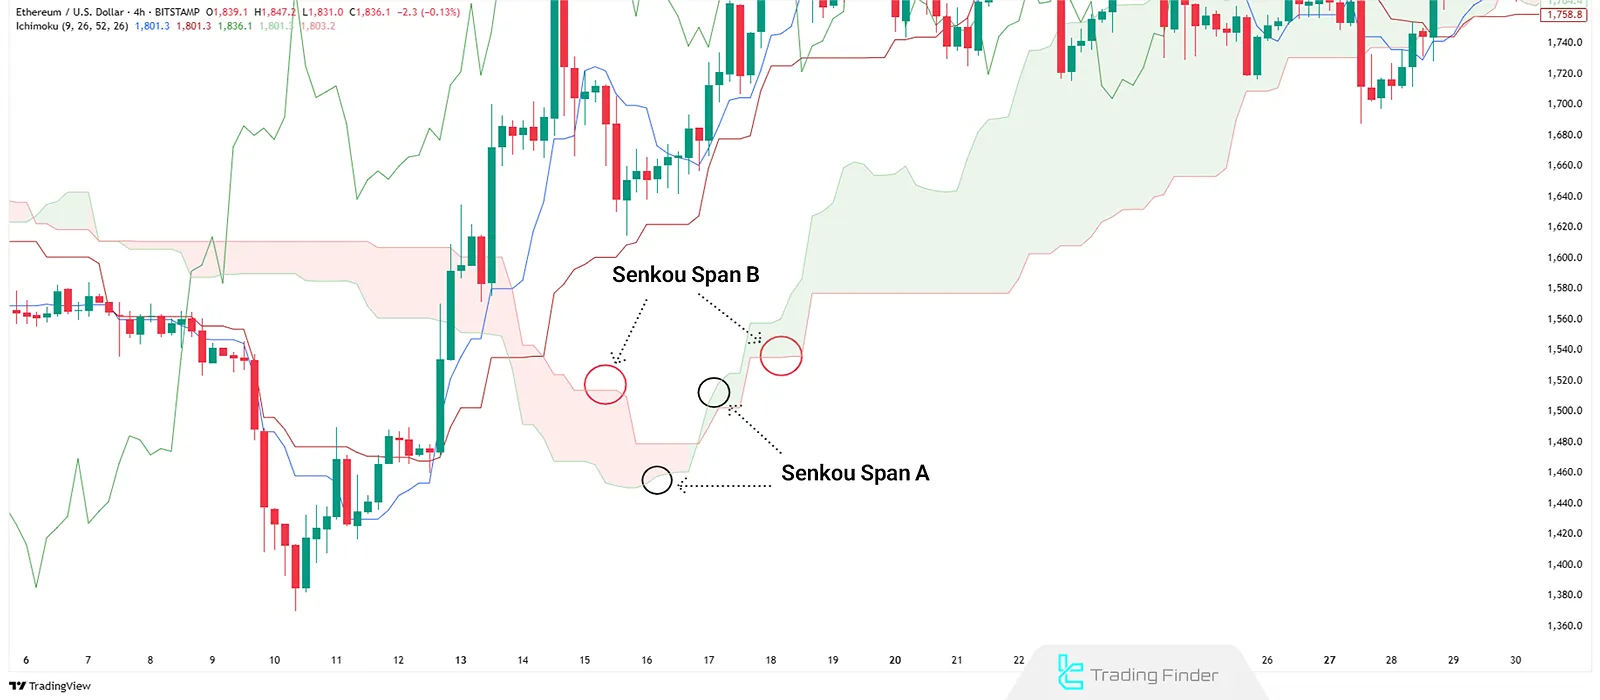
Senkou Span A (Leading Span A)
Senkou Span A is one of the two lines that form the Kumo cloud in the Ichimoku indicator. It is calculated as the average of Tenkan-sen and Kijun-sen, and the result is shifted 26 periods ahead into the future. Together with Senkou Span B, it forms the structure of the Ichimoku cloud.
In an uptrend, Senkou Span A typically forms the upper boundary of the cloud, while in a downtrend, it forms the lower boundary. This line is crucial for forecasting market direction and identifying dynamic support and resistance levels. The slope and position of this line relative to Senkou Span B indicate the strength or weakness of the existing trend.
Senkou Span B (Leading Span B)
Senkou Span B, the second line forming the Kumo cloud, is calculated as the average of the highest high and lowest low over the past 52 candles. Like Span A, it is also shifted 26 periods forward to form the cloud structure along with Senkou Span A.
Senkou Span B is slower and more stable than Span A and often serves as a strong support or resistance level in strong trends. When Senkou Span B is flat and horizontal, it signals a ranging market and represents
a significant price level that tends to influence price reactions. The space between Span A and B defines the cloud area, which is one of the most important analytical components of Ichimoku.
What is the Kumo Cloud in Ichimoku?
The Kumo cloud is the area between Senkou Span A and B; both shifted 26 candles forward. This zone plays a key role in identifying the market structure and trend status.
When Senkou Span A is above Span B, the cloud is usually green or blue, indicating a bullish trend. When Span B is above Span A, the cloud is red or orange, indicating a bearish trend.

Price Behavior Relative to the Kumo Cloud
Price interacts with the Kumo cloud in several ways:
- Above the cloud: Indicates a bullish trend with the cloud acting as a dynamic support;
- Below the cloud: Indicates a bearish trend, with the cloud acting as a dynamic resistance;
- Inside the cloud: Suggests a neutral or ranging market.
Cloud Thickness and Support/Resistance Strength
A thicker cloud usually suggests greater trend stability and stronger support/resistance. In contrast, a thin cloud may indicate a higher chance of price breakout and trend reversal. The ease or difficulty with which the price passes through the cloud often depends on its thickness.
Types of Ichimoku Strategies in Technical Analysis
To utilize Ichimoku in technical analysis and trading, various methods can be applied. The most common approaches for using Ichimoku signals include:
- Crossover Signals
- Kumo Breakout Signals
- Chikou Span Signals
Crossover Signals
Crossover signals in Ichimoku refer to rapid market trend shifts that usually occur when different Ichimoku lines intersect. These signals can be used to identify suitable entry or exit points in the market.
Tenkan-sen and Kijun-sen Cross
When Tenkan-sen crosses Kijun-sen from below, it indicates a shift from a bearish to a bullish trend and is considered a buy signal. Conversely, when Tenkan-sen crosses Kijun-sen from above, it indicates a potential trend reversal from bullish to bearish, acting as a sell signal.

Chikou Span and Price Cross
Ichimoku Chikou Span signals occur when the Chikou line crosses the price. If Chikou Span crosses the price from below to above, it confirms a bullish trend and suggests a buying opportunity. If it crosses from above to below, it signals the start of a bearish trend and acts as a sell signal.

Kumo Breakout Signals
The Kumo cloud, formed by Senkou Span A and Senkou Span B, represents dynamic support and resistance levels. A breakout through these lines can indicate new trend formations.
Bullish Kumo Breakout
This signal occurs when the price breaks above the cloud. It indicates a trend reversal from bearish to bullish and is considered a buy signal. When the price stays above the cloud, it shows the start and continuation of an uptrend. In this case, the cloud acts as strong support, pushing the price higher.

Bearish Kumo Breakout
This occurs when the price breaks below the cloud, indicating a shift from a bullish to a bearish trend, and is treated as a sell signal. When the price moves below the cloud, it confirms weakness in the uptrend and the beginning of a downtrend. The cloud now acts as resistance.

Chikou Span Signals
The Chikou Span in Ichimoku is used to confirm the trend and identify potential trend reversals.
Chikou Span Trend Confirmation
When Chikou Span is above the price, it confirms a bullish trend and suggests upward momentum. If it is below the price, it confirms a bearish trend and signals downward movement.

Chikou Span Trend Reversal
If Chikou Span crosses the price from below to above, it indicates a potential reversal from bearish to bullish. If it crosses from above to below, it suggests a reversal from bullish to bearish.
Bermuda in Ichimoku
When a small cloud forms on the chart that has not yet been touched by any candles, this phenomenon is known as "Bermuda." This area tends to attract price and can be considered a significant price target. It is applicable and analyzable in all timeframes.

Advanced Tips in Ichimoku
Applying the following tips can increase the likelihood of success when trading with the Ichimoku indicator:
Multi-Timeframe Analysis
Ichimoku allows traders to analyze the market across multiple timeframes. Identify major trends on higher timeframes, then use more precise signals on lower timeframes for trade entries.
Ichimoku + Price Action Overlap
One advanced technique is combining Ichimoku with price action. Price action patterns can confirm or reject Ichimoku signals. For instance, if Ichimoku gives a buy signal and it aligns with a reversal candlestick or head and shoulders pattern, the signal gains more reliability.

Conclusion
Ichimoku is a complete technical analysis system that combines five core components such as Tenkan-sen, Kijun-sen, Chikou Span, Senkou Span A, and Senkou Span B, to give traders a detailed view of market conditions and entry/exit opportunities.
It simultaneously analyzes the overall market using moving averages and the Kumo cloud structure.
Ichimoku performs especially well in trending markets like the Forex market and cryptocurrencies, as its signals are more reliable in strong trends. Through multi-layered analysis, it simulates market behavior and helps forecast price movements.


