


Price Action analyzes price movement without the use of indicators. It focuses on raw price behavior to provide a clear, unfiltered market view.
What is Price Action?
Price action refers to the movement of an asset's price over time. In this approach, traders make decisions based on trend analysis, key levels, chart patterns, and candlestick formations.
The goal of Price Action is to understand market behavior without relying on indicators such as moving averages or oscillators.
Understanding market structure through price action allows traders to analyze the logic and patterns behind price movements. This analytical style can be applied across all markets—including Forex Market, stocks, commodities, and crypto; It’s also usable in any timeframe.
Key Concepts in Price Action Strategy
Common concepts in price action include:
- Support and resistance
- Trends
- Trendlines and price channels
- Candlestick patterns
- Chart patterns
- Breakouts
- Reversals and retracements
- Volume and volatility
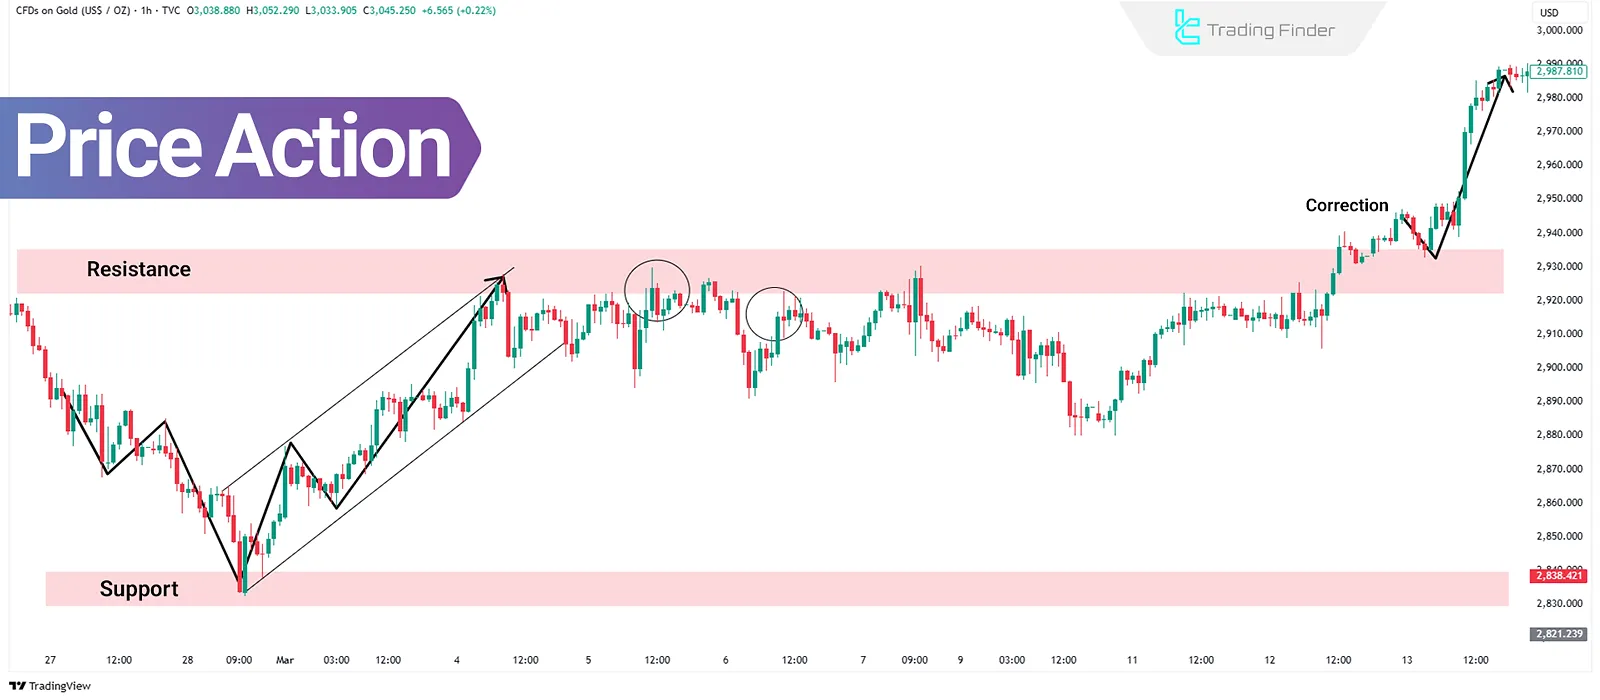
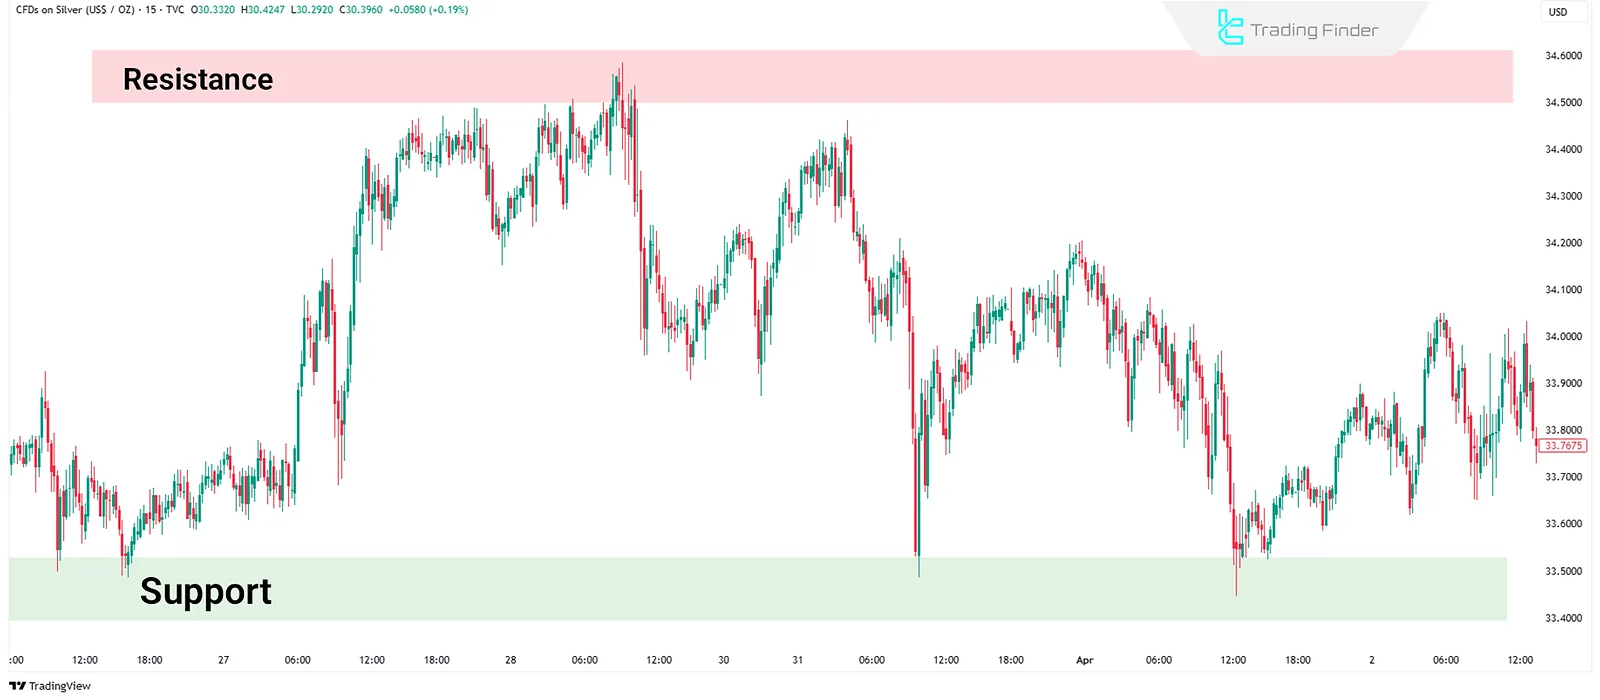
Support and Resistance
Support and resistance are foundational in price action. Support is a level where buying pressure increases and prevents further price decline.
Conversely, resistance is where selling pressure rises, blocking further price increases. A breakout or reversal at these levels may signal continuation or a trend change.
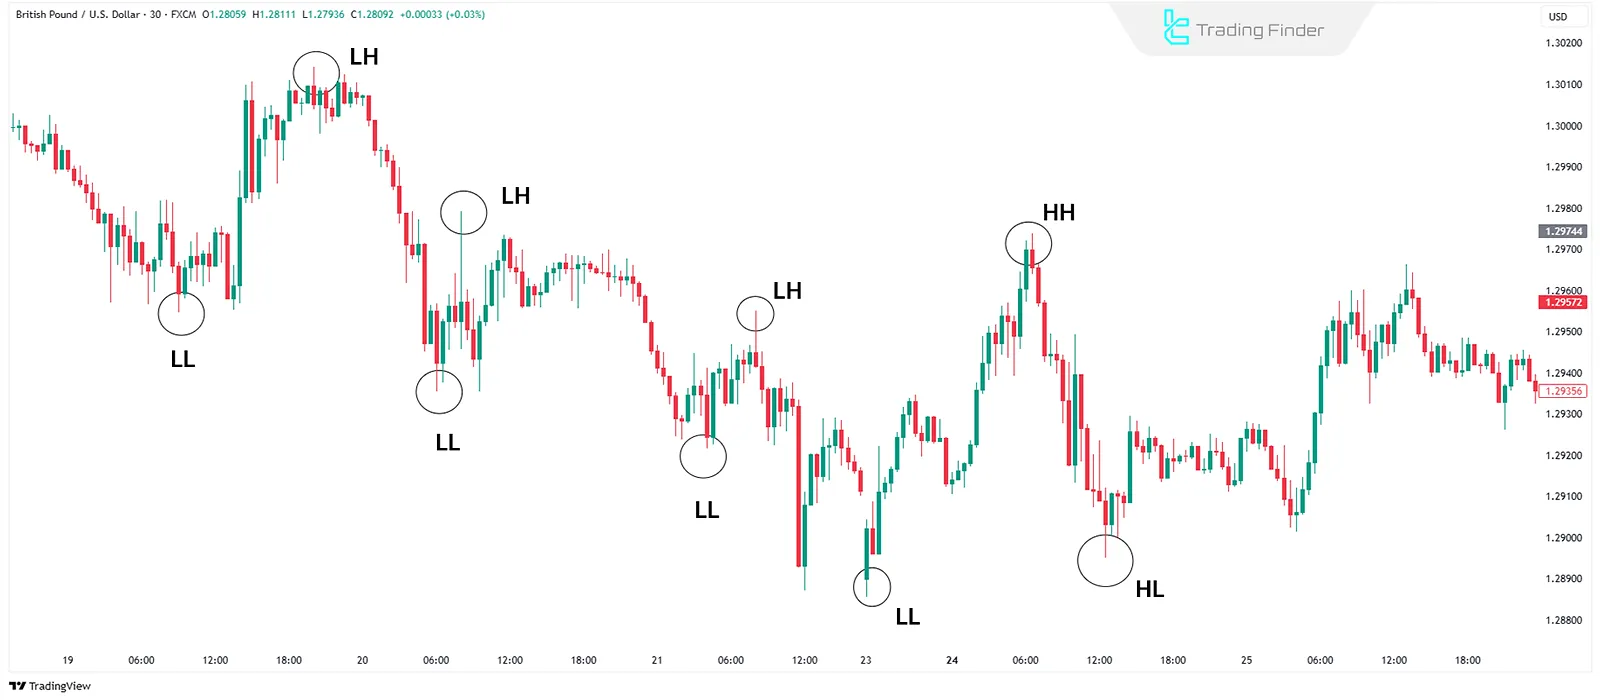
Trends
Recognizing trends helps traders align with the market direction. In an uptrend, prices make higher highs and higher lows. In a downtrend, they form lower highs and lower lows. Identifying swing highs and swing lows is essential for trend detection.
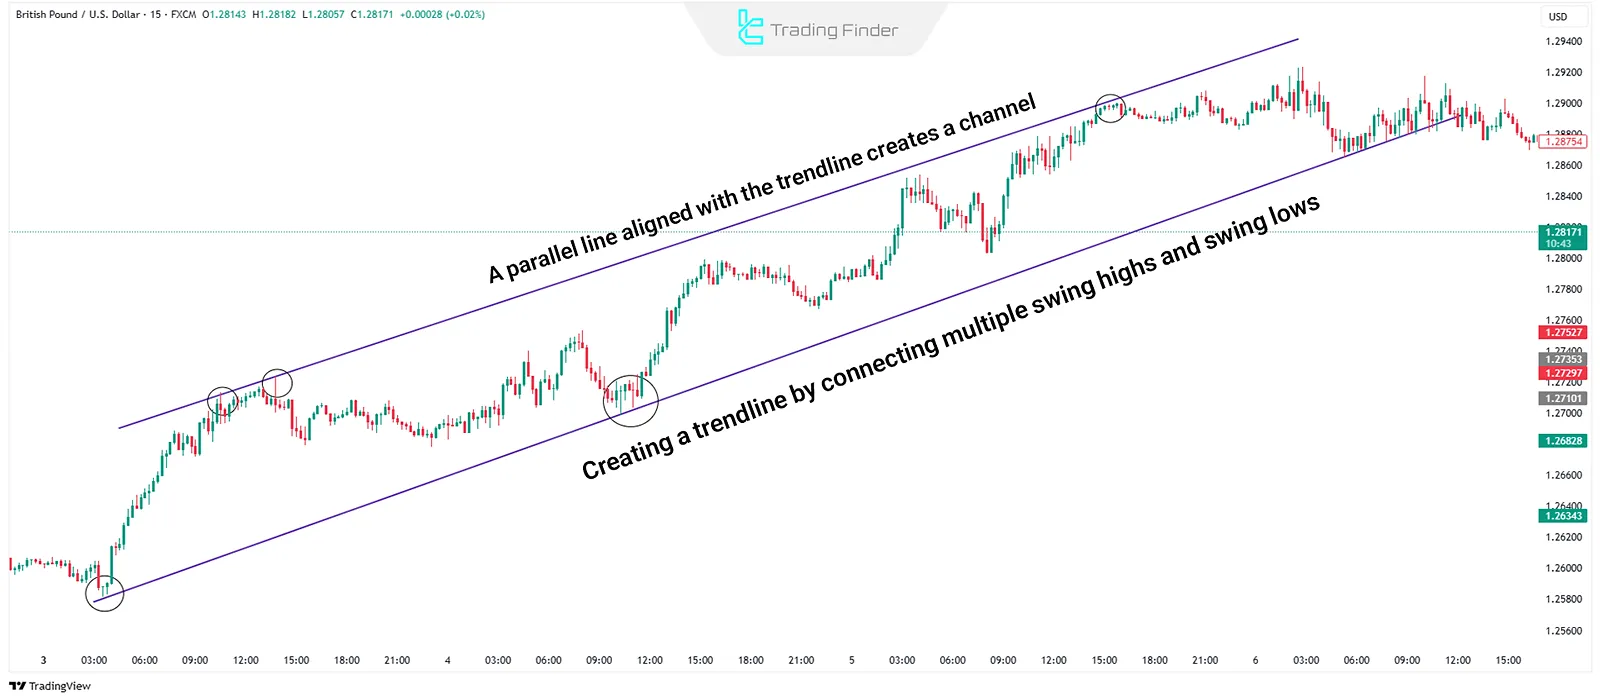
Trendlines and Price Channels
A trendline connects multiple swing highs or lows to show overall market direction. When two parallel lines are drawn around price movement, a price channel is formed. Traders use these to find buy/sell zones and analyze breakouts.
Candlestick Patterns
Candlesticks provide insight into market sentiment. Common candlestick patterns in price action:
- Pin bar, hammer, shooting star: Candles with long wicks and small bodies, signaling rejection from price levels;
- Engulfing pattern: A candle fully engulfs the previous one, indicating a shift in buying/selling pressure;
- Doji: A candle with a small body reflecting market indecision.
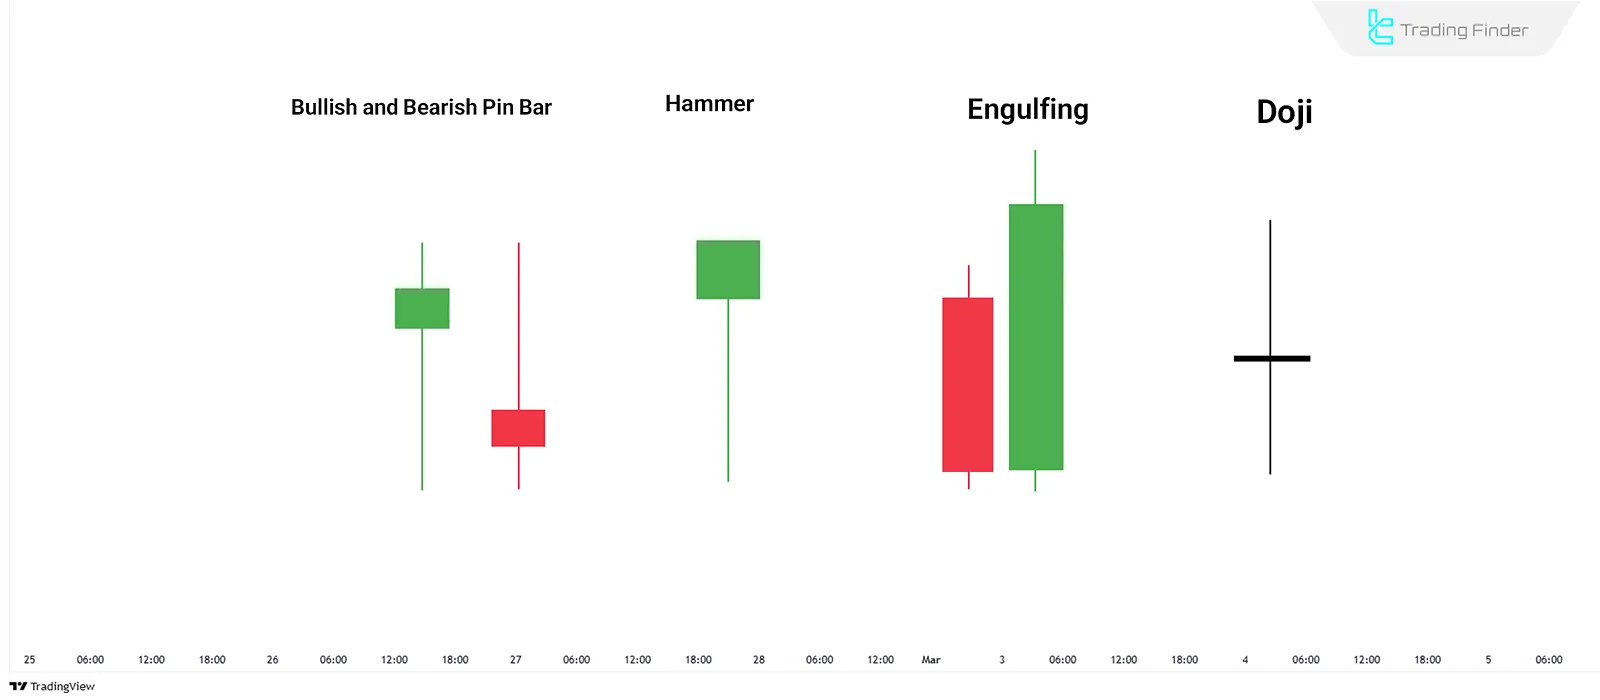
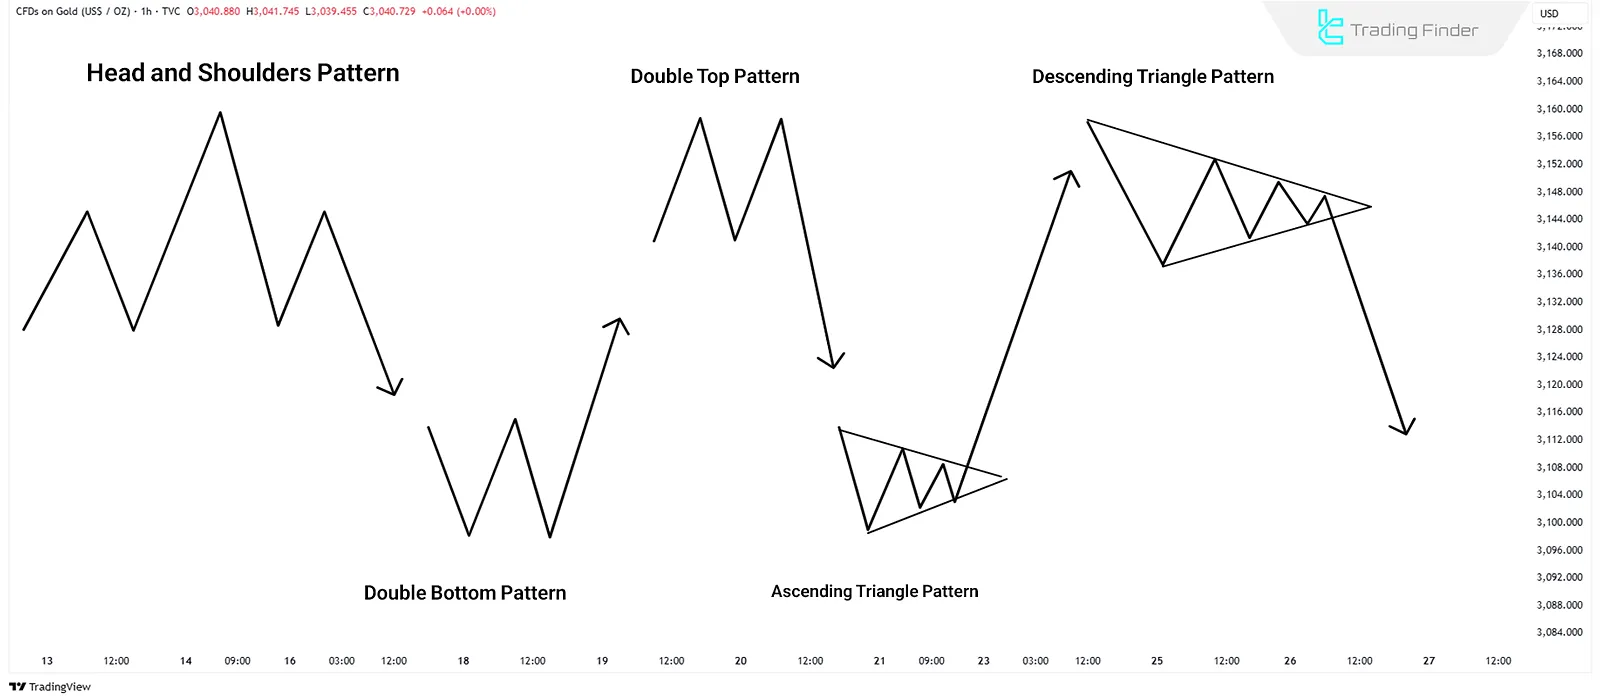
Chart Patterns
Common and practical chart patterns in price action include:
- Head and Shoulders: A reversal pattern signaling a shift from an uptrend to a downtrend or vice versa;
- Double Top/Bottom: Indicates a potential trend reversal when broken;
- Triangles (ascending, descending, symmetrical): Represent consolidation before a breakout.
Breakouts
A breakout occurs when the price moves beyond a key level or pattern. Breakouts with high volume typically indicate strong market momentum in that direction.
Reversals and Retracements
A reversal signals a complete change in market direction (e.g., from uptrend to downtrend), while a retracement is a temporary move against the prevailing trend. Fibonacci tools are commonly used to identify likely retracement levels.
Note: You can use the Fibonacci calculator tool from TradingFinder for accurate level calculation.
Volume and Volatility
Volume validates the strength of price movement. Volatility impacts the reliability and intensity of patterns. For instance, a high volume and volatility breakout is often more credible.
How to Use Price Action
Steps to use price action effectively:
- Use a clean chart without indicators; only candlesticks or price bars should be visible;
- Identify the market structure and determine whether the market is trending or ranging based on swing highs/lows;
- Detect recurring patterns and reaction zones such as support and resistance;
- Analyze how price behaves around these key levels to detect trend continuation or reversal signals;
- Confirm with volume and volatility for stronger signal
Designing a Price Action Trading Strategy
Follow these five steps to create a price action strategy:
- Choose one or more candlestick or chart patterns (e.g., pin bar at support/resistance zones);
- Select an appropriate trading timeframe;
- Ensure alignment of the pattern with the overall market direction;
- Define entry point, stop loss, and take profit in advance;
- Backtest the strategy using historical
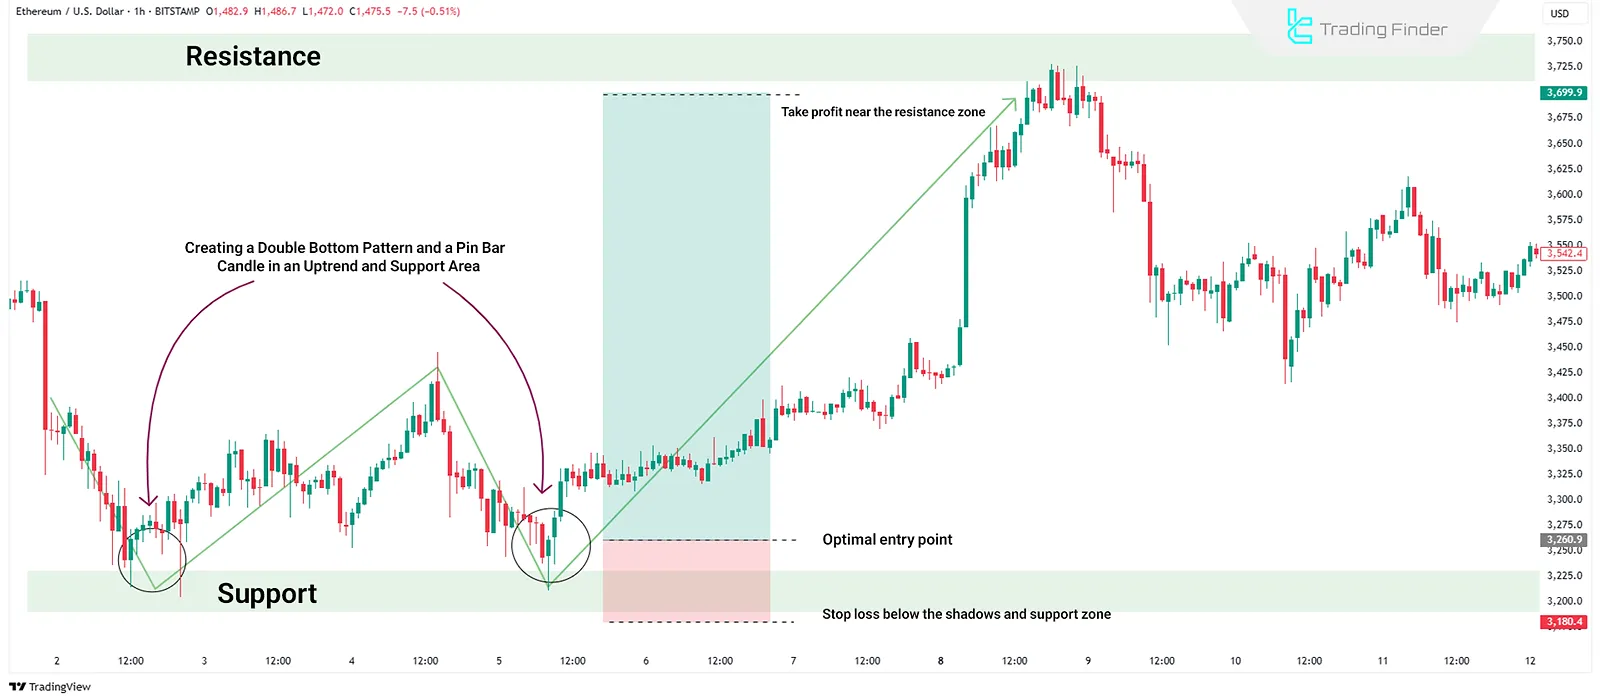
Example Trade Using Price Action
In the scenario where a bullish pin bar forms at a support level within an uptrend, an entry is made after the candle closes.
The stop loss is placed just below the candle’s wick, and the take profit is set near the next resistance level.
Risk Management
Risk management is essential in all technical strategies. Risk Management in Price Action:
- Stop losses are generally placed outside pattern boundaries;
- A risk/reward ratio of at least 1:2 is recommended;
- Position size should align with account size and acceptable risk level.
Conclusion
Price action is a market analysis method focused on raw price behavior and recurring patterns. One of its key advantages is eliminating lag from indicators.
With price action, traders can identify trends, locate support/resistance zones, and utilize patterns like pin bars, head and shoulders, and triangles to determine entries and exits.


