


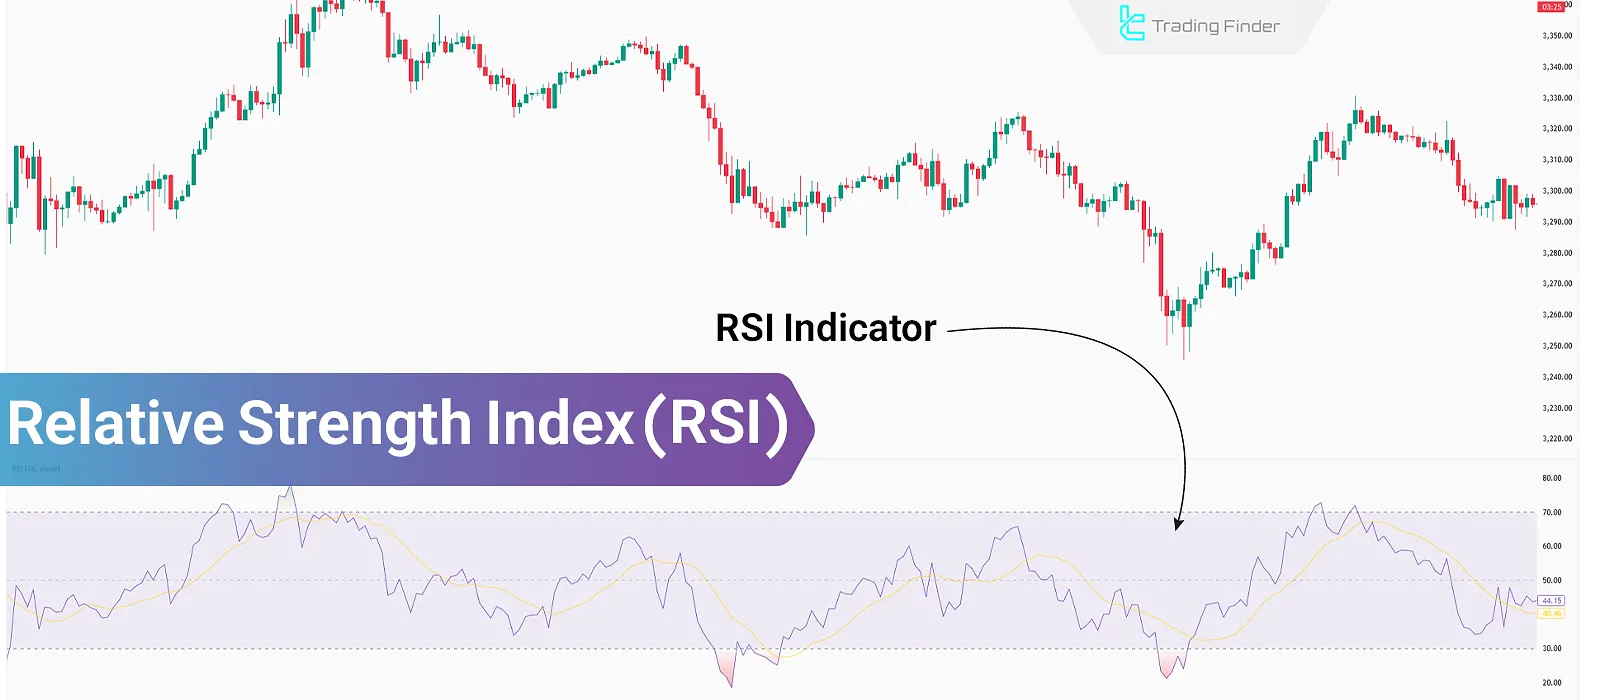
The Relative Strength Index (RSI) evaluates the strength of a trend by analyzing the open and close prices of candles over different timeframes (14 days by default). Therefore, this indicator is used in most trading strategies, including divergence, trendlines, and more.
This indicator consists of five components including RSI line, moving average, level 50, level 70, and level 30. By analyzing the movement of these elements, it becomes possible to identify divergence, overbought and oversold zones, support and resistance, and more.
What Is RSI?
RSI is an oscillator used to evaluate the strength of a price movement. This indicator identifies overbought or oversold zones by analyzing historical market factors such as momentum.
RSI moves between 0 and 100. Therefore, when it rises above the 70 level, it indicates overbought conditions, and when it drops below 30, it signals oversold conditions.
In the RSI tutorial article on the Investopedia website, the different components of this indicator are explained in full.
Components of the Relative Strength Index
The relative strength index consists of five main components, and the interaction between these elementsو plays an essential role in analyzing momentum and price trends.
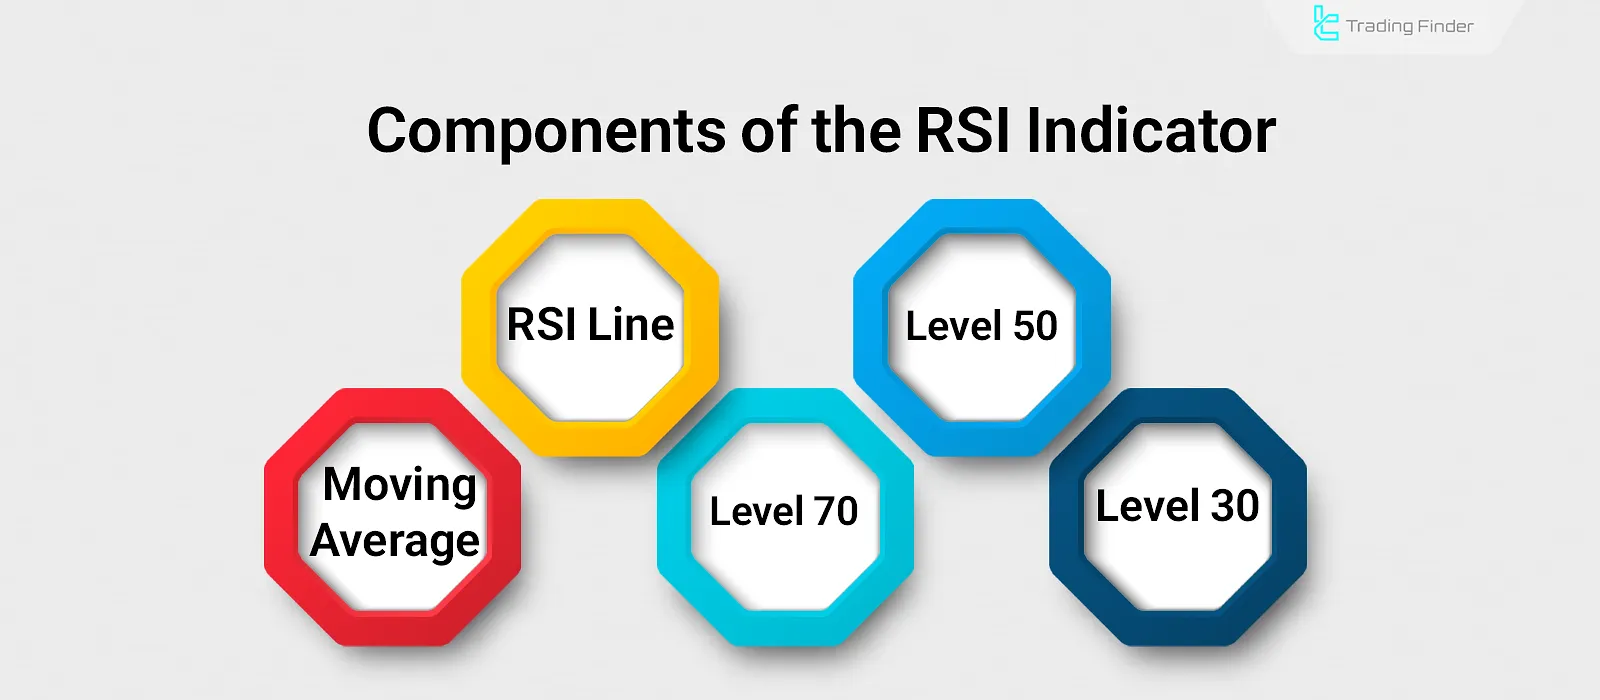
Components of the Relative Strength Key components of the RSI indicator include RSI line and moving average Index:
- RSI Line: The main element of the RSI indicator, calculated using a specific formula to reflect the relative strength of price;
- RSI Moving Average: This line represents a moving average of the RSI line. Its intersection with the RSI line may generate a trend reversal signal;
- Level 70: Defines the upper area of the RSI display; when the RSI line crosses above this level, it indicates overbought conditions;
- Level 50: Divides the indicator display into two halves; reaching this level signifies a potential support or resistance area;
- Level 30: Represents the oversold zone; when the RSI line enters this region, it signals an early indication of potential price reversal.
Advantages and Disadvantages of RSI
Using the RSI indicator is straightforward due to the clarity of its signals. However, relying solely on this indicator may not yield a high success rate in trading.
Therefore, to enhance effectiveness, it should be combined with other technical analysis concepts.
Advantages | Disadvantages |
High clarity of signals | Delay in signal generation |
Easy to use | Possibility of false signals |
High compatibility with other tools | Requires combination with other analysis methods |
Usable in all financial markets | Weak performance in ranging markets |
How to Calculate the RSI Indicator?
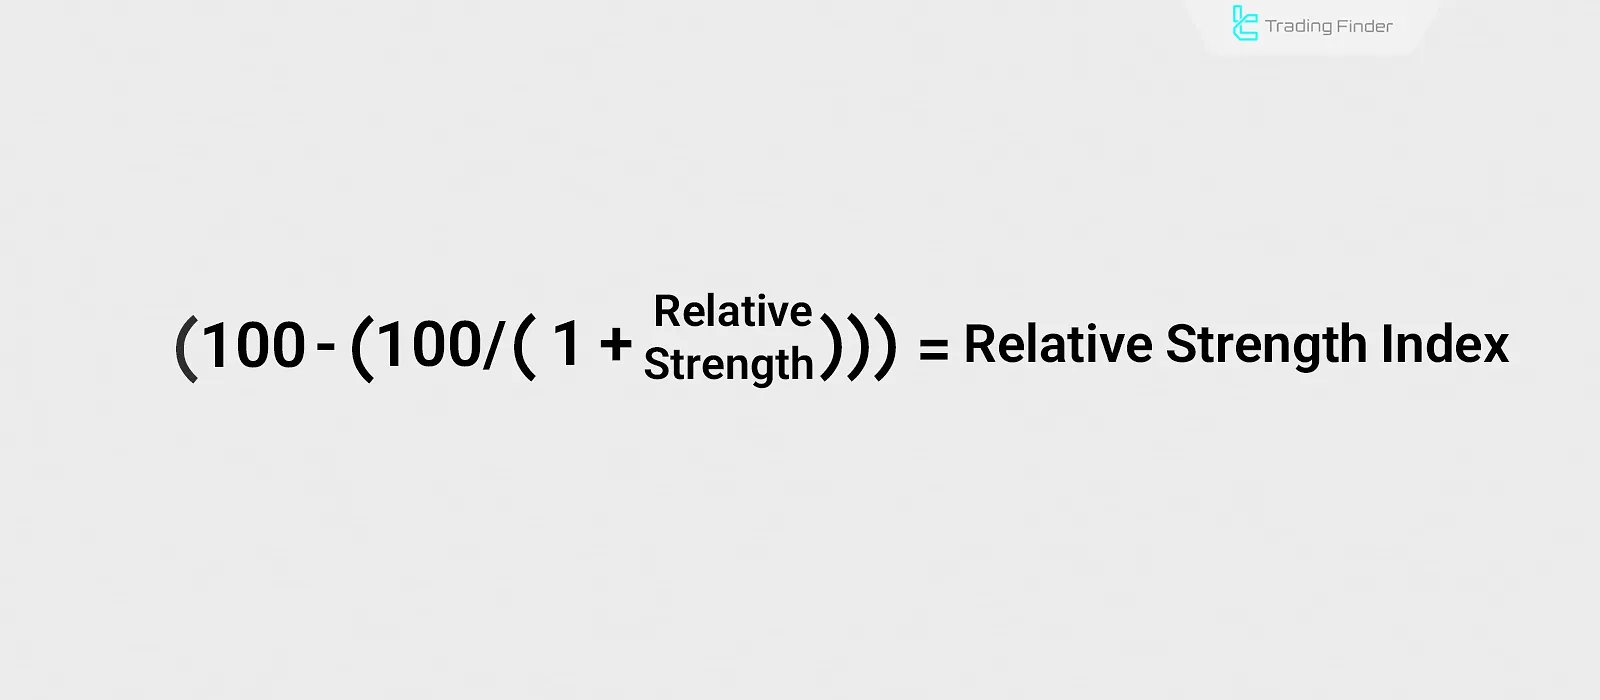
The RSI indicator is calculated using two formulas. The first formula computes the relative strength (RS). Then, using the relative strength in the main formula, the Relative Strength Index is determined.
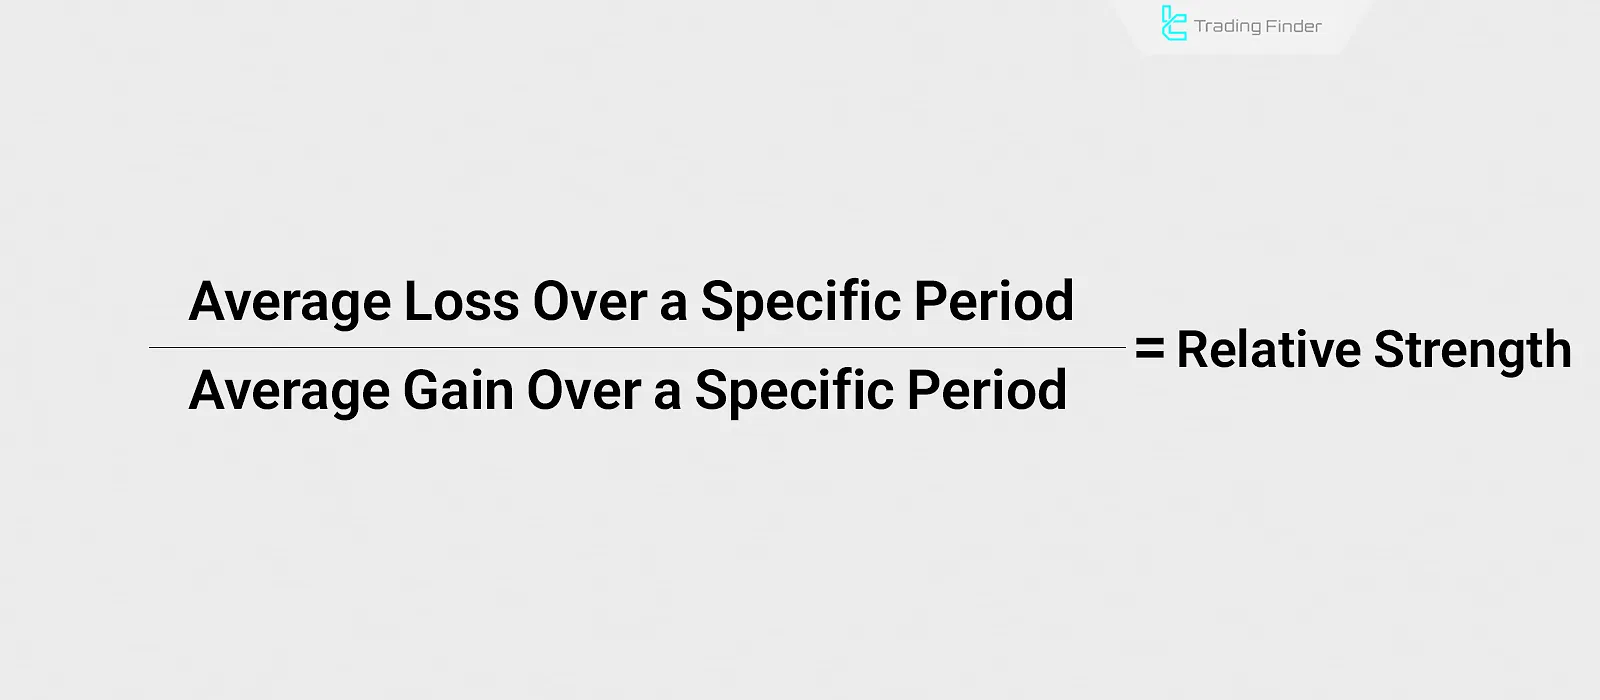
Relative Strength Index Calculation formula:
RSI Settings
The RSI indicator performs its calculations using a specific timeframe. Therefore, changing this timeframe can adjust the indicator’s performance for short-term or long-term trading strategies.
By default, RSI uses a 14-day period. Reducing this period increases the indicator’s sensitivity and produces more signals. On the other hand, increasing the period reduces the number of signals but helps minimize false signals.
What are the Applications of RSI?
By measuring trend strength, the RSI indicator is used in various scenarios such as identifying support and resistance levels, overbought and oversold conditions, divergences, and more.
Applications of RSI:
- Support and Resistance: When the RSI line reaches the middle of the display, it suggests an equilibrium between buyers and sellers, forming support and resistance zones;
- Overbought and Oversold: Entering the areas above 70 and below 30, indicates overbought or oversold conditions;
- Identifying Take Profit and Stop Loss Zones: By observing how price reacts to the main RSI levels, traders can place take profit and stop loss orders using the 0-100 RSI scale;
- Trend Continuation Confirmation: The 50 level is used to confirm the trend. For example, if the price is above 50, it confirms the continuation of a bullish trend;
- Divergence Detection: The RSI can detect both regular and hidden divergences, in both bullish and bearish scenarios.
On the Charles Schwab YouTube channel, the use of RSI is explained in a video format:
Important Patterns in RSI
In addition to divergences, the RSI indicator has several important behavioral patterns that are shaped by its core RSI components. By understanding these patterns, a trader can better analyze the structure of price movement in RSI Forex environments, identify weaknesses, and detect potential trend changes earlier.
These patterns also help reduce false signals and allow for more accurate decision making in volatile market conditions, particularly when applying Forex RSI in fast moving markets.
Range Shift
When RSI moves from one range to another, it is usually a sign of a change in the market phase.
- In an uptrend: RSI often remains above the 40 level;
- In a downtrend: RSI usually moves below the 60 level.
Swing Rejection
In this pattern, RSI enters an overbought or oversold zone and then reverses in the opposite direction without returning to that zone, a behavior rooted in the RSI formula and its underlying RSI calculation, creating a clear shift in market strength commonly observed across different types of RSI indicator used in RSI indicator in Forex trading.
This behavior is usually a sign of weakening momentum in the previous direction and can indicate the start of a correction or even a trend change with reasonable accuracy.
Trendline Break on RSI
Drawing a trendline on the Relative Strength Index can help identify the timing of a potential change in the indicator’s direction, allowing it to function as an effective RSI trend indicator and provide the trader with an early signal of weakening momentum measured by the RSI strength indicator.
This method is especially more reliable when price has not yet broken its main trendline and only the indicator shows early signs of internal divergence or loss of strength, a behavior that applies not only in Forex but also when using the RSI indicator for stocks.
In such conditions, a trendline break on RSI often occurs several candles before a behavioral change in price and can be used for more precise entries or exits.
Comparison of RSI With Similar Indicators
The RSI indicator belongs to the oscillator group, and its performance is somewhat similar to other technical tools. However, each one provides different behavior and signals. The table below highlights these differences.
Indicator | Signal Type | Strengths | Key Point |
Relative Strength Index (RSI) | Momentum strength and overbought or oversold conditions | Simple, fast, and practical | Becomes noisy on lower time frames |
Stochastic | Measures price position relative to the recent range | More sensitive than RSI | Generates many signals in ranging markets |
MACD | Trend strength and direction | Suitable for higher time frames | More lag compared to RSI |
CCI | Identifies price deviation from the mean | Suitable for explosive moves | Needs to be combined with other tools |
Divergence in RSI
In general, divergence refers to a lack of alignment between price movement and the indicator. Therefore, in the RSI indicator, if the highs or lows formed are inconsistent with those on the price chart, divergence has occurred.
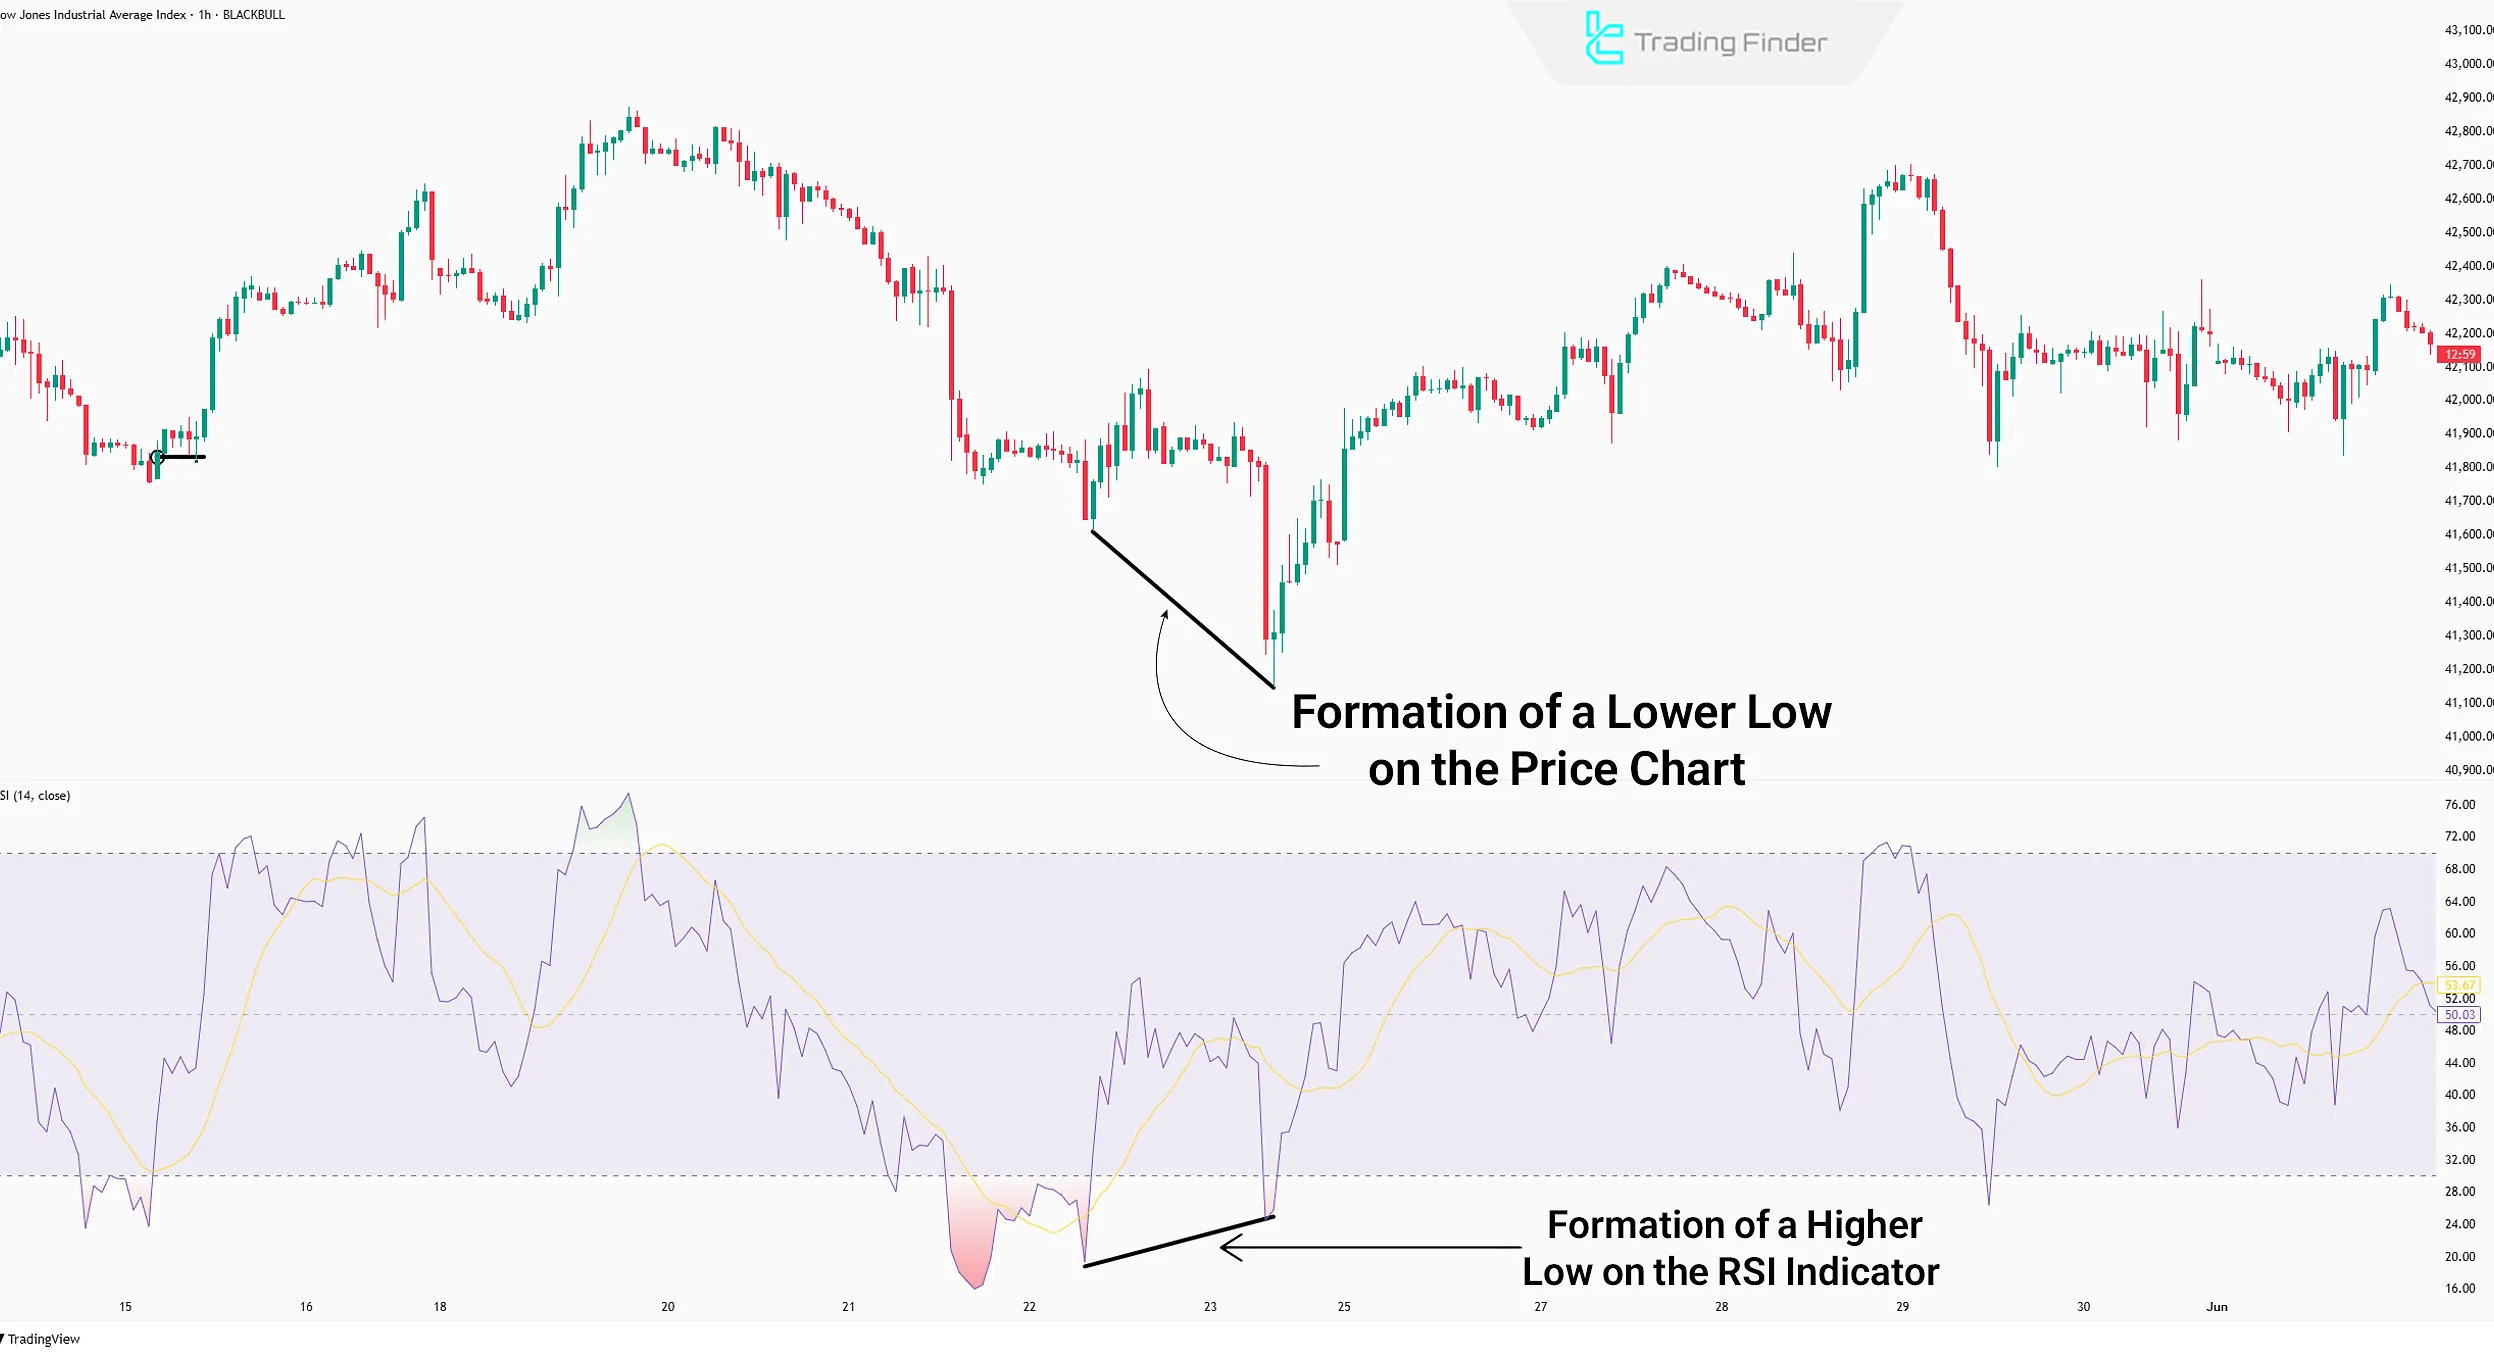
Regular Divergence
Regular divergence forms in two stages:
- Formation of new highs (in an uptrend) or new lows (in a downtrend);
- Formation of RSI highs and lows in the opposite direction of the levels formed on the price chart.
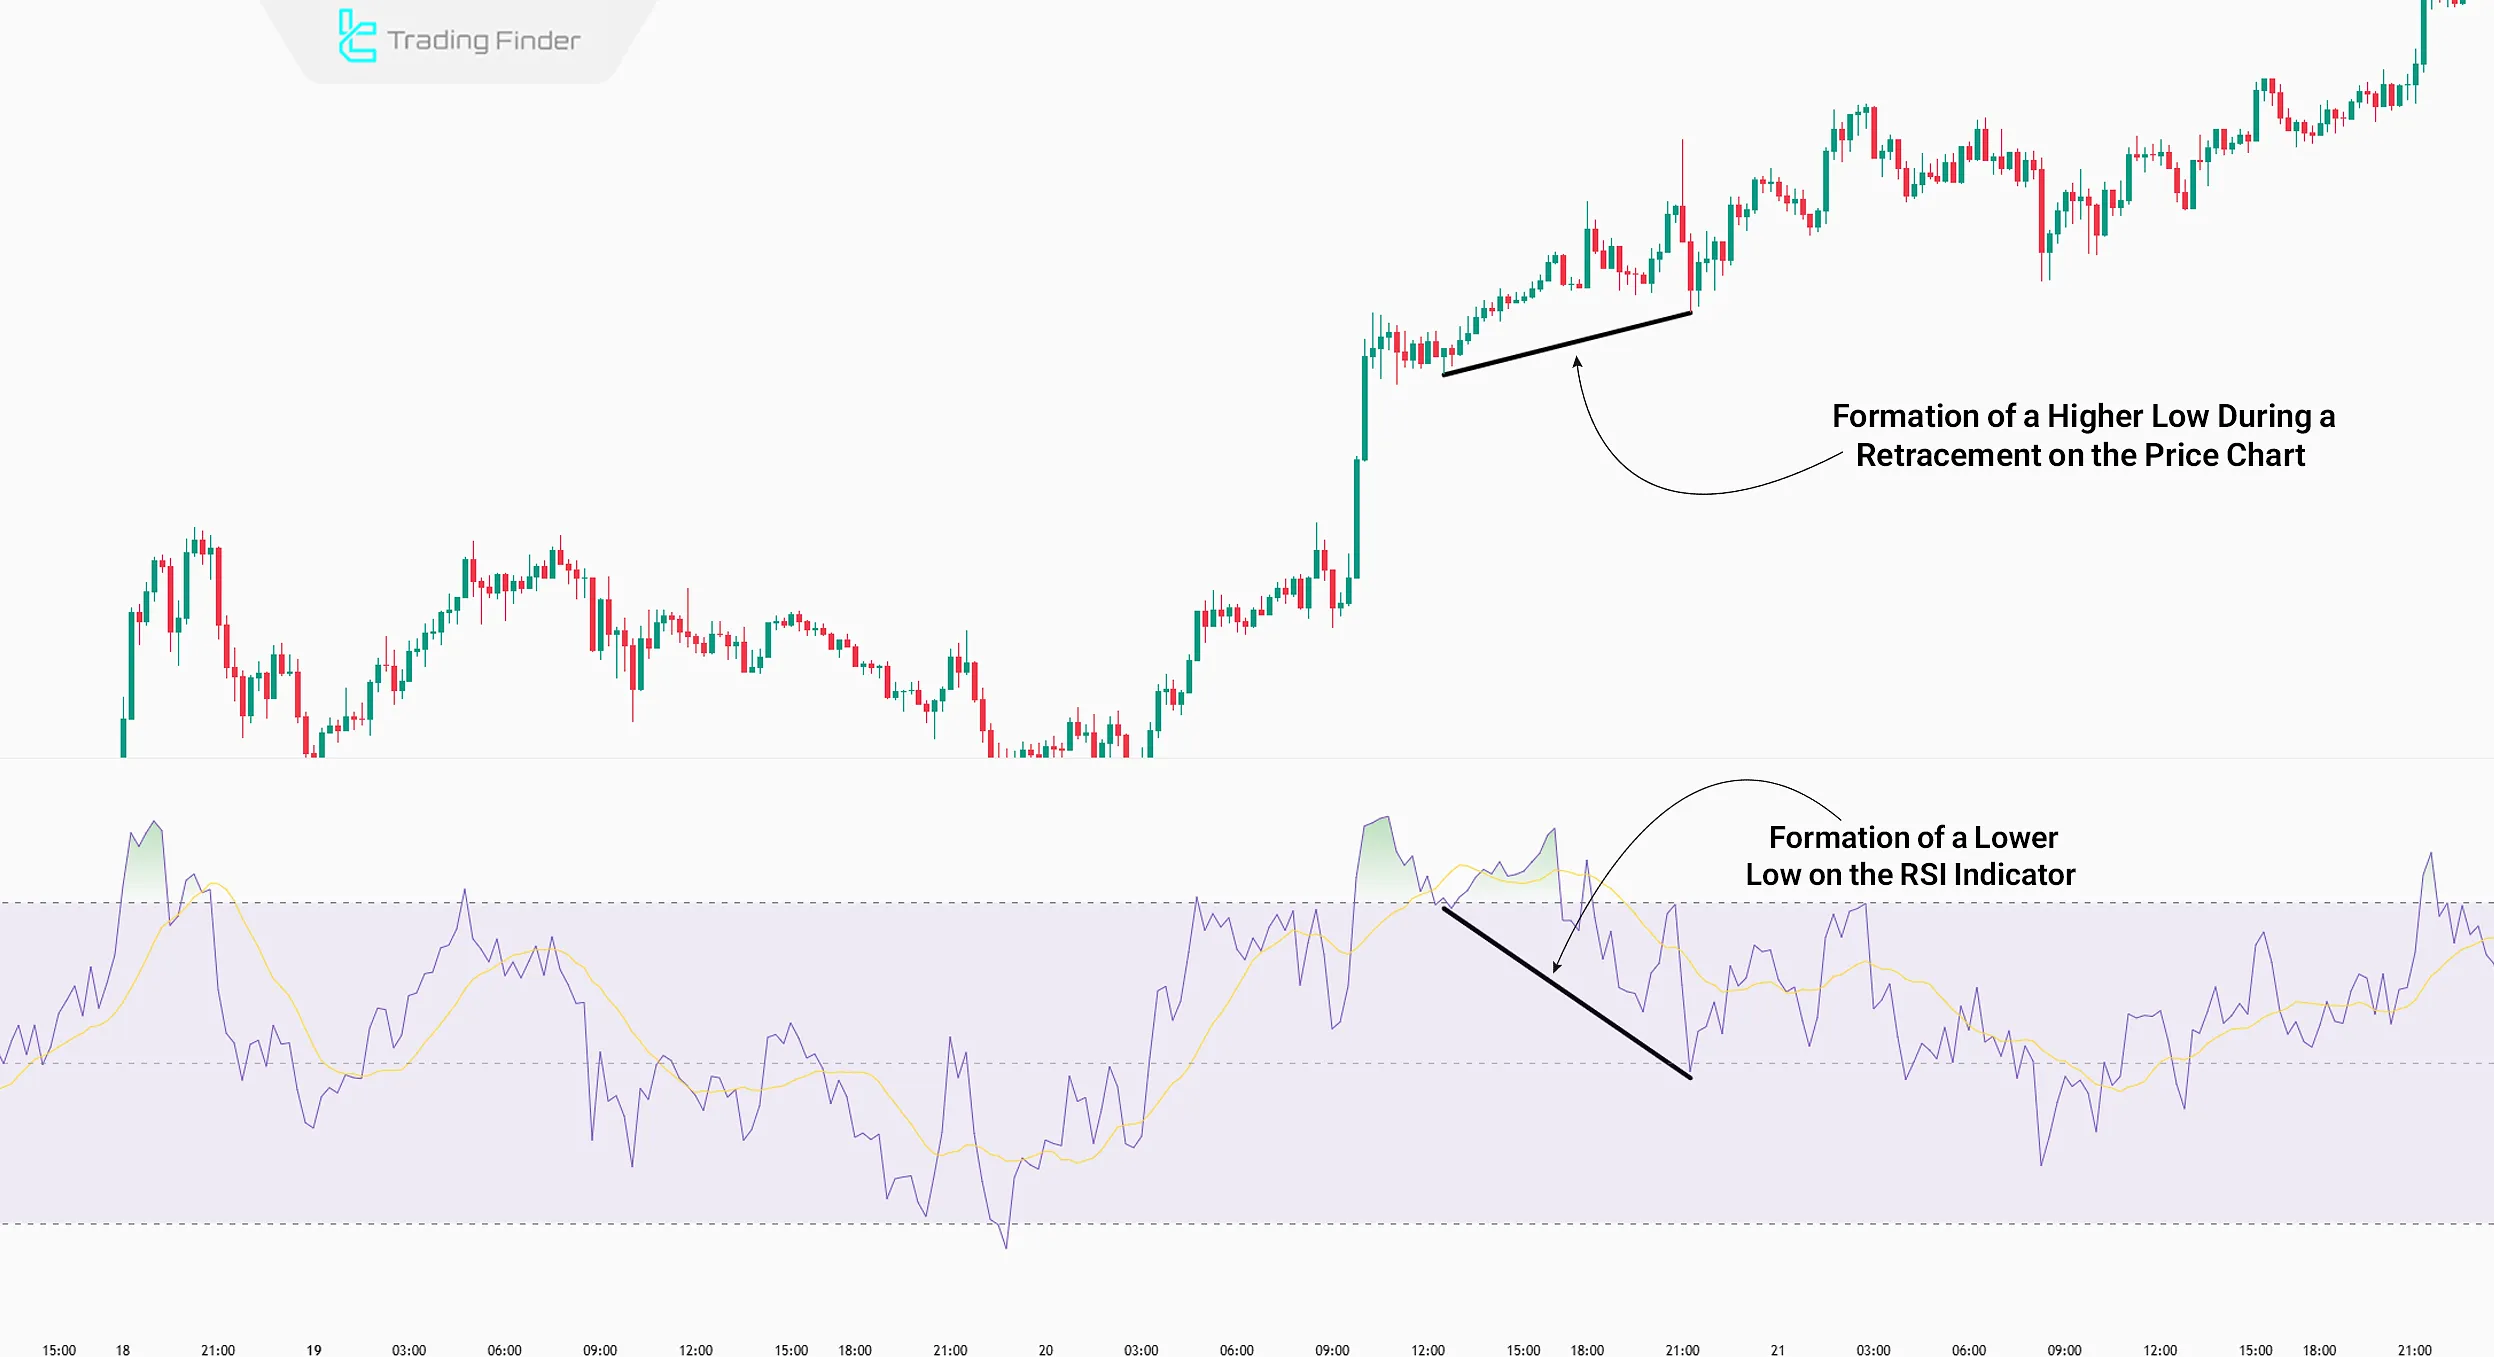
Hidden Divergence
In hidden divergence, the retracement of the trend is examined. It is formed through the following steps:
- Formation of a low (in an uptrend) or high (in a downtrend) during a price retracement;
- A mismatch between the highs/lows formed on the price chart and the RSI indicator.
RSI Behavior Across Different Time Frames
The behavior of RSI varies across different time frames, which is why a trader does not obtain identical results in all intervals. On lower time frames, the indicator fluctuates faster, while on higher time frames it shows smoother behavior.
RSI behavior across different time frames:
- Lower time frames: a high number of signals, but a higher error rate;
- Medium time frames: higher accuracy and suitable for combined analysis;
- Higher time frames: greater reliability of divergences;
- Fast moving markets: rapid RSI saturation and prolonged persistence in overbought or oversold zones.
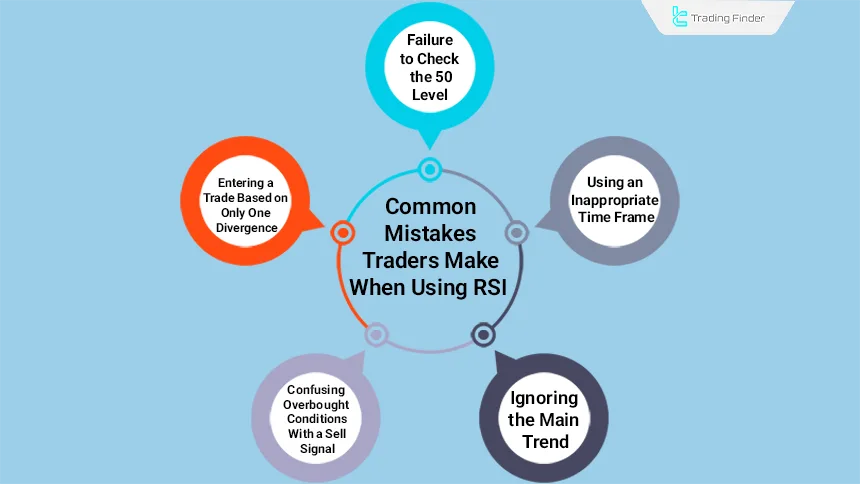
Common Trader Mistakes When Using RSI
A significant portion of trading errors occurs when a trader expects RSI to provide a definitive signal. This indicator should be used alongside trend analysis and market structure, and it should not be considered a standalone entry criterion.
Common mistakes in using RSI:
- Confusing overbought conditions with sell signals: reaching above the 70 level does not always mean a reversal;
- Ignoring the main trend: in strong trends, RSI can remain in overbought or oversold zones for a long time;
- Entering based on a single divergence: many divergences fail in strong trending markets;
- Using an inappropriate time frame: lower time frames are noisy and generate weak signals;
- Ignoring the RSI 50 level: this level defines the overall market direction, and neglecting it leads to misidentifying the market phase.
Advanced RSI Settings and Well-Known Alternative Values
The default RSI setting is set to 14, but many traders use other periods based on their trading style. These changes have a direct impact on the sensitivity of the indicator.
Commonly used values include:
- RSI with a 7 period: faster response and suitable for scalping;
- RSI with a 14 period: standard setting for most styles;
- RSI with a 21 period: slower signals and suitable for medium term analysis;
- RSI with a 2 period: suitable for identifying short term corrections;
- Using the 50 level instead of the 70 and 30 zones: defining the dominant market direction.
These settings should be selected based on the time frame and overall market structure.
Trading Strategies Using the RSI Indicator
The RSI indicator is widely used in trading strategies due to its ability to identify divergence, support and resistance levels, and overbought/oversold zones.
Trading Strategies Using RSI:
- Divergence Strategy: In this approach, a trade entry signal is generated after identifyingprice divergence;
- Trendline Strategy: First, trendlines are drawn on both the RSI and the price chart. Then, when both the RSI and price hit these lines simultaneously, a trade entry signal is triggered;
- Overbought/Oversold and Support/Resistance Combination Strategy: When price hits support or resistance zones and a divergence forms on the RSI, a trade entry signal is generated in the direction of the divergence.
How to Improve RSI Performance?
Using the Relative Strength Index (RSI) on its own can carry high risk when entering trades. Therefore, combining it with other tools and concepts in technical analysis improves the success rate of trading strategies.
Although the RSI is highly compatible with most technical analysis methods, combining it with tools like classic chart patterns, candlestick patterns, or Average True Range (ATR) enhances the win rate of strategies.
Technical Tools and Concepts to Combine with RSI:
- Classic Patterns
- Candlestick Patterns
- Support and Resistance
- Stochastic Indicator
- Average True Range (ATR)
- Moving Average Indicator
Automatic RSI Divergence Indicator
The Automatic RSI Divergence indicator, or RSI Divergence, is an intelligent tool designed to identify discrepancies between price behavior and momentum.
It can automatically mark bullish and bearish divergences on the chart. These divergences are considered among the most reliable signals for identifying the start of a trend reversal or the continuation of the market’s primary move.
This indicator works similarly to divergence detection tools such as MACD Divergence and, by analyzing consecutive highs and lows, highlights points where price and the Relative Strength Index do not move in the same direction.
The addition of alert and notification features in the new version enables traders to receive important signals accurately and on time.
The application of this tool is not limited to a single market, and it delivers reliable performance in Forex, cryptocurrencies, indices, commodities, and stocks.
Numerous examples of detecting positive and negative divergences across different charts show how the indicator can identify trend weaknesses and generate reliable buy or sell signals.
For example, when price forms a new low but RSI fails to confirm it, selling pressure is usually weakening and the probability of a new bullish wave increases. In the opposite case, forming a new high accompanied by RSI weakness signals buyer exhaustion and the potential for a price correction.
In risk management, the take profit is usually set based on reaching the opposite overbought or oversold zone, and the stop loss is placed near the most recent high or low to ensure more logical exit conditions.
Adjustable parameters such as the RSI period, the number of candles used to calculate pivots, the distance between pivots, and the colors of bullish and bearish signals provide full customization capabilities.
Overall, RSI Divergence is one of the most precise tools for identifying trend weakness, potential corrections, and reversal points, and it is fully suitable for day trading, scalping, and swing trading styles.
- Automatic RSI Divergence Indicator for MetaTrader 4
- Automatic RSI Divergence Indicator for MetaTrader 5
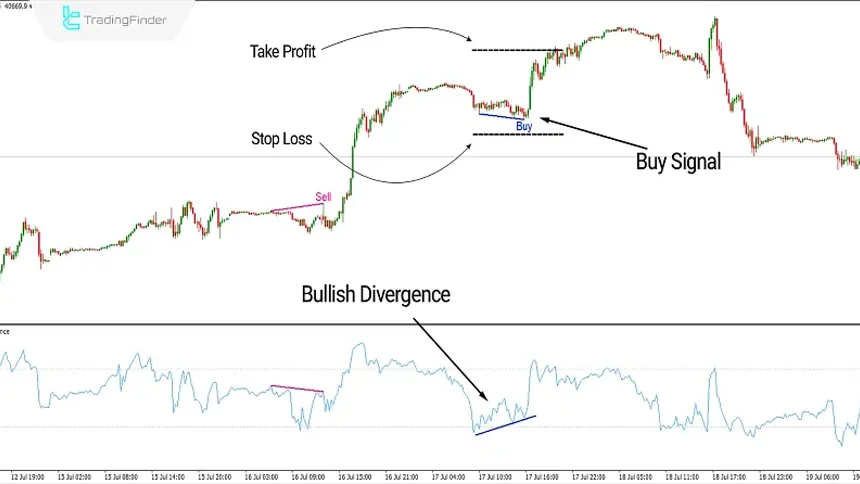
Practical Example of a Buy Trade Using Bullish Divergence in the Automatic RSI Divergence Indicator
Below, an example of a buy trade after the formation of a bullish divergence can be observed within a structured RSI technical analysis framework. In this example, price forms a new low at the end of a corrective move, while the RSI indicator records a higher low.
This conflict between price and RSI indicates weakening selling pressure and highlights how the indicator functions as a reliable RSI signal indicator, pointing to the probability of the start of a new bullish wave.
After the completion of the bullish divergence, the indicator issues a Buy signal on the chart and the long position is activated. For risk management, the stop loss is placed near the most recent low, and the take profit is determined based on the next overbought zone or a technical resistance area.
As shown on the chart, after the signal is generated, price begins a strong upward move and the take profit level is fully reached.
This example demonstrates that combining bullish divergence with an advanced RSI indicator and its automatic signals can create low risk and precise trading opportunities, especially when the divergence forms at the end of a correction or within key chart areas.
Checklist for Proper Use of RSI
Before using RSI for entry or exit decisions, it is necessary to explain RSI in the context of its core RSI function, carefully examining overall market conditions and price behavior to avoid receiving false signals.
RSI delivers its highest accuracy when applied within RSI indicator trading alongside the trend, market structure, and key levels, and when used as a final confirmation rather than the sole decision making criterion.
Before any entry using RSI, the following should be checked:
- Trend condition on the higher time frame;
- Price position relative to key levels;
- Alignment of the RSI 50 level with market direction;
- Presence or absence of a valid divergence;
- Price distance from the EMA 50 or 200;
- Whether the market is ranging or trending.
Use of RSI in ICT Structures
In the ICT style, the RSI indicator is used as a supplementary tool to identify weakness in price movement. Combining this indicator with market structure allows reversal points to be identified with higher accuracy.
Main applications of RSI in ICT structure
- RSI after liquidity: when price sweeps a significant high or low, RSI usually shows signs of momentum weakness, and this behavior can precede a directional change;
- RSI alongside BOS or CHoCH: if after a structure break RSI simultaneously crosses the 50 level, the probability of continuation in the new direction increases and the signal carries higher validity;
- RSI and Fair Value Gap (FVG): when RSI displays bullish or bearish weakness and price enters an FVG zone, conditions are often set for a correction or a short-term reversal.
Conclusion
The RSI indicator is an oscillator designed to measure trend strength. By default, it analyzes price movements over a 14-day period.
RSI can identify overbought and oversold conditions, various types of divergence, and support and resistance levels. These features make it applicable across different analysis methods and financial markets.
Since RSI derives its signals based on past market data, it naturally has some lag. Therefore, combining it with other technical analysis tools such as classic patterns, increases the success rate of trading decisions.


