


The Xmaster Formula Forex Indicator issuesentry signals based on overbought and oversold zones. A key advantage of this indicator is its applicability across all timeframes, offering flexibility in analysis and ease of use.
Traders typically use this indicator to identify highly volatile currency pairs (especially during the London trading session).
It is designed with a simple yet practical structure, allowing users to spot potential trend reversals or continuations without advanced technical analysis knowledge.
The Xmaster Formula indicator is suitable for scalpers in both short-term trades and medium- to long-term traders.
Definition of Xmaster Formula Indicator
The Xmaster Formula Indicator is a technical analysis tool that utilizes a combination of several analytical algorithms to detect price trends. Despite its advanced internal structure, it is easy to use and does not require deep technical expertise.
Its simplicity allows it to be configured and adapted to any timeframe and used across various financial markets.
The internal system of this tool is based on indicators such as Moving Average (MA), MACD indicator, Bollinger Bands, and other technical tools. These help in more accurately identifying support and resistance levels and potential price reversal points.
To download the indicator, you can use the following links:
- Download Xmaster Formula Indicator for MetaTrader 4;
- Download Xmaster Indicator Formula for MetaTrader 5;
- Xmaster Formula Indicator for TradingView.
Pros and Cons of the Xmaster Formula Indicator
The following table presents the advantages and disadvantages of the Xmaster Formula Indicator:
Advantages | Disadvantages |
Easy to use | Few signals |
Beginner-friendly | Requires significant patience |
Suitable for major currency pairs | Possibility of false signals |
High percentage of reliable signals | Requires signal confirmation with other indicators |
Highly flexible and adaptable to different strategies | – |
Features of the Xmaster Formula Indicator
Key features of this indicator include:
- Usable for analyzing both major and minor currency pairs;
- Performs best during the London session, also usable in theNew York session;
- Supports both long-term and short-term timeframes;
- Displays simple, color-coded signals (Green = Buy, Red = Sell);
- Applicable for scalping, day trading, and swing trading.
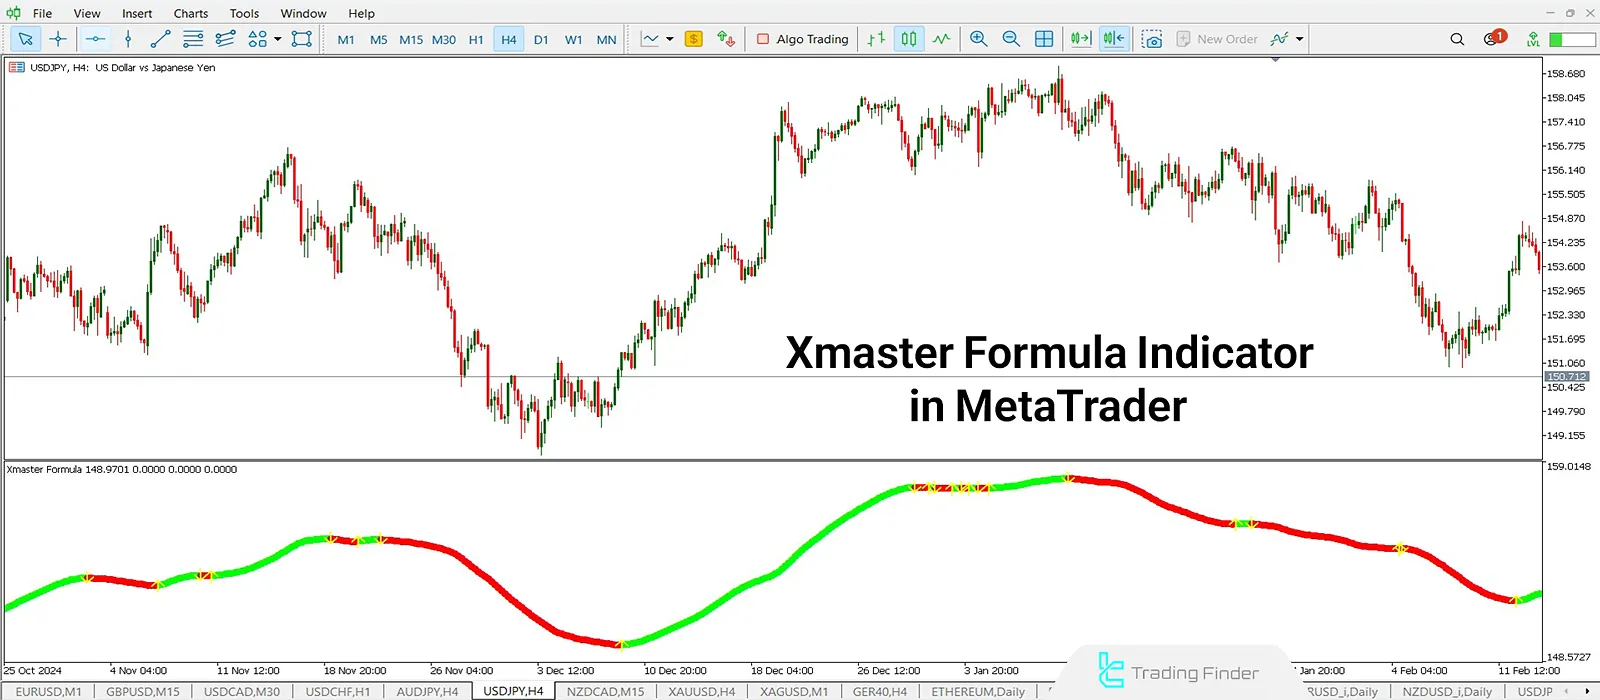
Overbought and Oversold Detection in the Xmaster Formula Indicator
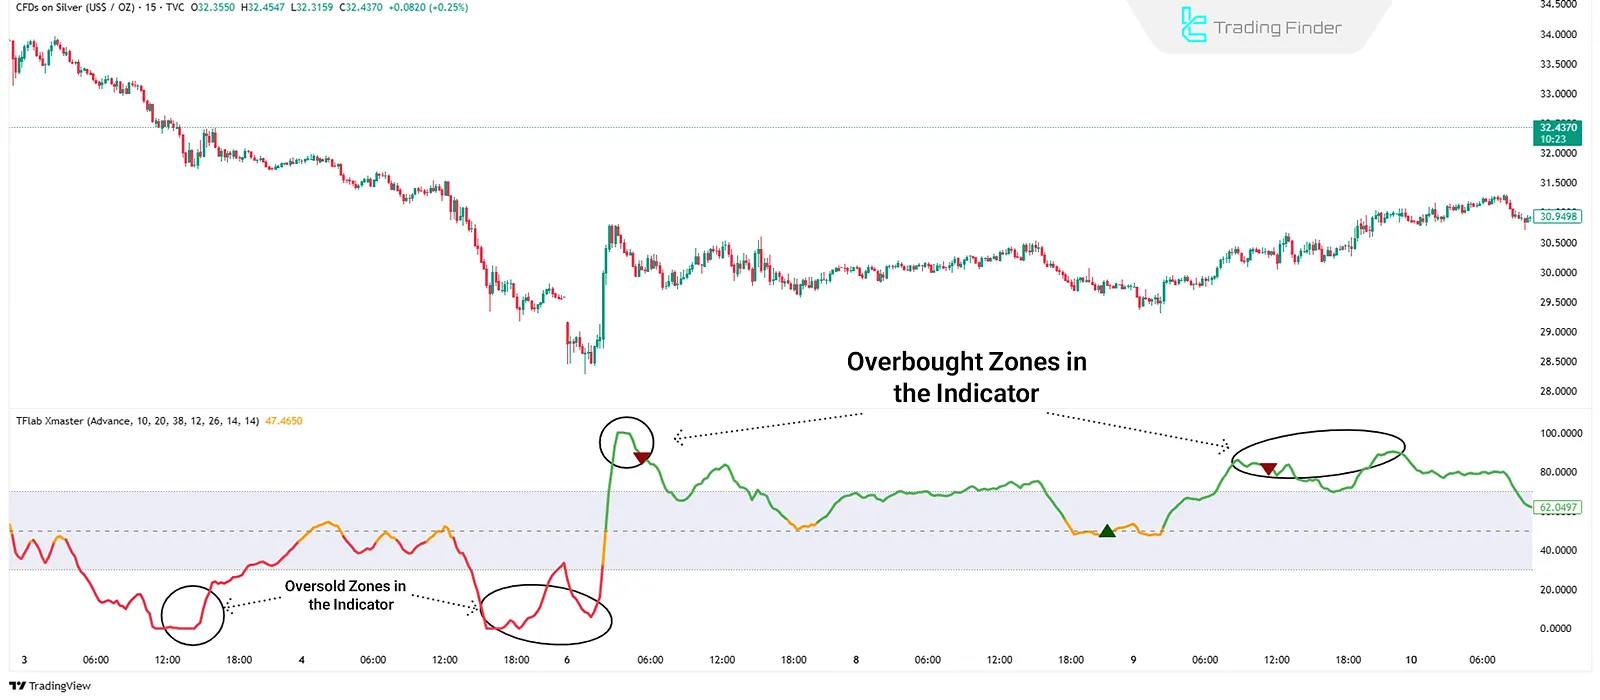
One of the major uses of the Xmaster (XHMaster) Formula Indicator is identifying Overbought and Oversold zones. Traders can use this feature to more accurately detect potential price reversal points.
- When the indicator turns red and appears at the top of the chart, it indicates an overbought condition, suggesting a possible downward correction;
- Conversely, when the indicator turns green and appears at the bottom of the chart, it usually signals oversold conditions, indicating a potential upward move.
Key Notes for Using the Xmaster Formula Indicator
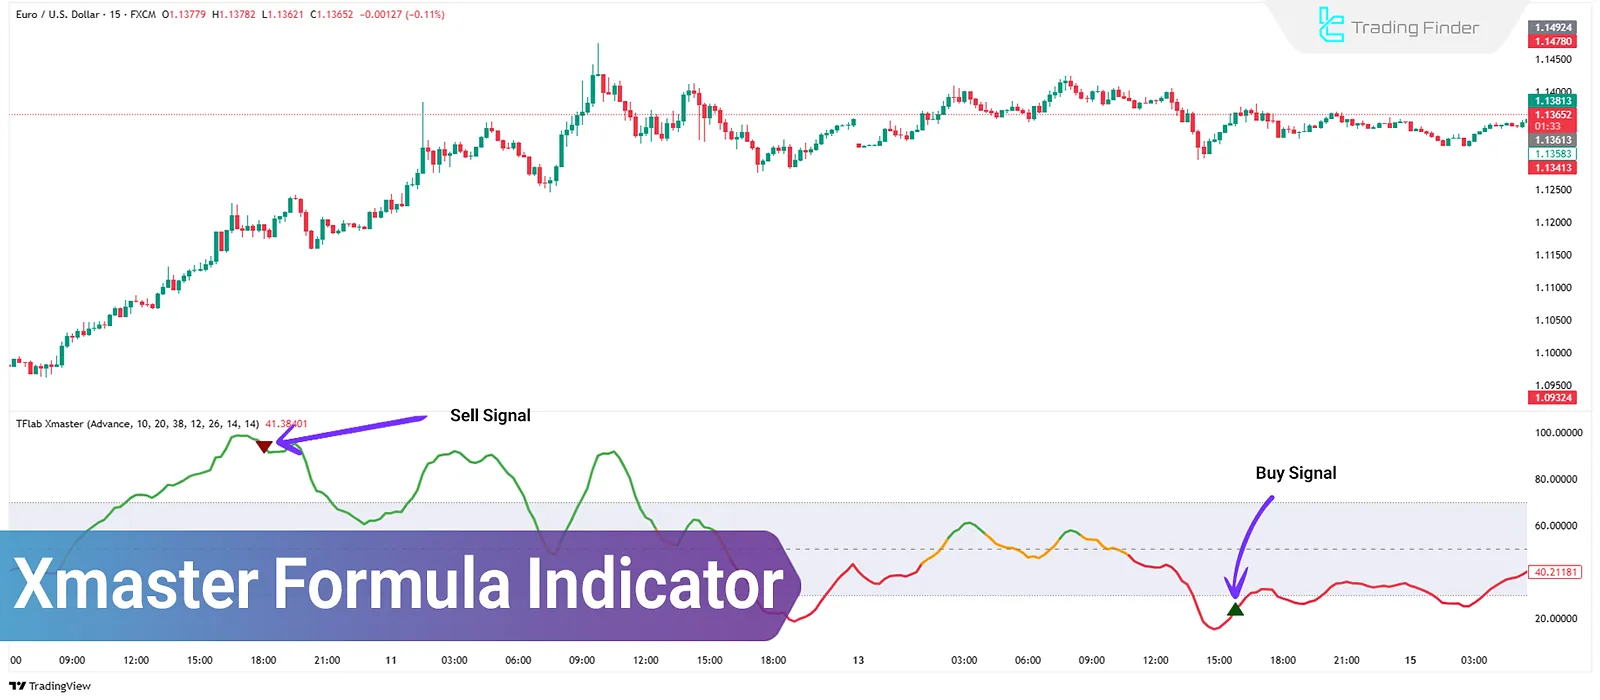
To use this indicator effectively, pay close attention to thered and green lines:
- Red typically represents a sell signal
- Green usually represents a buy signal
These colors can be customized in the indicator's settings.
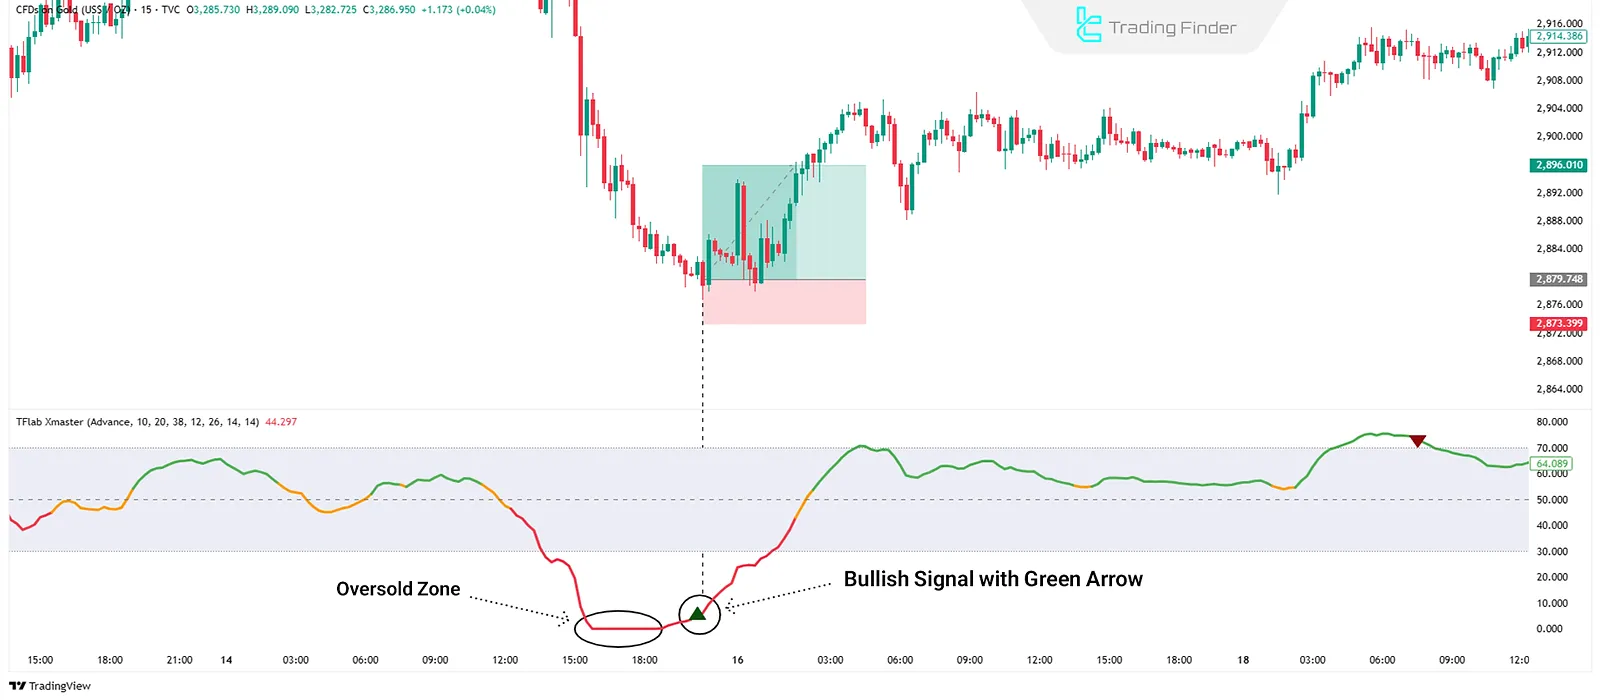
Buy Rules Using the Xmaster Formula Indicator
To use this indicator for buy trades, follow these rules:
- Enter a buy position when the indicator arrow turns green;
- The indicator line must be in the oversold zone;
- Strong bullish candlestick adds more reliability to the signal;
- Place the stop loss below the signal candlestick;
- When the line turns yellow or hits resistance, take a profit.
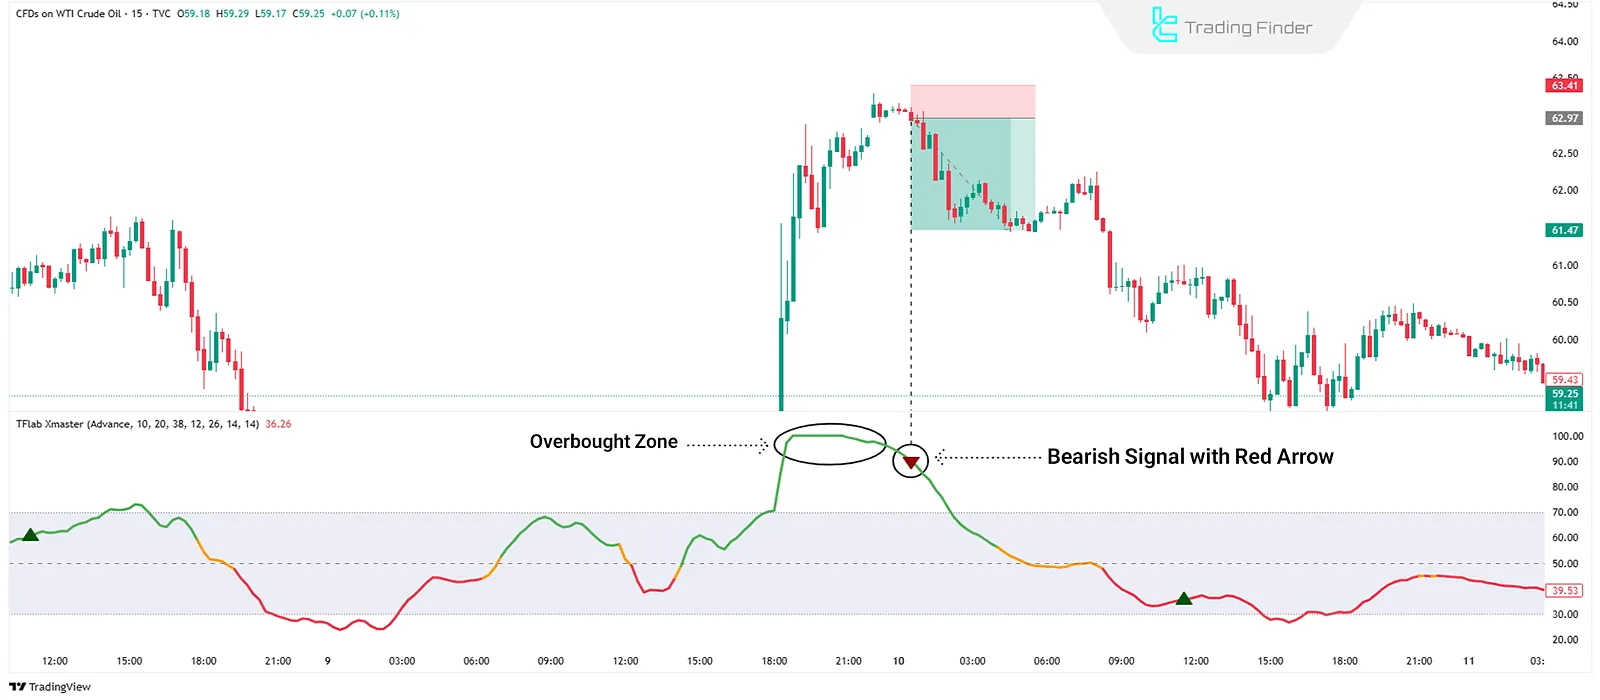
Sell Rules Using the Xmaster Formula Indicator
To use this indicator for sell trades, follow these rules:
- A red arrow from the indicator gives a sell signal
- The line must be in the overbought zone
- A strong bearish candlestick confirms the sell signal
- Place the stop loss above the signal candlestick
- When the arrow color changes or support is hit, close the position
How to Install the Xmaster Indicator on MetaTrader
To install and run the indicator, follow these steps:
- Download the XmasterFormulainstallation file from the Trading Finder website
- Launch MetaTrader
- Navigate to the path via:
- File > Open Data Folder > MQL > Indicators
- Move the indicator file into the Indicators folder
- Close and restart MetaTrader
- Add the indicator from the Custom Indicators section to your chart
- Finally, configure the settings based on your needs and trading style
Note: Installation for both MetaTrader 4 (MT4) and MetaTrader 5 (MT5) is similar.
Conclusion
The Xmaster (XHMaster) Formula Indicator is a tool for identifying price trends and current market sentiment. It is easy to use, customizable for different timeframes, and freely available on the TradingFinder website, compatible with TradingView and MetaTrader platforms.
For better buy and sell signals, it's recommended to use it in combination with other indicators such as Bollinger Bands or Fibonacci retracement.


