


Indicators are computational tools based on price and volume data, used for technical analysis and generating trading signals.
The Williams %R indicator, developed by renowned trader and author “Larry Williams”, is primarily designed to identify overbought and oversold conditions in the market.
What is the Williams %R Indicator?
Williams%R% is a momentum oscillator that measures the strength of recent price movements. It indicates where the current price stands in relation to a specific range of the highest and lowest prices.
Williams% %R Formula:
Terms used in the formula:
- Highest High: The highest price within a defined period (e.g., last 14 candles)
- Lowest Low: The lowest price in that same period
- Close: The closing price of the current candle
Advantages and Disadvantages of the Williams %R Indicator
You should be aware of them before deciding whether this strategy aligns with your trading goals and risk tolerance. Here is a summary of the key pros and cons:
Advantages | Disadvantages |
Fast signal generation | Possible false signals in strong trends |
Easy to understand and use | Due to its leading nature, signals may be premature |
Can be combined with other indicators | – |
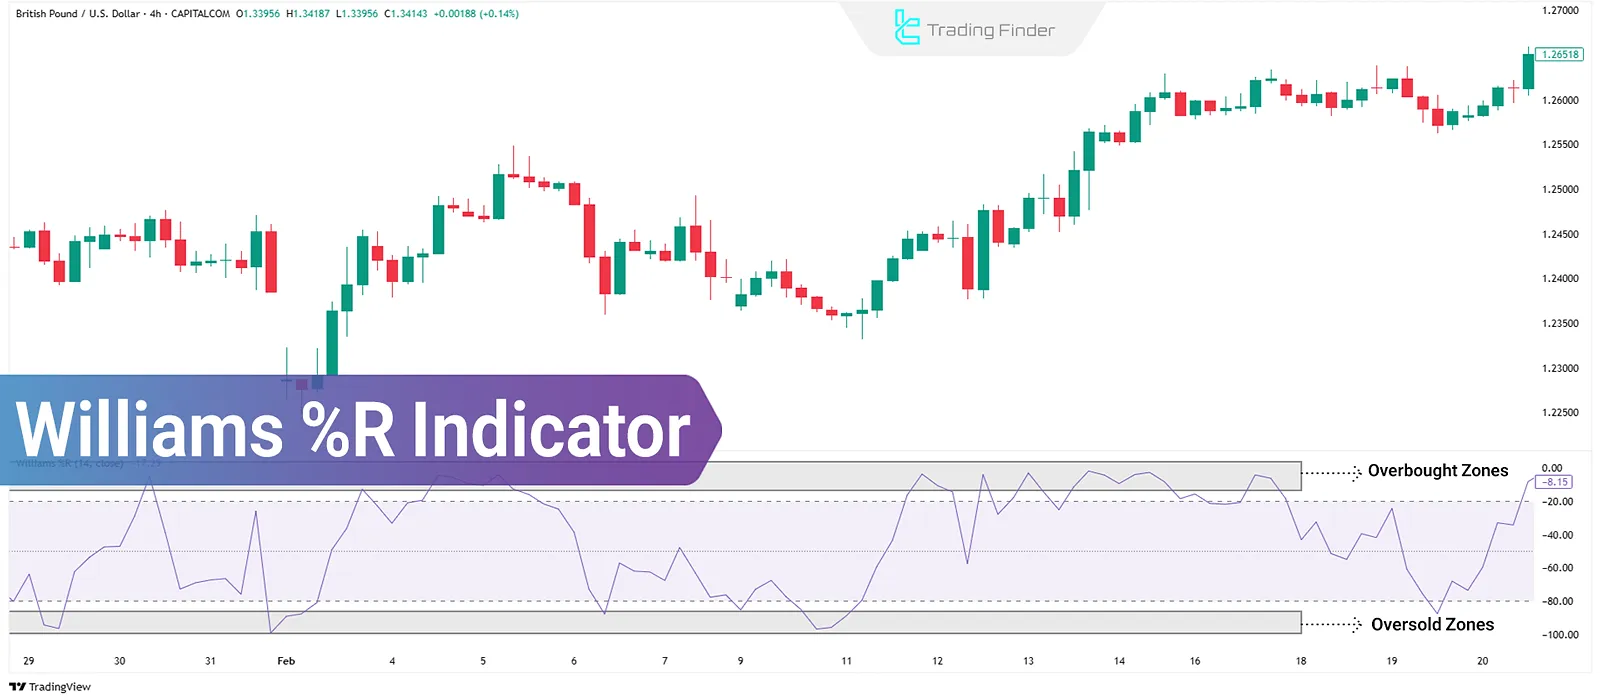
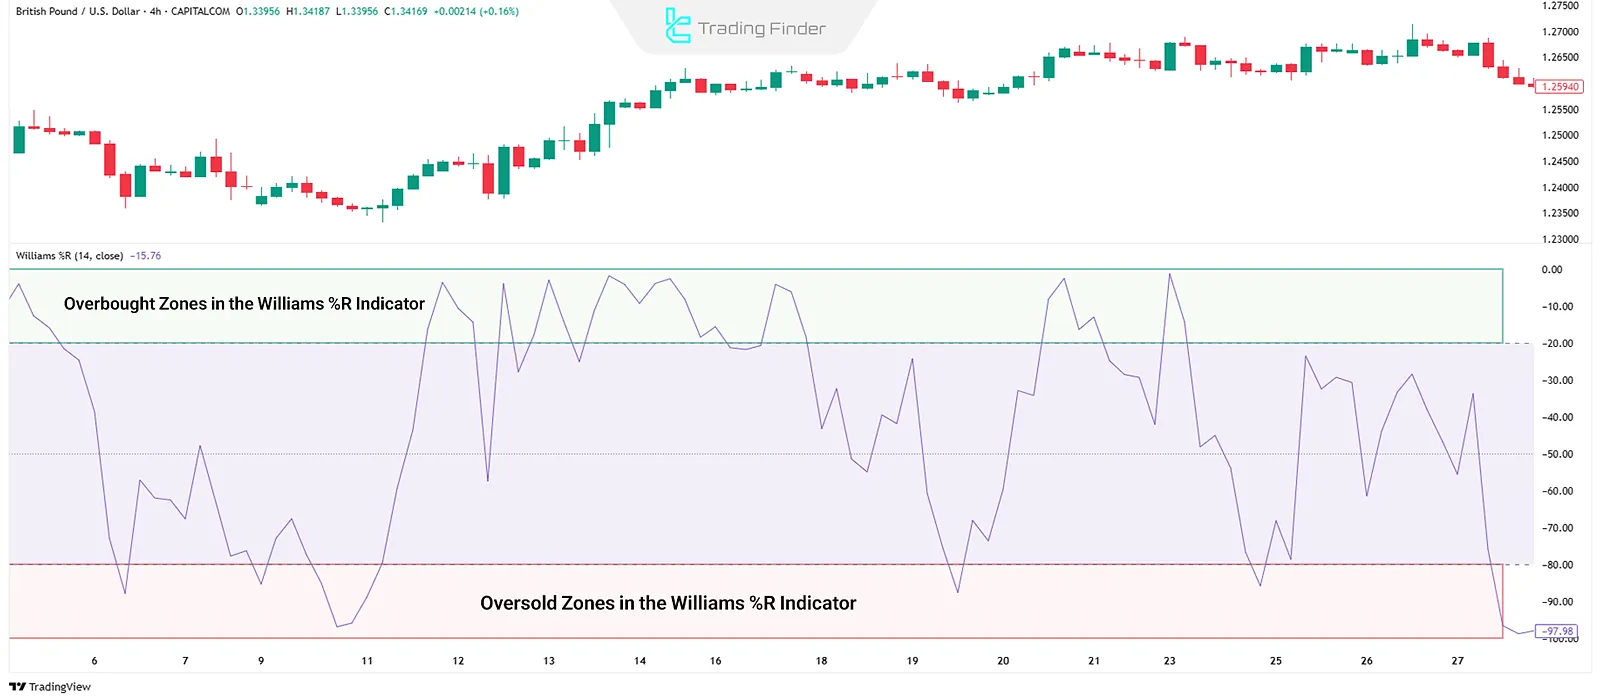
Williams %R Oscillation Range
The oscillation range of this indicator is as follows:
- The value fluctuates between 0 and -100;
- Readings between 0 and -20 indicate Overbought conditions;
- Readings between -80 and -100 indicate Oversold conditions.
Ways to Use the Williams %R in Trading
Some of the ways to use the Williams %R indicator are as follows:
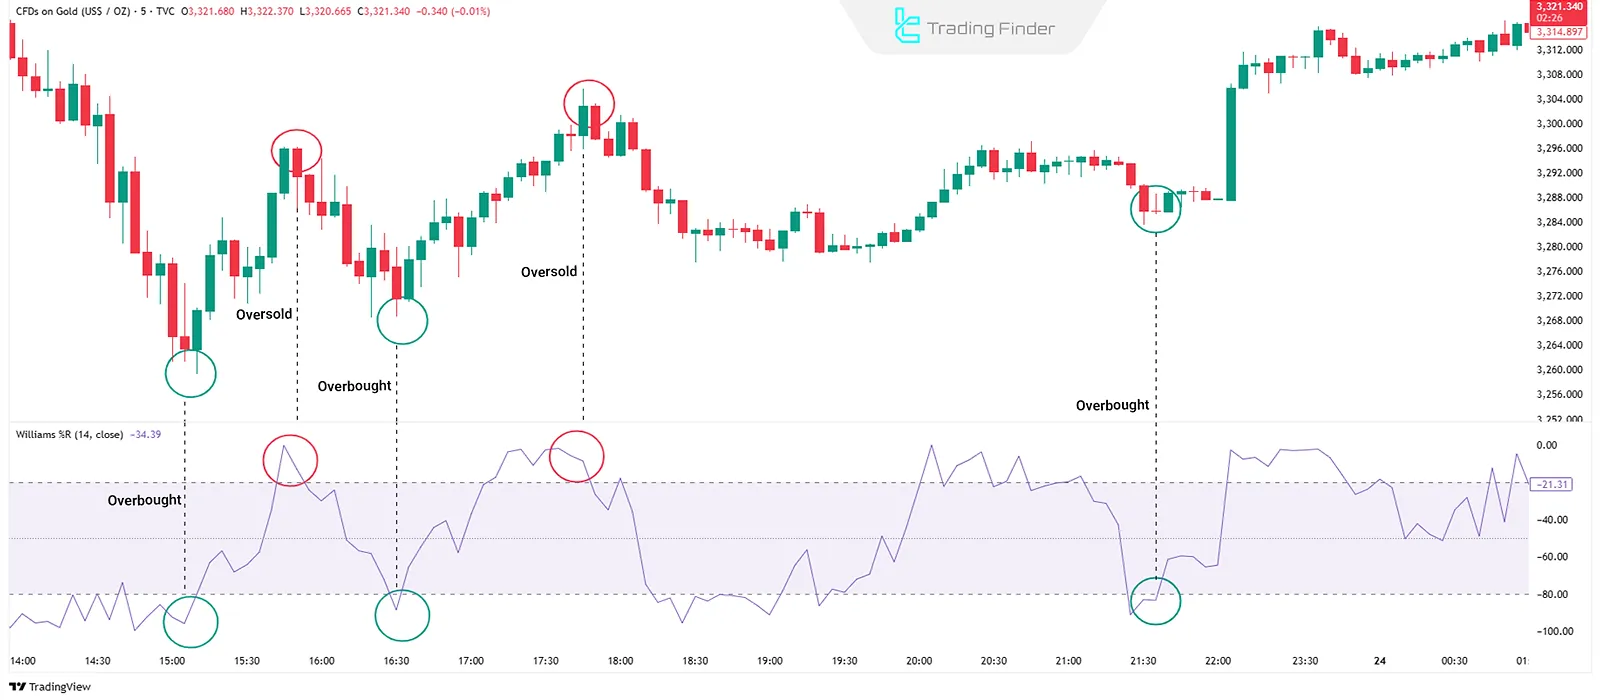
Identifying Overbought and Oversold Levels
One of the most basic and common uses of the Williams %R is to detect overbought and oversold zones:
- When the indicator rises above -20, it may indicate an overbought condition; traders should watch for potential corrections or bearish reversals;
- When the indicator falls below -80, it may signal an oversold condition, suggesting a possible bullish reversal.
Reversal Signals
Crossing the overbought or oversold zones can act as a potential reversal signal:
- Sell signal is generated when the indicator drops below -20;
- Buy signal occurs when it rises above -80.
Trend Confirmation
Many professional traders use Williams %R to confirm ongoing trends:
- In an uptrend, if the indicator frequently oscillates between -20 and -50, it supports trend continuation;
- In a downtrend, it typically moves between -50 and -80, confirming bearish conditions.
Trading Strategies Based on Williams %R
Effective strategies using the Williams %R indicator can be developed through the following two methods:
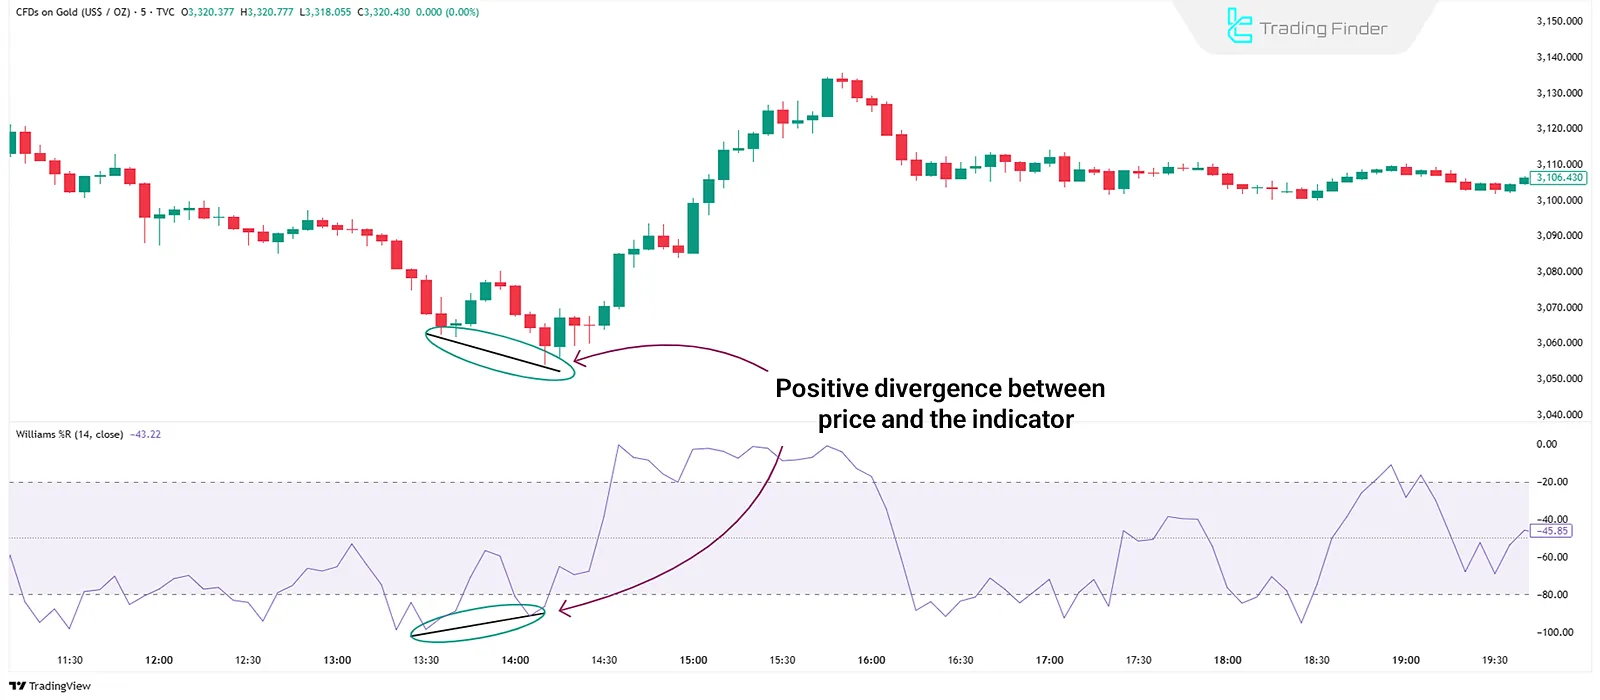
Divergence
Divergence is one of the most effective strategies using Williams %R:
- Positive Divergence: Price makes a lower low, but Williams %R forms a higher low, possibly a bullish reversal;
- Negative Divergence: Price makes a higher high, but Williams %R shows a lower high, possibly a bearish reversal.
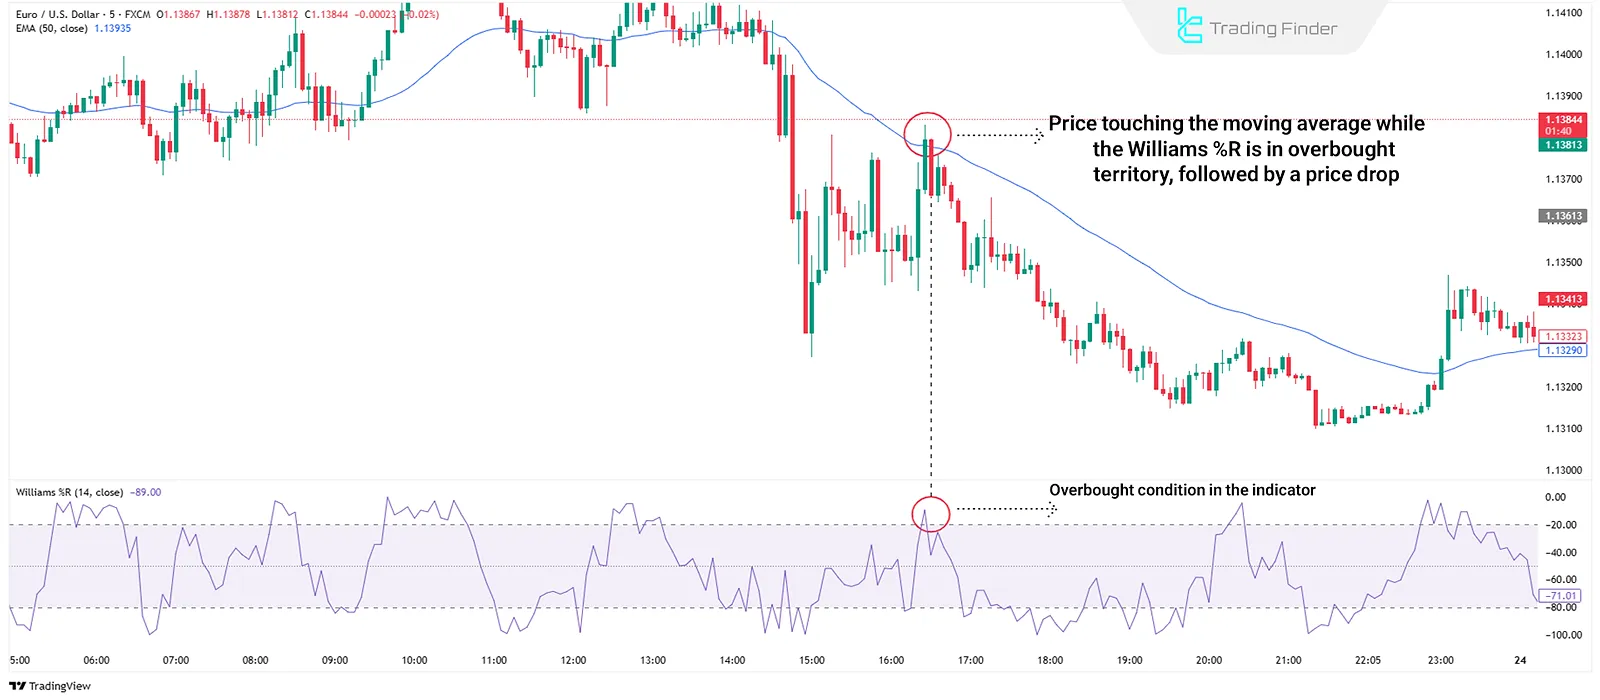
Combining with Moving Averages
A practical way to use Williams%R %R is to combine it with Moving Averages:
- In an uptrend (price above the 50-period MA), only buy signals from Williams %R are considered;
- In a downtrend (price below the 50-period MA), only sell signals are considered.
Key Tips for Using Williams %R
To use the Williams %R indicator effectively, consider the following:
- Adjusting the period: Larry Williams suggests a 14-candle period, but other periods like 9 or 21 may work better in specific markets (e.g., crypto or forex);
- Combine with price action: Williams %R signals are more reliable when confirmed by price action patterns like candlestick formations or support and resistance levels;
- Volume confirmation: Signal strength increases when volume rises in alignment with Williams %R movements.
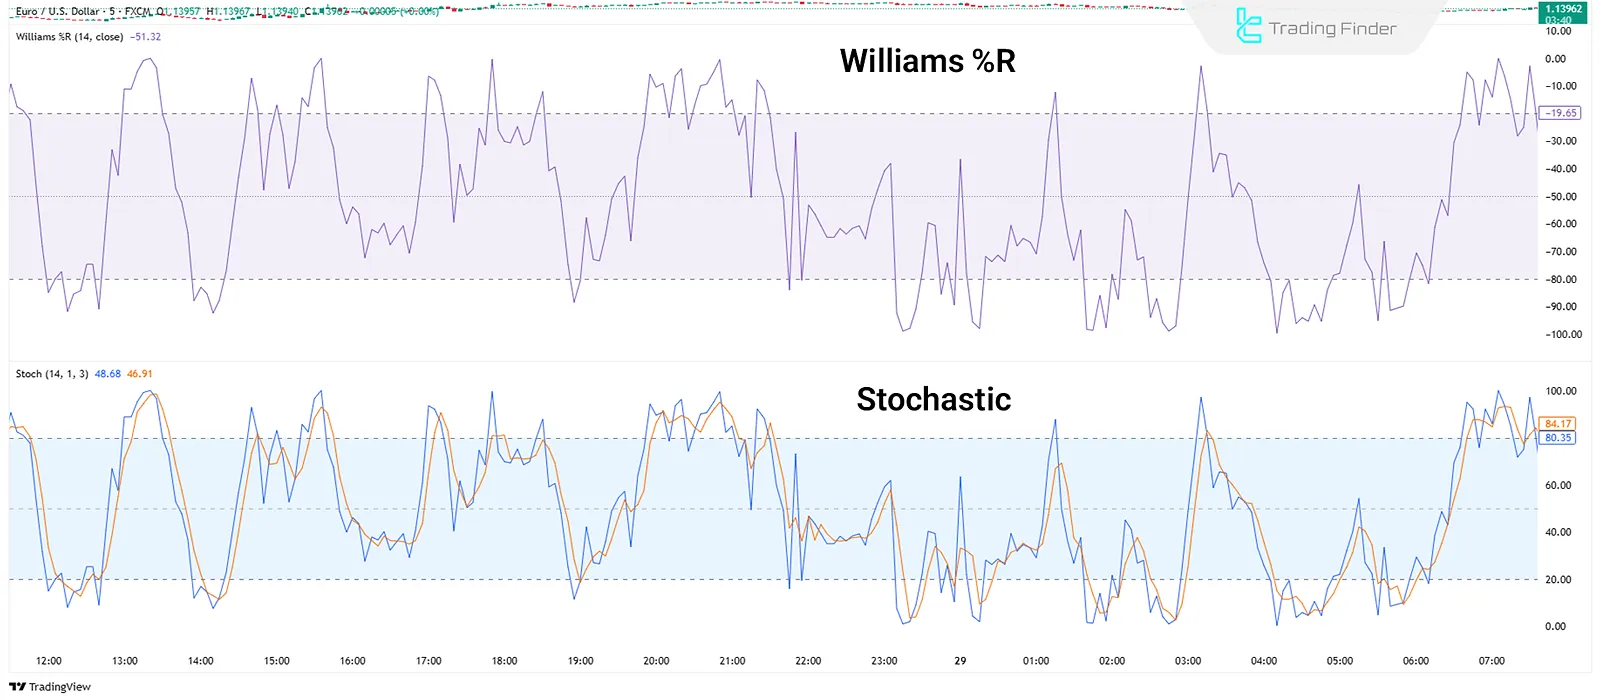
Difference Between Williams %R and the Stochastic Oscillator
Although Williams %R is similar to the Stochastic Oscillator, there are notable differences:
- Stochastic ranges from 0 to 100, while Williams %R ranges from 0 to -100;
- Williams %R generally reacts faster to price changes;
- Williams %R is a single reversed line, while Stochastic includes two lines (K and D) and signal.
Conclusion
The Williams %R indicator, as a momentum-based tool, helps traders detect overbought and oversold conditions. By analyzing its interaction with price movements, one can identify signs of trend strength or weakness.
Its effectiveness is enhanced when used alongside price action, volume analysis, and market structure.
This indicator can also act as a gauge of trader sentiment; sharp moves often indicate strong market enthusiasm, while slower changes may suggest uncertainty or a gradual shift in trend.


