- TradingFinder
- Education
- Technical analysis Education
Technical analysis Education - 3
Technical analysis is a method for evaluating price movements in financial markets, emphasizing price charts, chart patterns, trends, trading volume, and indicators. Unlike fundamental analysis, which assesses an asset’s intrinsic value based on economic and financial factors, technical analysis relies on historical price behavior and structured patterns to identify high-probability trading opportunities. Classical technical analysis tools include trendlines, support and resistance levels, price channels, oscillators, and momentum indicators. These tools assist traders in defining market direction, measuring trend strength, and pinpointing precise entry and exit points. Modern technical analysis extends beyond conventional tools, incorporating market structure, liquidity dynamics, and order flow. Advanced methodologies such as price action, the Smart Money Concept (SMC), Inner Circle Trader (ICT) strategies, harmonic patterns, Elliott Waves, and the Read the Market (RTM) approach enable traders to identify institutional liquidity zones, track price manipulation, and refine execution strategies with greater accuracy. TradingFinder offers a comprehensive suite of educational content and analytical tools, bridging classical and modern technical analysis. It equips traders with specialized insights into liquidity models, market structure interpretation, and price movement assessments, enhancing their ability to navigate complex market conditions.
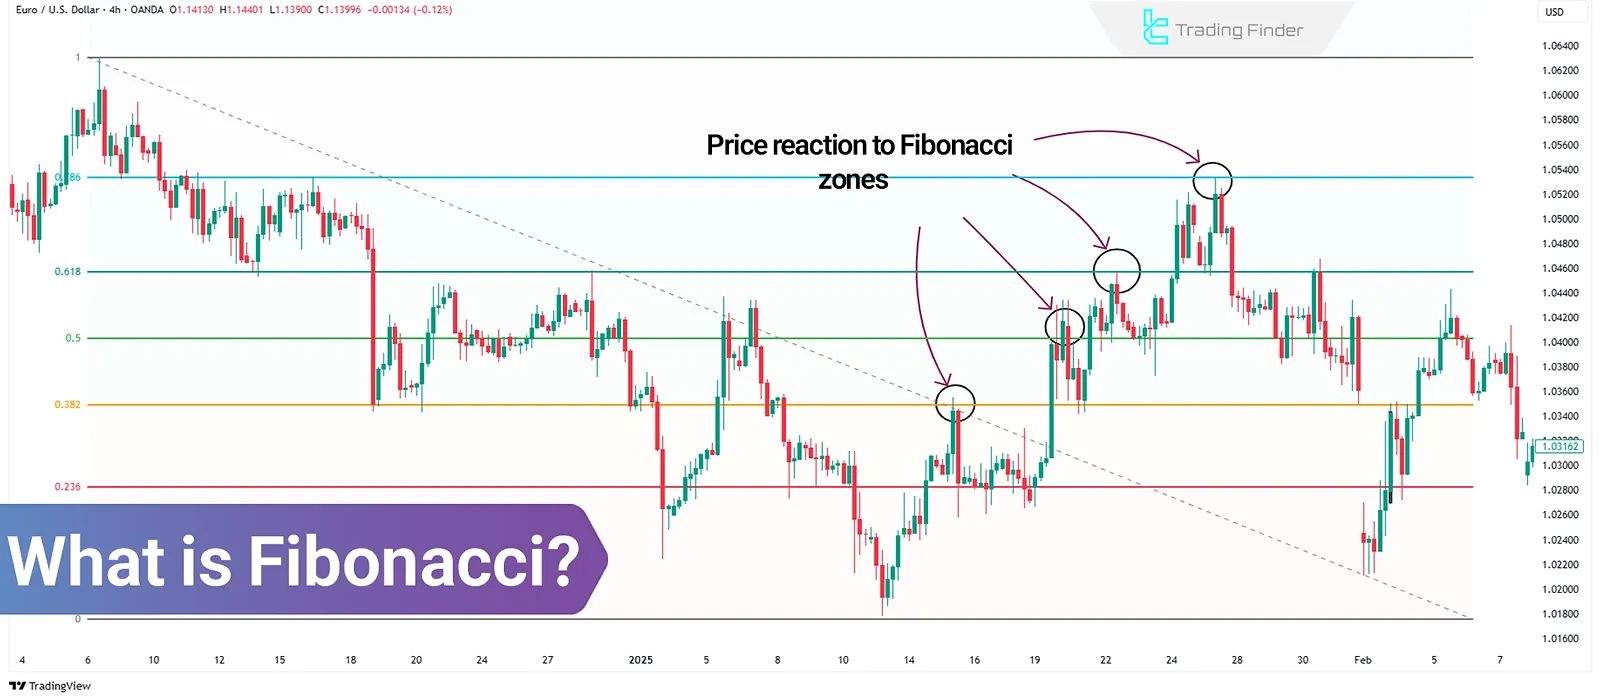
Fibonacci in Technical Analysis: Tools for Reversal & Continuation
In technical analysis of financial markets, Fibonacci ratios and levels are recognized as one of the oldest tools for...
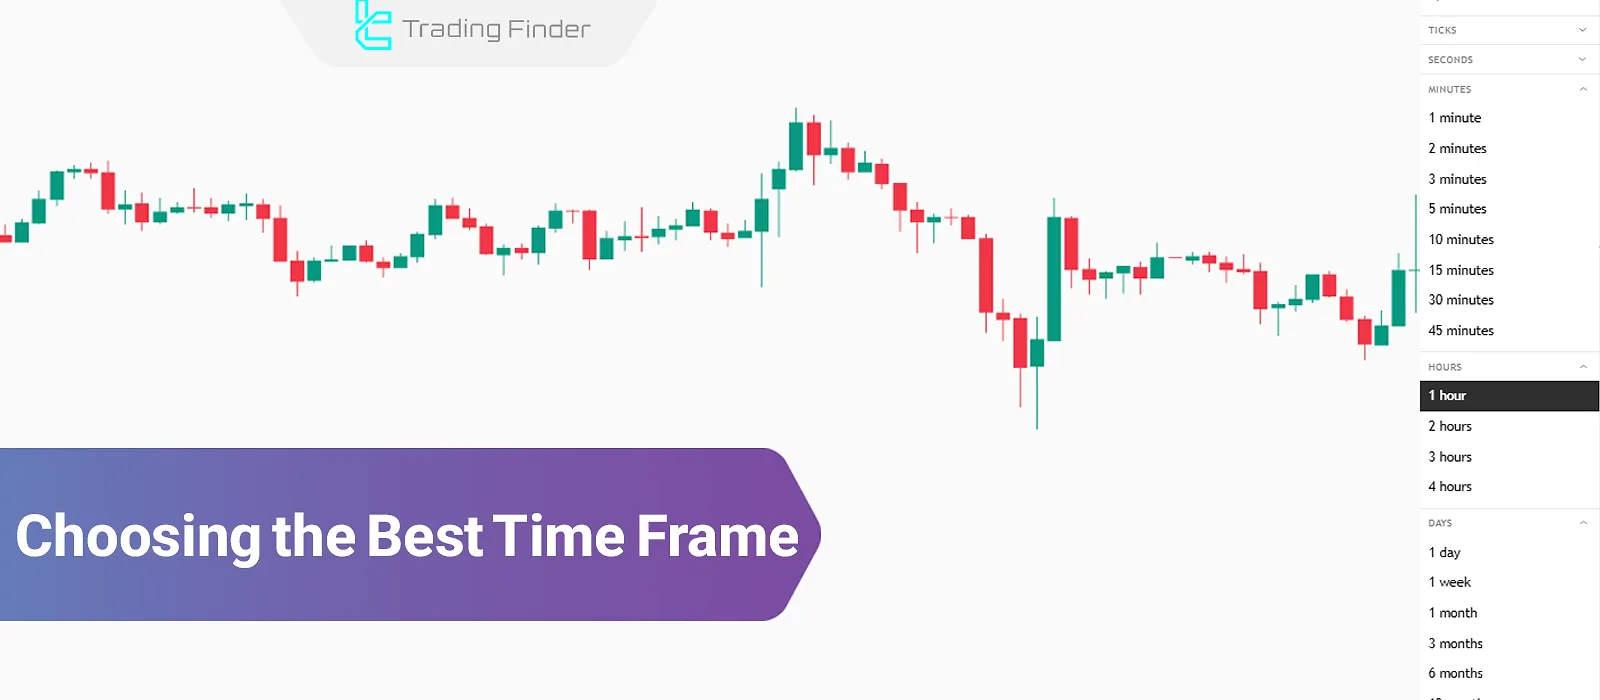
Choosing the Best Time Frame – Short, Medium, and Long-Term Strategy Time Frames
Selecting the best time frame for trading strategies depends on various factors such as analytical style and trading approach,...
![What is MACD? [Combining Exponential Moving Averages (EMA)]](https://cdn.tradingfinder.com/image/362923/03-19-tf-en-macd-01.webp)
What is MACD? [Combining Exponential Moving Averages (EMA)]
The MACD indicator (Moving Average Convergence Divergence) is a trend-following indicator used across all financial markets,...
![How to Use Bollinger Bands [Bollinger Bands] + Combining with MACD](https://cdn.tradingfinder.com/image/351105/06-02-en-how-to-use-bollinger-bands-01.webp)
How to Use Bollinger Bands [Bollinger Bands] + Combining with MACD
The Bollinger Bands indicator is a powerful technical analysis tool that uses a simple moving average to evaluate...
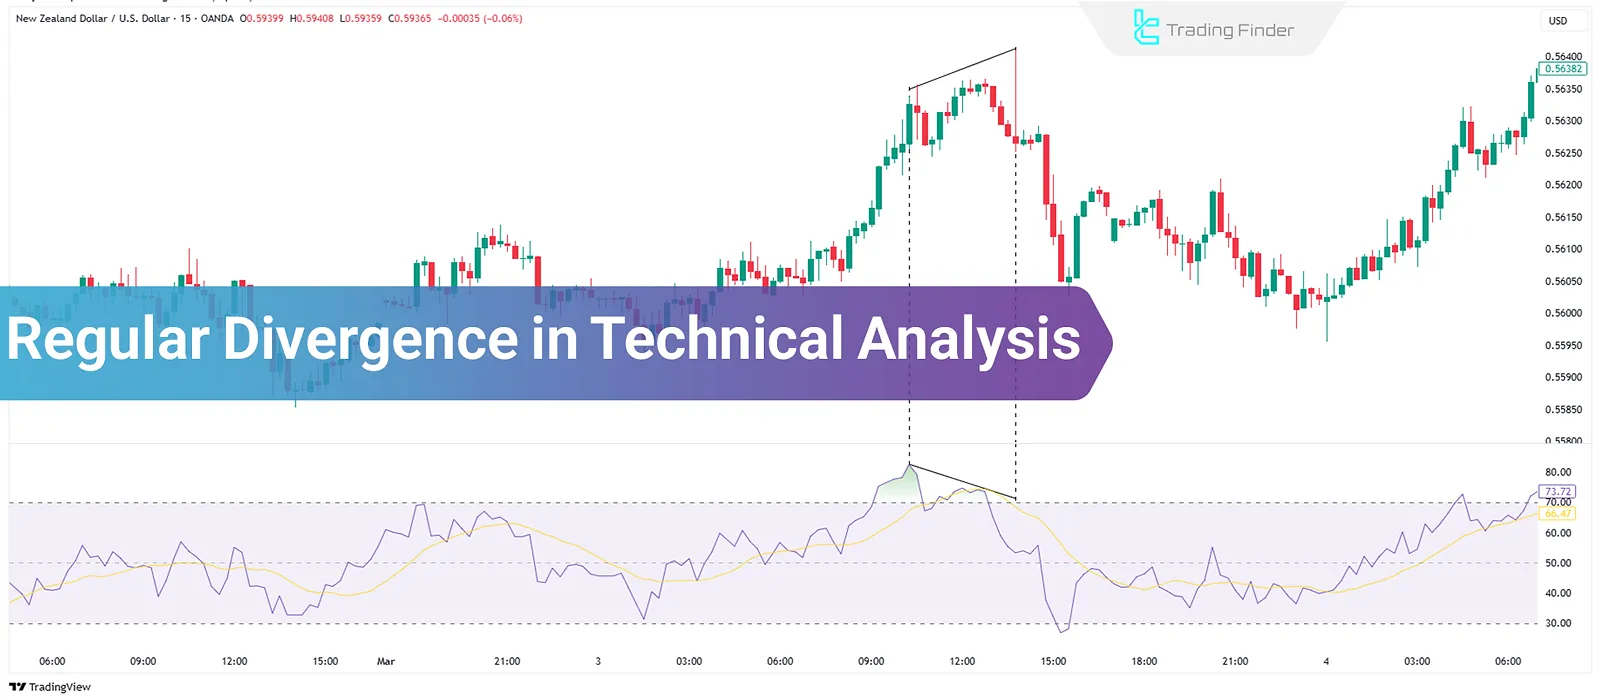
Regular Divergence in Technical Analysis; Bullish and Bearish Normal Divergence
Regular Divergence in technical analysis is one of the methods used to identify potential trend reversal points. This concept uses...
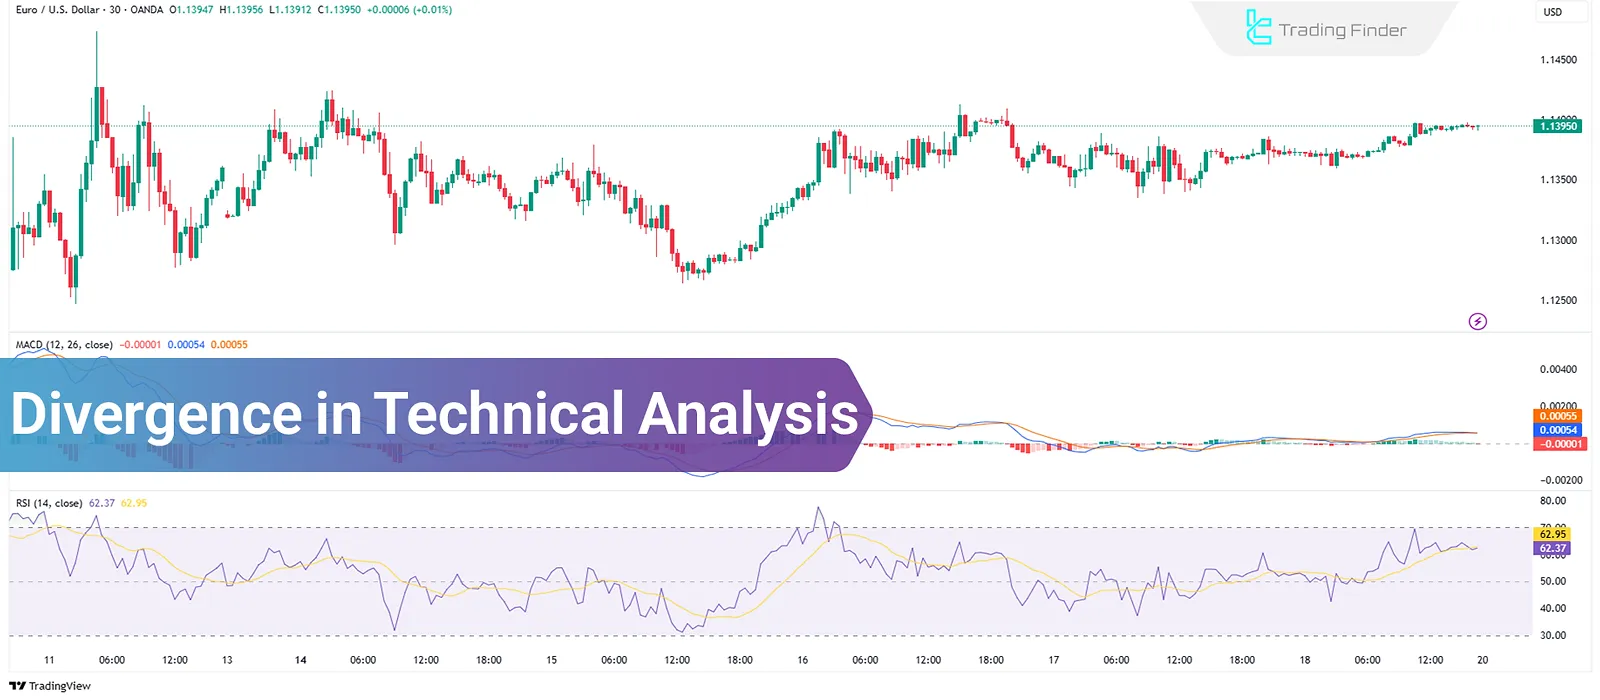
Trading with Divergence in Technical Analysis: Regular and Hidden Divergence
Divergence in technical analysis is a tool used to identify potential changes in price trends. It utilizes indicators to detect...
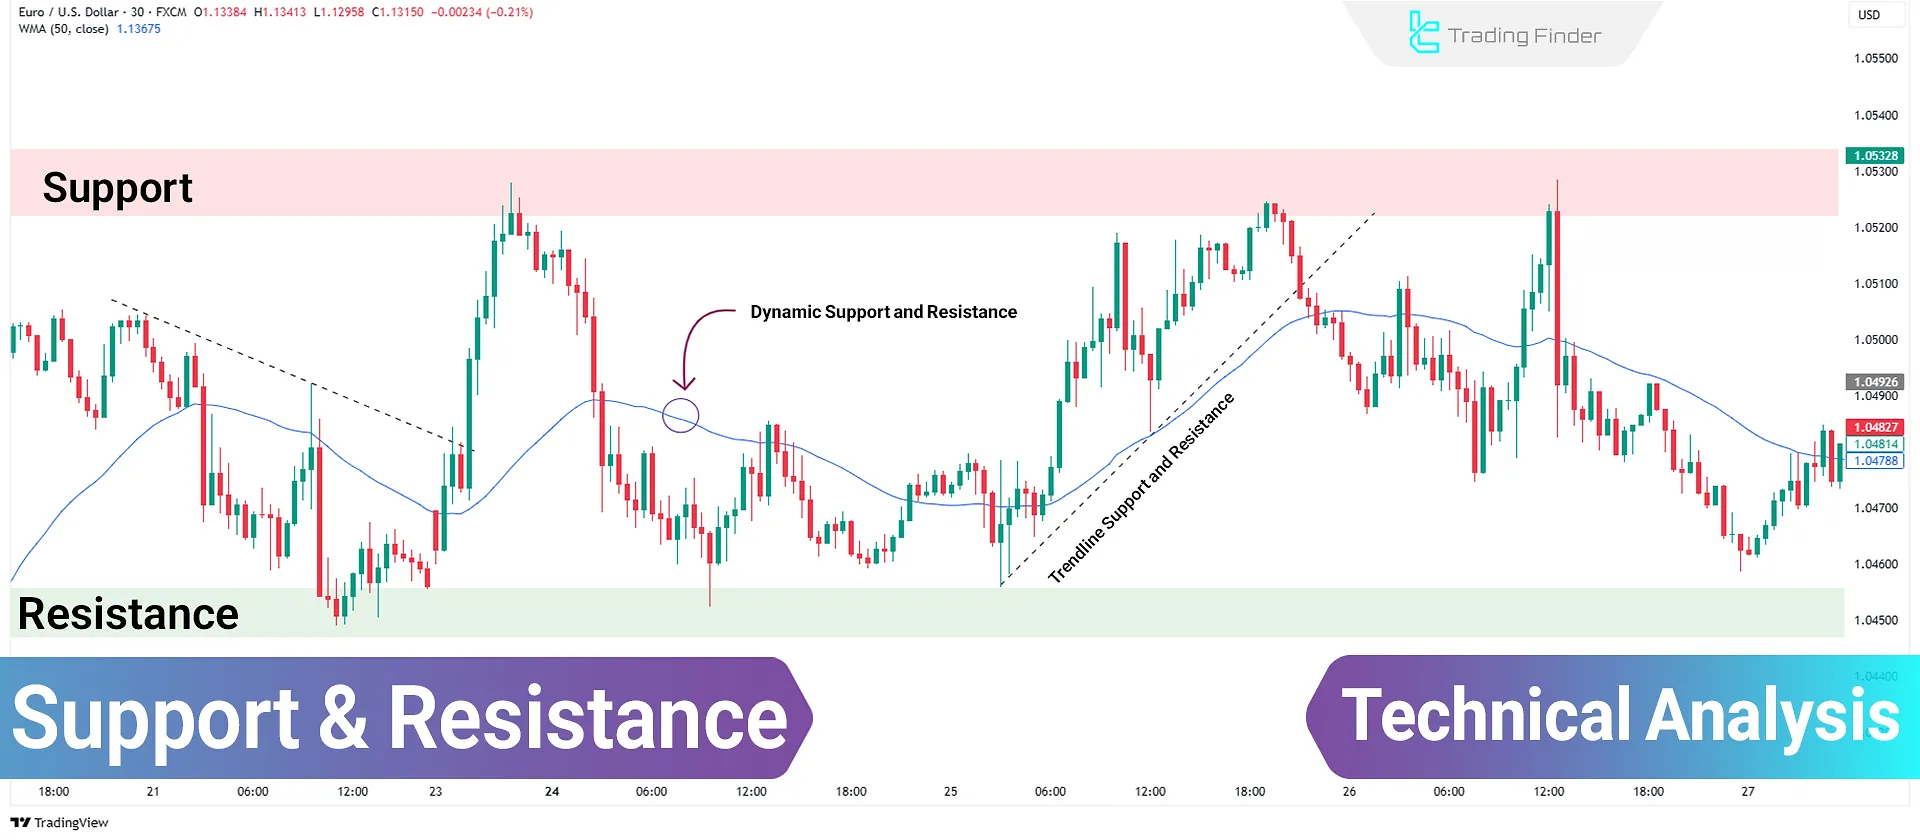
Support and Resistance Levels: Reversal Zones in Technical Analysis
Support and resistance are foundational concepts in technical analysis used in markets like Forex Market, stocks, Cryptocurrency, and...
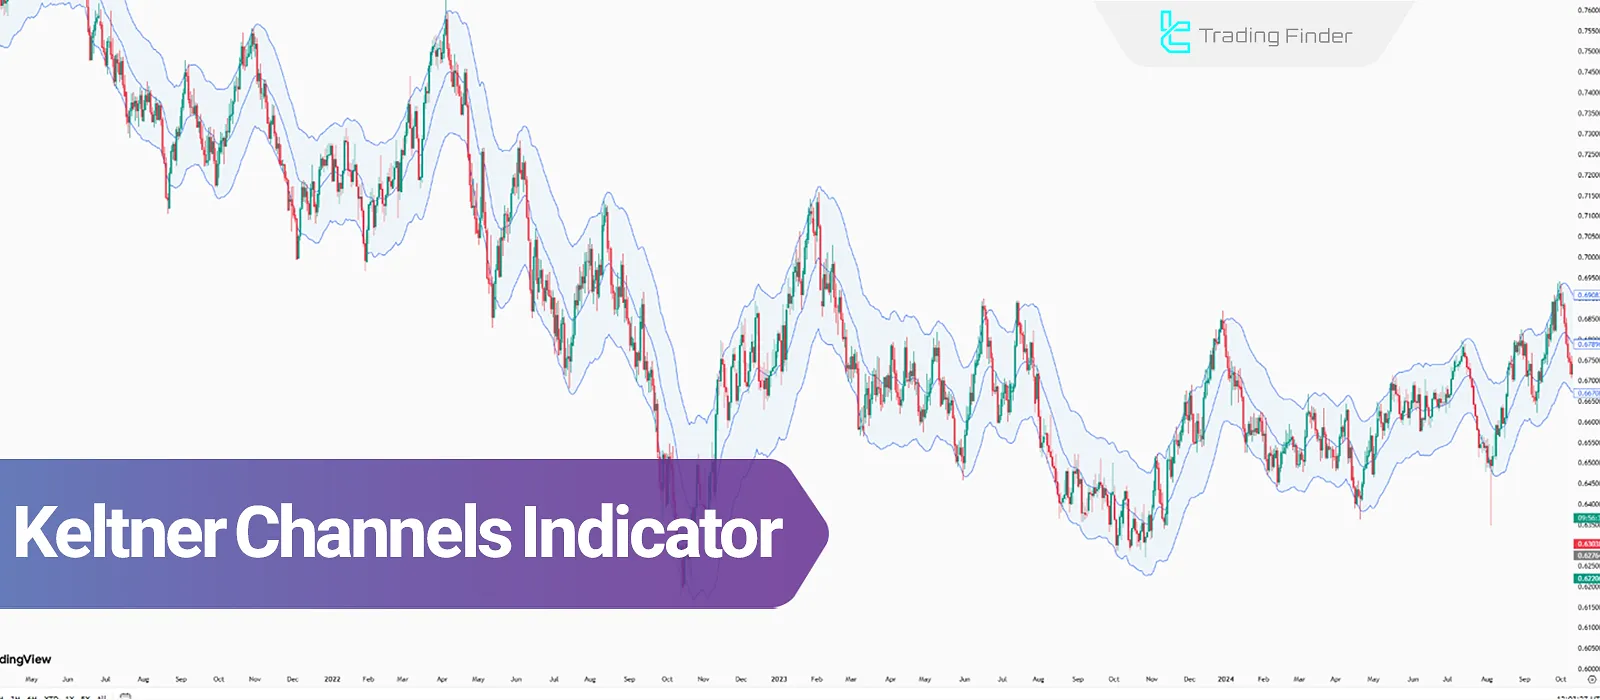
Keltner Channels Indicator – Identifying Uptrend & Downtrend with EMA and ATR
The Keltner Channels indicator is a technical analysis tool used to identify trends and price fluctuations. This indicator...
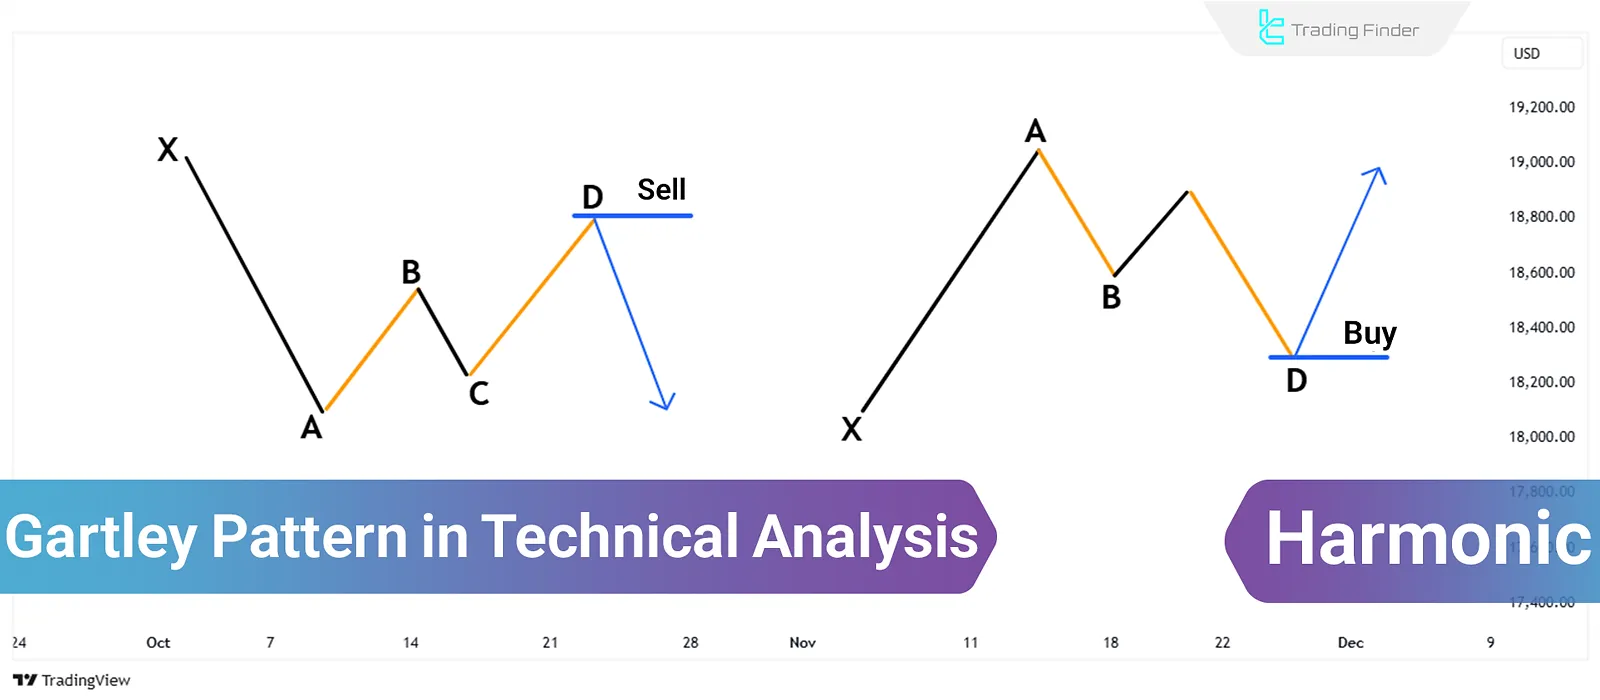
Gartley Harmonic Pattern; Four Price Movements Based on Fibonacci Ratios
The Gartley harmonic pattern in Forex Markets, introduced by Harold “McKinleyGartley”, identifies potential reversal points in...
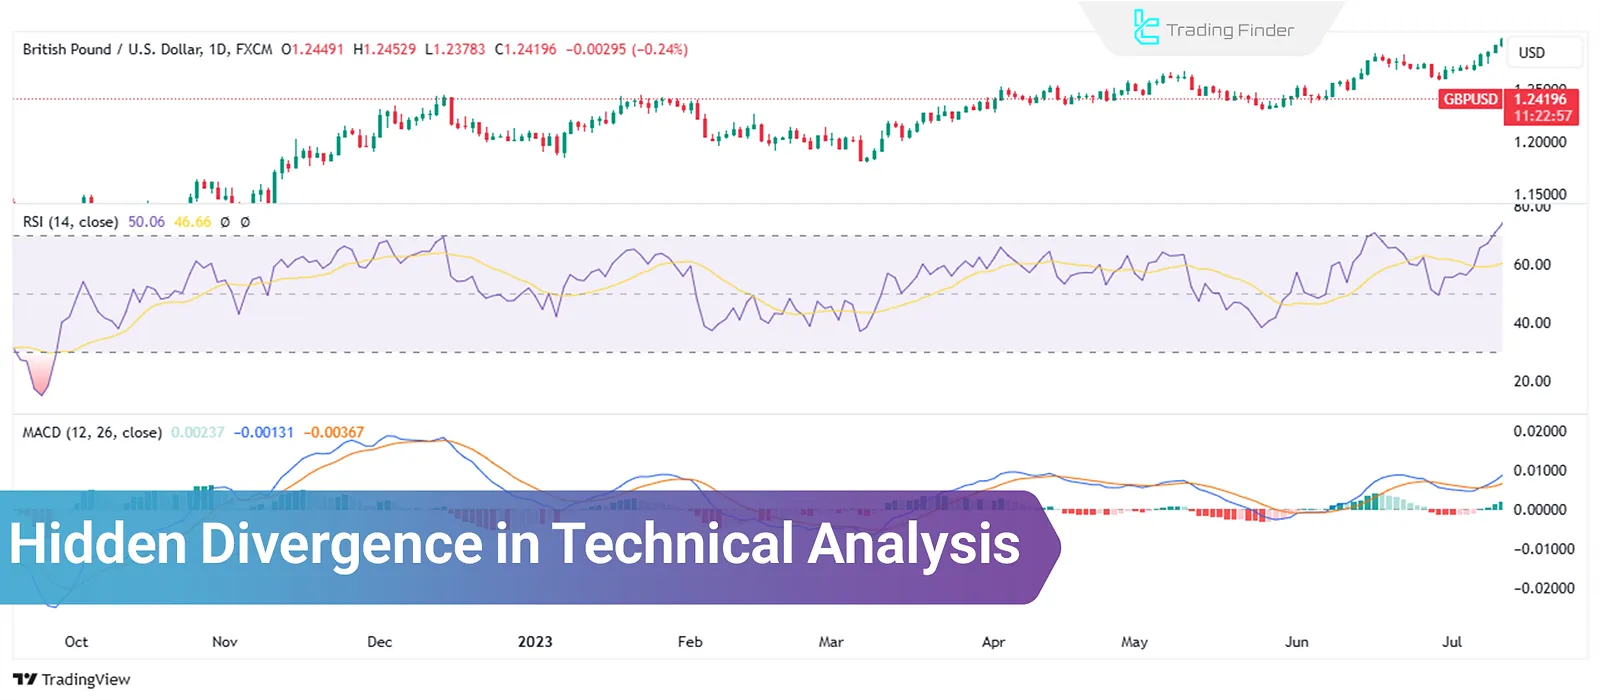
Trading with Hidden Divergence in Technical Analysis; Bullish and Bearish
Hidden divergence is a concept in technical analysis defined based on indicators. Traders use it to identify trend continuation....
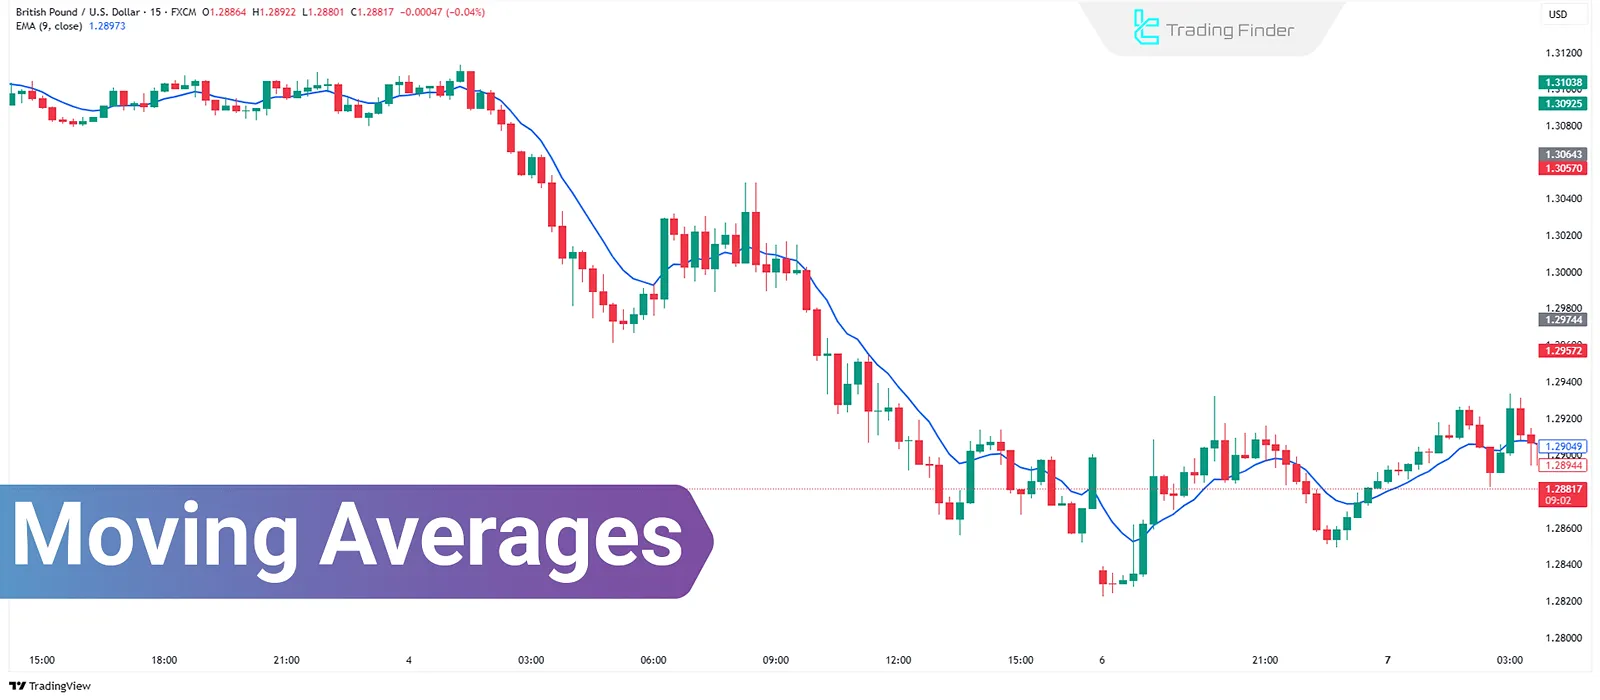
Moving Averages (MA) in Technical Analysis: Application in Trend Identification
The moving average in technical analysis, calculates the average price over a specified time period, enabling trend...
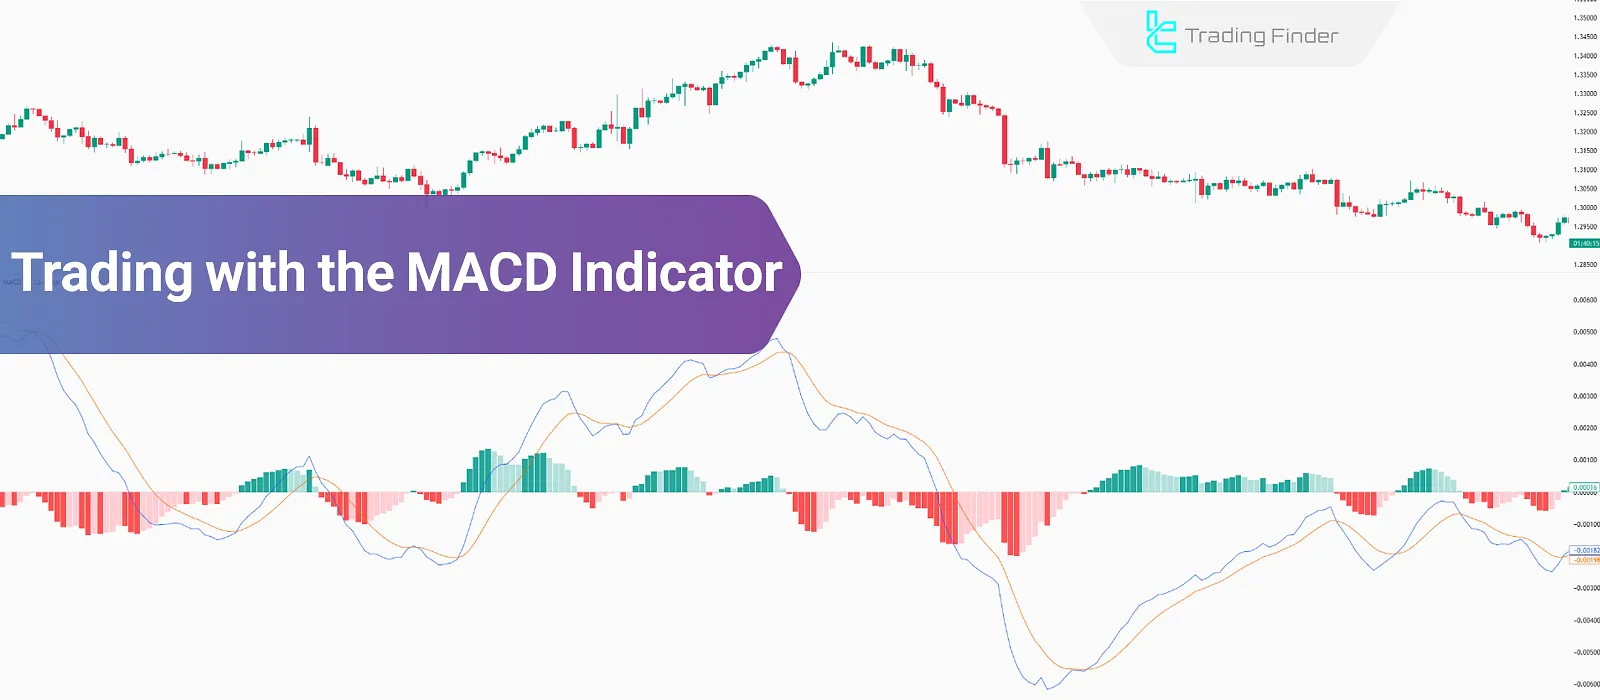
Trading with the MACD Indicator – 5 MACD Trading Strategies
MACD stands for “Moving Average Convergence Divergence”. This indicator utilizes moving averages, historical data, divergence and...