


The Exnova trading platform consists of over 10 segments that allow traders to set price alerts, change chart type [candlestick, bar, Heikin-Ashi, and lines], or use more than 20+ indicators to perform deep technical analysis.
The Exnova trading interface comes with a wide range of built-in indicators and oscillators. Popular options such as Bollinger Bands, RSI, MACD indicator, Stochastic, and Ichimoku Cloud indicator are included, giving traders the ability to perform in-depth technical analysis without external tools.
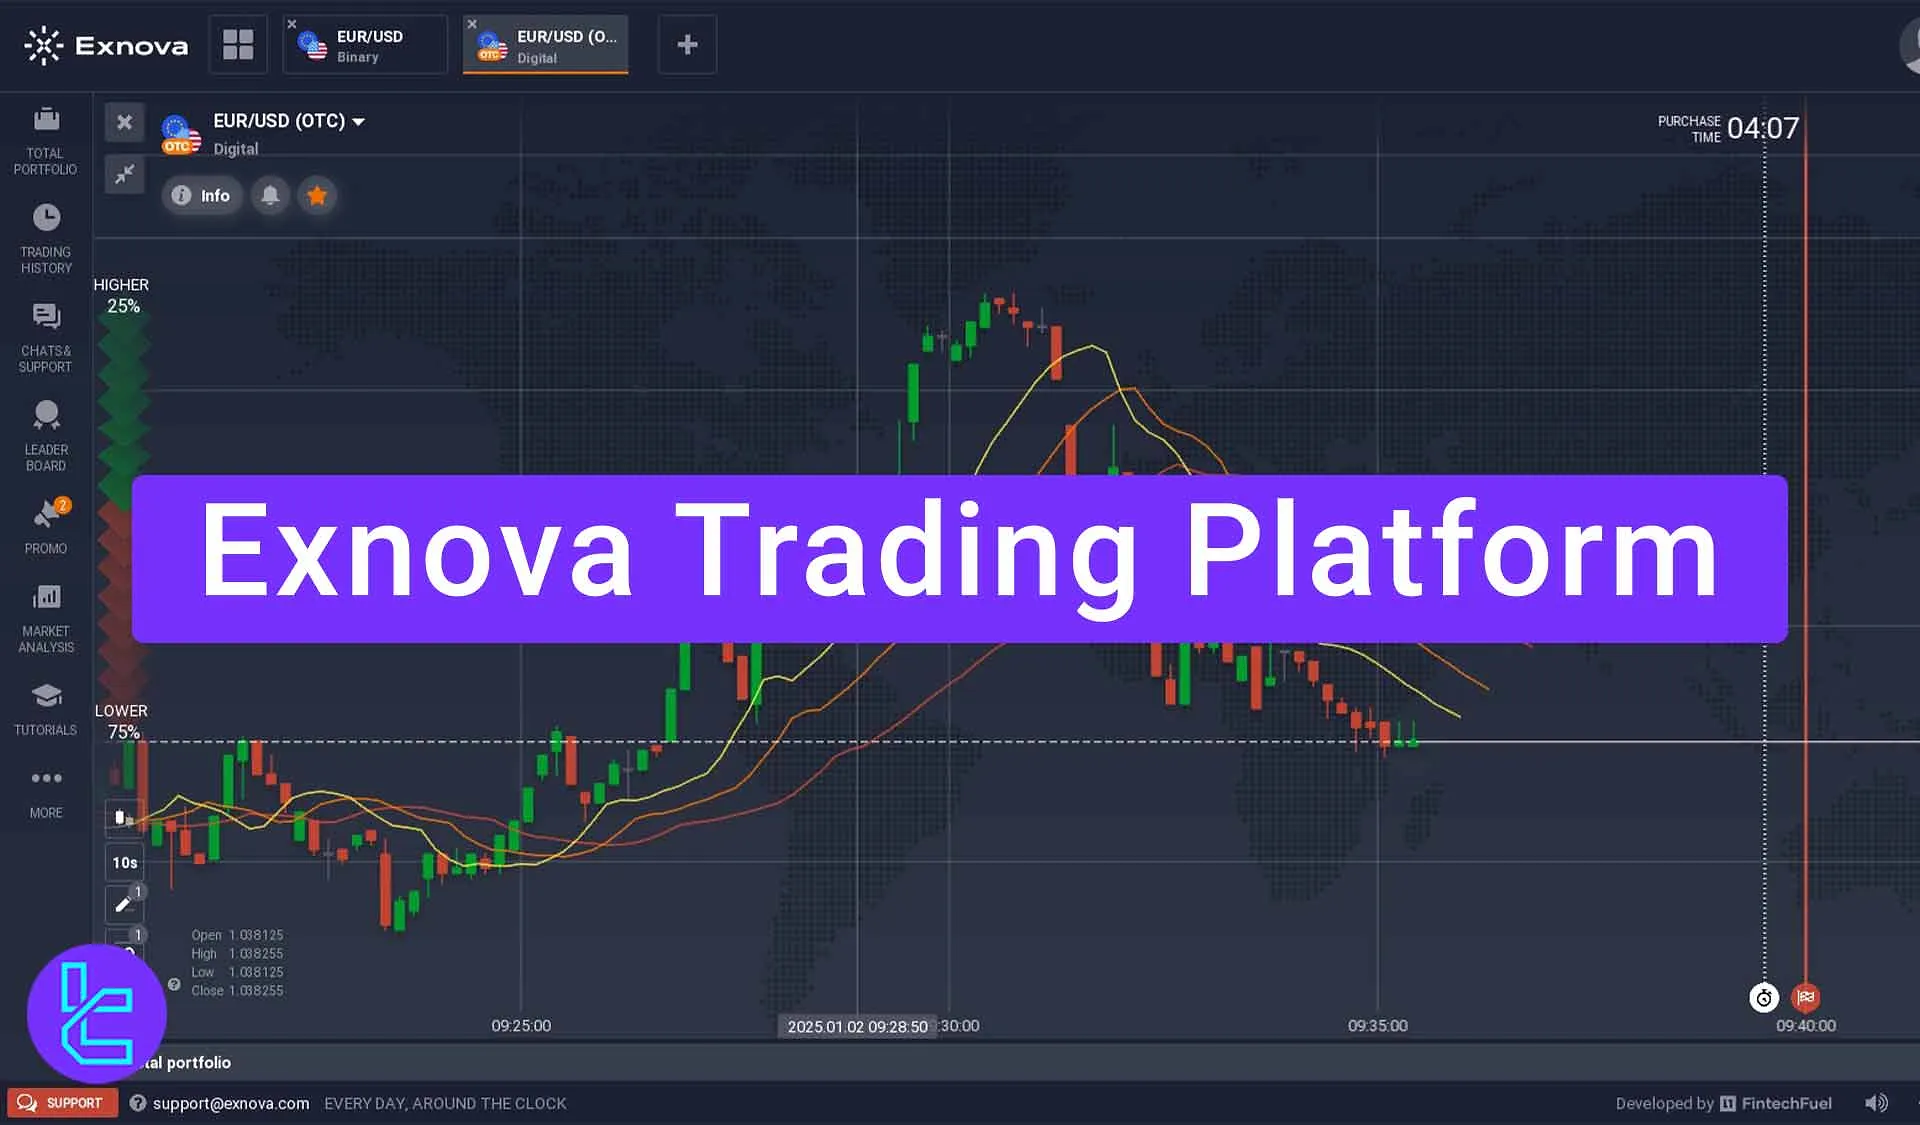
Exnova Platform Overview
Traders who complete Exnova registration need to familiarize themselves with its trading platform before trading binary options instruments.
We have divided this trading interface into multiple parts to explain important segments in detail.
ExnovaTrading Platform Overview:
- Trading panel
- Chart layouts
- Adding new instruments
- Trading symbol information
- Price alerts
- Trader sentiment
- Chart types
- Candle time period
- Drawing tools
- Indicators
- Timeframes
Trading panel
The trading panel is located on the right side of your screen. You can set your trade amount and expiration time to see the payout of your trade.
Then click on higher or lower to go long or short on the trading instrument.
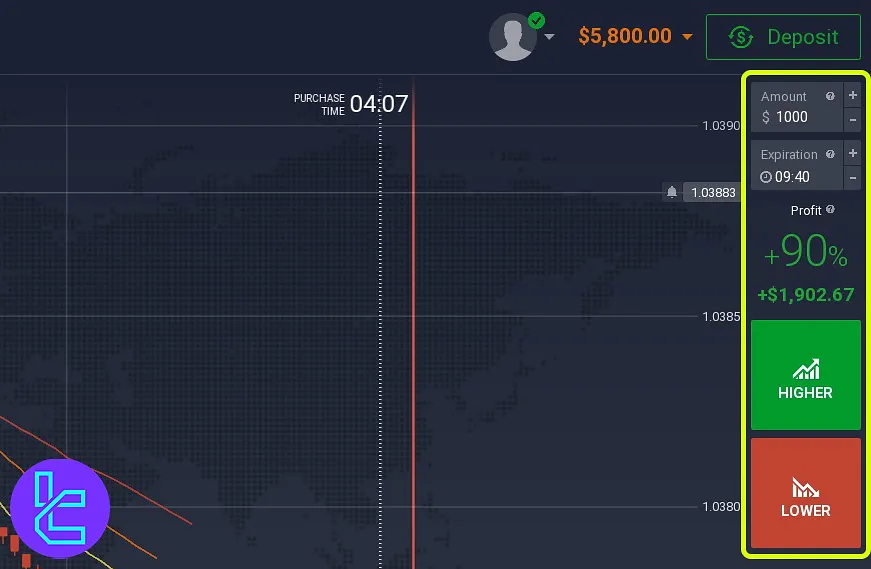
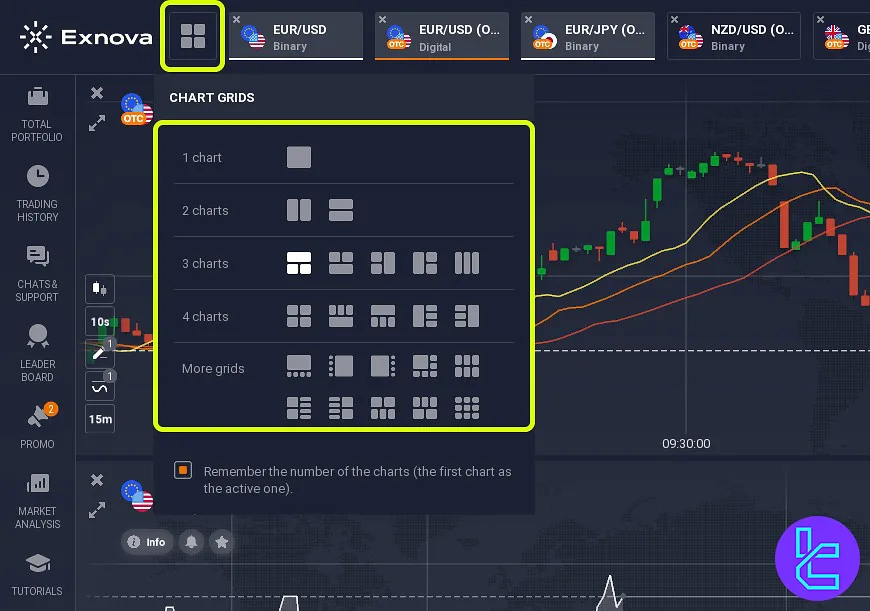
Chart layouts
You can change chart grids based on your preferences by clicking on the layout option in the top left corner.
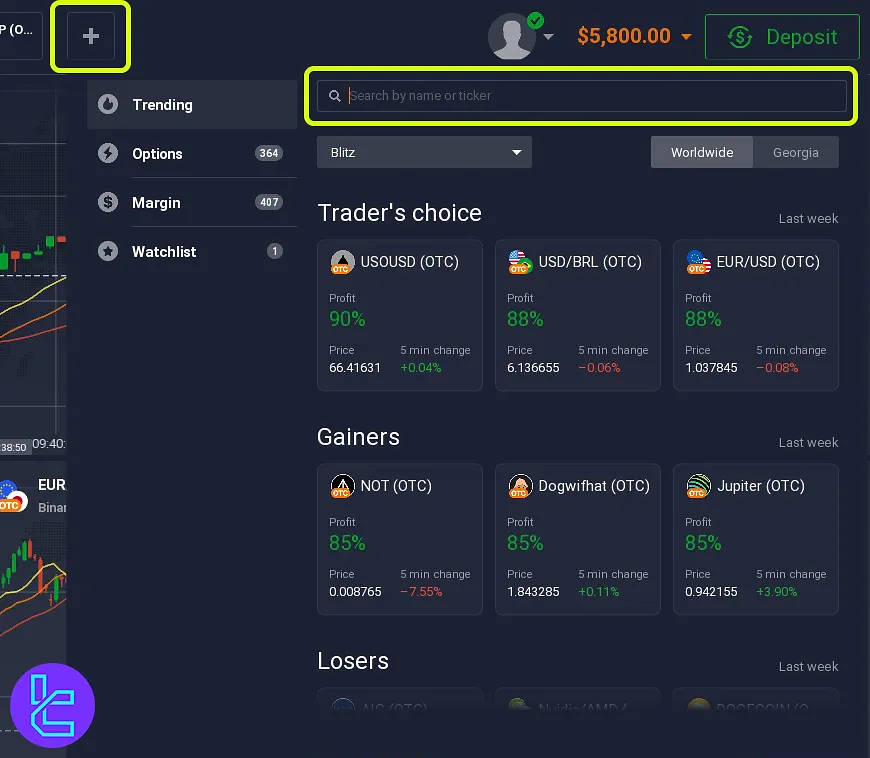
Adding New Instruments
To add new instruments, click the plus button on your screen's top bar. Then, Use the search bar to find the symbol’s name or ticker.
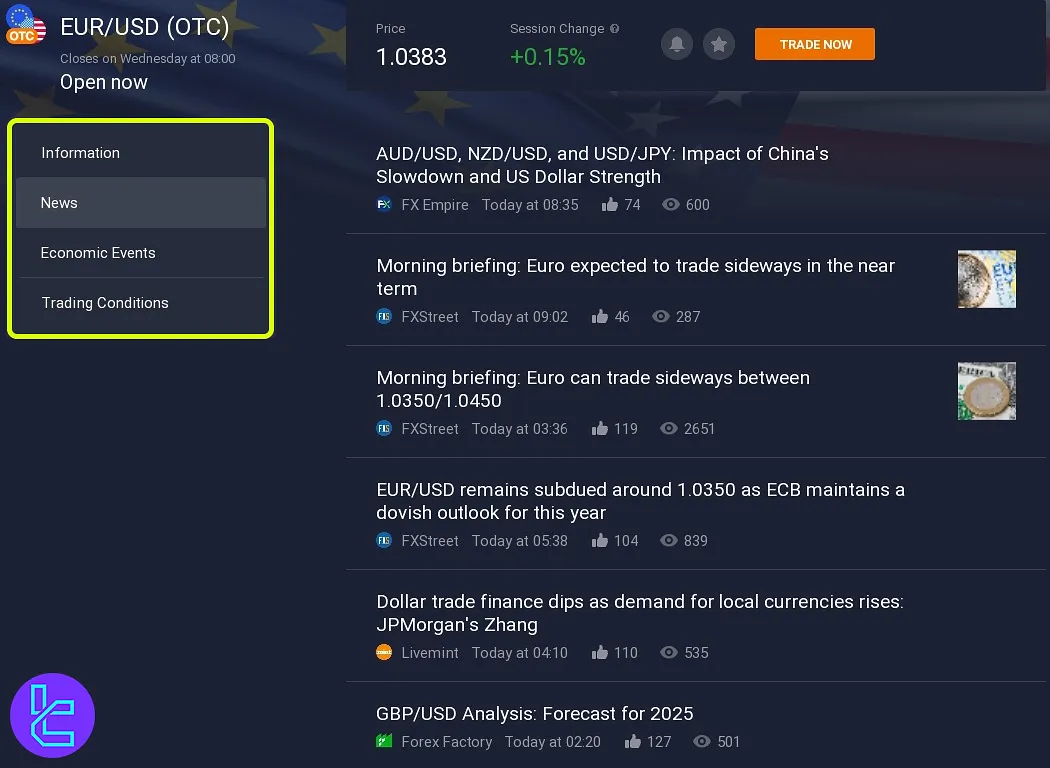
Trading Symbol Information
Use the information tab to access the latest news, economic events, and trading conditions for your chosen trading pair.
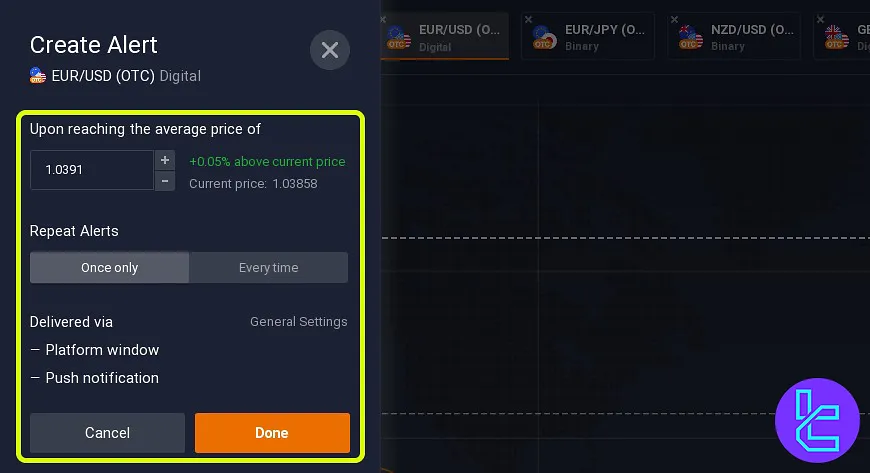
Price Alerts
Traders have the option to set price alerts and receive notifications via the platform window or push notifications.
Trader Sentiment
The Trader Sentiment shows how many traders expect the price to go up and how many believe its next move is toward lower prices.
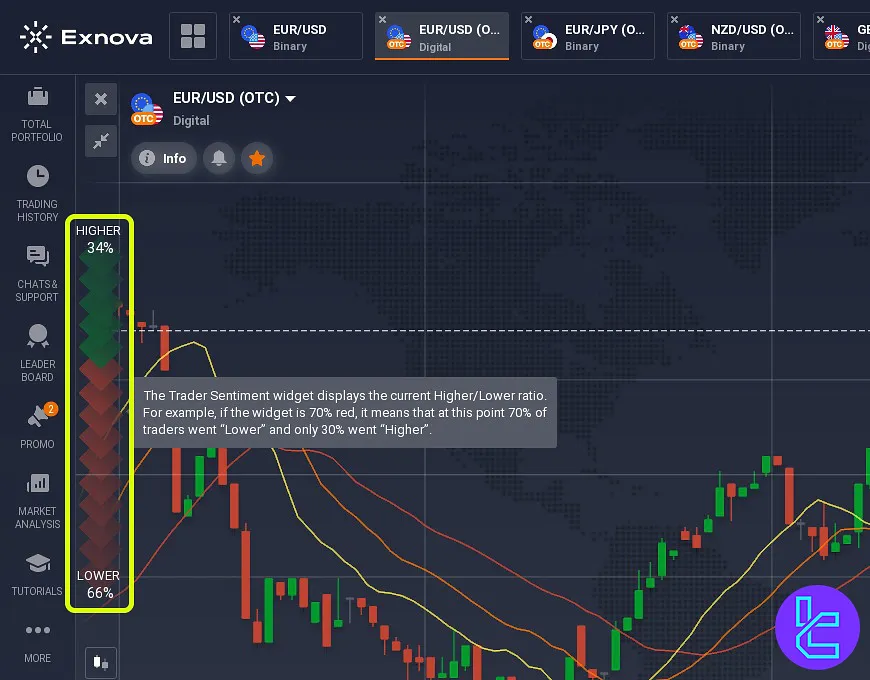
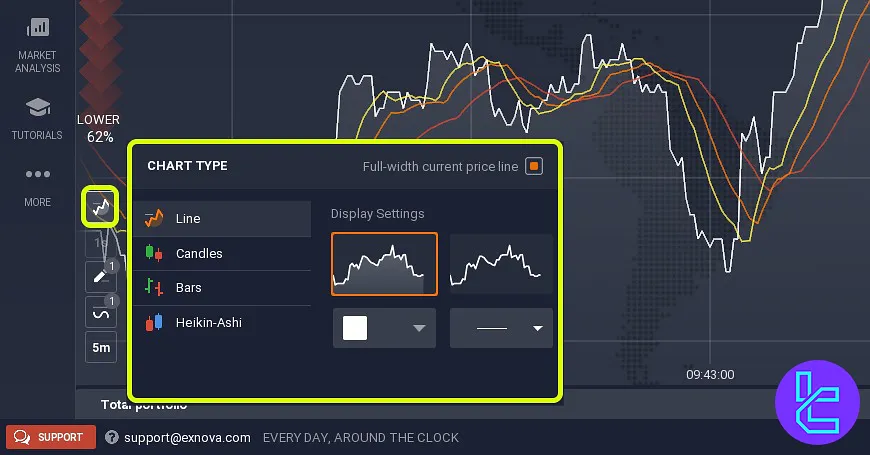
Chart Types
On the bottom left corner of the interface, traders can choose between line, candlestick, bar, and Heikin-Ashi chart types. Each chart can be customized to traders’ preferences.
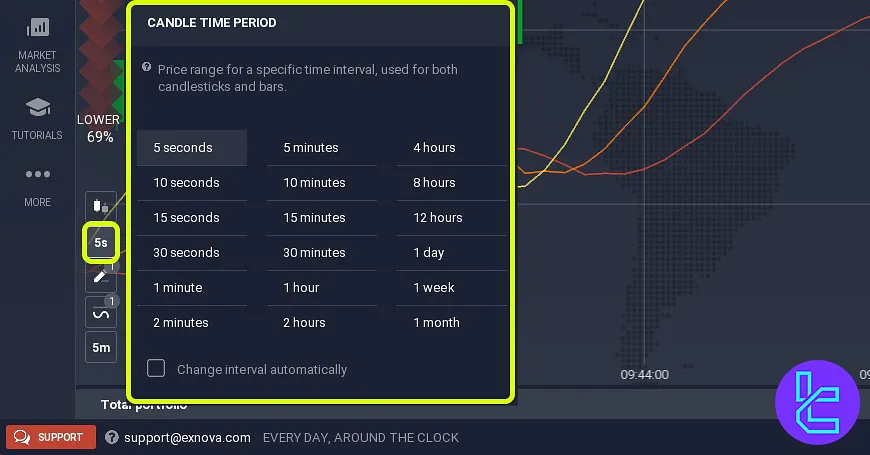
Candle Time Period
If you choose candlestick or bar chart types, you can set the candle time period from 5 seconds to 1 month.
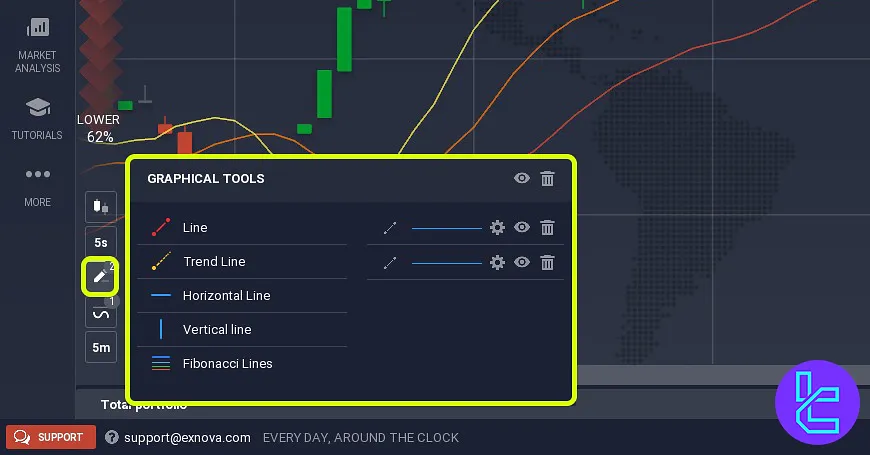
Drawing Tools
Traders can use the graphical tools section to draw trend, horizontal, or Fibonacci lines.
Indicators
Exnova provides a wide range of indicators and oscillators in various categories, including momentum, volume, trend, volatility, and more.
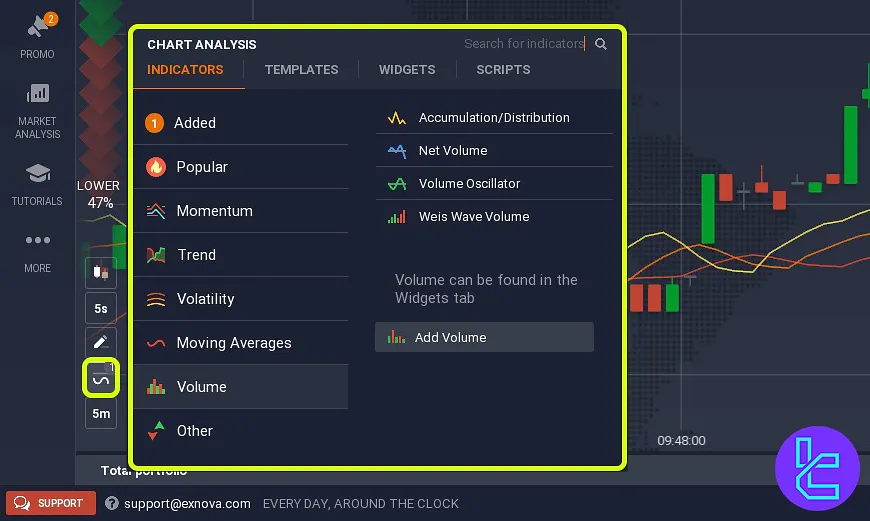
Here's a list of the indicators that you can use to perform technical analysis in Exnova Broker.
Indicator/oscillator | Available on Exnova Trading Platform |
Simple Moving Average | Yes |
Yes | |
Relative Strength Index | Yes |
Yes | |
Stochastic | Yes |
Parabolic SAR | Yes |
Commodity Channel Index | Yes |
Average True Range | Yes |
Average Directional Index | Yes |
Ichimoku Cloud | Yes |
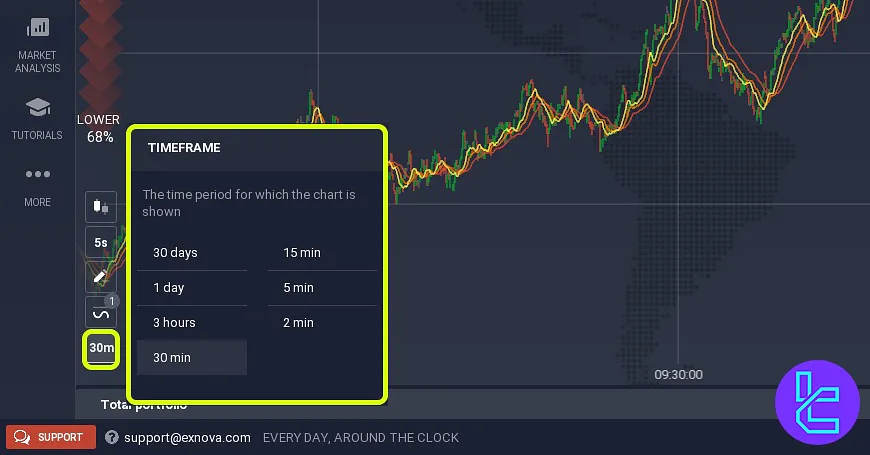
Timeframes
By choosing the option in the bottom left corner, traders can set the time period of the trading chart from 2 minutes to 30 days.
Detailed Comparison of the Trading Platform in Exnova and Other Binary Brokers
The table below compares the available options in the Exnova trading platform and other binary brokers.
Features | Exnova Broker | |||
Tradable Instruments | Forex, stocks, ETFs, cryptocurrencies, indices | Forex, stocks, cryptocurrencies, indices, commodities | Forex, Stocks, Indices, Cryptocurrencies, Commodities, ETFs | Forex, stocks, cryptocurrencies, indices, commodities, ETFs, Composites |
Chart Types | Line, Bar, Candlestick, Heikin-Ashi | Line, Bar, Candlestick, Heikin-Ashi | Area, Line, Candle Sticks, Bars | Area Chart, Bar, Candlestick, Heikin-Ashi |
Time Frames | 1 Hour to 30 days | From 5 Seconds to 30 Days | From 5 Seconds to 30 Days | From 5 Seconds to 30 Days |
Supported Indicators | SMA, RSI, Bollinger Bands, etc. | Alligator, EMA, Zig Zag, etc. | RSI, Ichimoku Cloud, SMA, etc. | WMA, Donchian Channel, SMA, etc. |
Number of Indicators | Up to 20 | Up to 30 | Up to 20 | Up to 30 |
Supported drawing tools | Trend Lines, GANN Chart, Fibonacci, etc | Fibonacci retracement, Trend Lines, Ray, etc. | Fibonacci, Ray, Triangles, Squares, … | Trend Lines, Horizontal lines, Fibonacii, etc. |
Trader Sentiment Chart | Yes | Yes | No | No |
Multi-Chart Display | Yes | Yes | No | Yes |
Trade History | Yes | Yes | Yes | Yes |
AI Trading | No | No | No | No |
TF Expert Suggestion
The Exnova trading platform is a comprehensive trading hub with 23 chart layouts, various timeframes ranging from 2 minutes to 1 month, and over 250 tradable instruments.
However, compared to other binary options brokers, the number of available drawing tools (only 5) is limited.
After familiarizing yourself with the Exnova broker's platform, the next step in trading with it is funding your account. To fund your account, use the methods mentioned in the Exnova deposit and withdrawal article on the Exnova tutorial page.


