![ACD Indicator for MetaTrader 4 Download - Free - [TF Lab]](https://cdn.tradingfinder.com/image/104886/10-13-en-acd-mt4.webp)
![ACD Indicator for MetaTrader 4 Download - Free - [TF Lab] 0](https://cdn.tradingfinder.com/image/104886/10-13-en-acd-mt4.webp)
![ACD Indicator for MetaTrader 4 Download - Free - [TF Lab] 1](https://cdn.tradingfinder.com/image/2385/10-13-en-acd-indicator-mt4-02.avif)
![ACD Indicator for MetaTrader 4 Download - Free - [TF Lab] 2](https://cdn.tradingfinder.com/image/2388/10-13-en-acd-indicator-mt4-03.avif)
![ACD Indicator for MetaTrader 4 Download - Free - [TF Lab] 3](https://cdn.tradingfinder.com/image/2389/10-13-en-acd-indicator-mt4-04.avif)
The ACD indicator, developed by Mark Fisher, is a technical analysis tool in MetaTrader 4 that is used to identify potential trends and measure the strength of market trends.
TheACD system is based on identifying the market's Opening Range (OR) and using it to determine key trading levels. The opening range is usually the first 30 minutes to one hour of trading.
After deciding on theOR, traders can identify points A and C derived from the OR and make trading decisions. These levels are above or below the OR, which the market must reach for a potential trend to break.
Indicator Table
Indicator Categories: | Price Action MT4 Indicators Supply & Demand MT4 Indicators Levels MT4 Indicators |
Platforms: | MetaTrader 4 Indicators |
Trading Skills: | Intermediate |
Indicator Types: | Range MT4 Indicators Breakout MT4 Indicators |
Timeframe: | M1-M5 Time MT4 Indicators M15-M30 Time MT4 Indicators |
Trading Style: | Day Trading MT4 Indicators Scalper MT4 Indicators |
Trading Instruments: | Commodity Market MT4 Indicators Stock Market MT4 Indicators Forex MT4 Indicators |
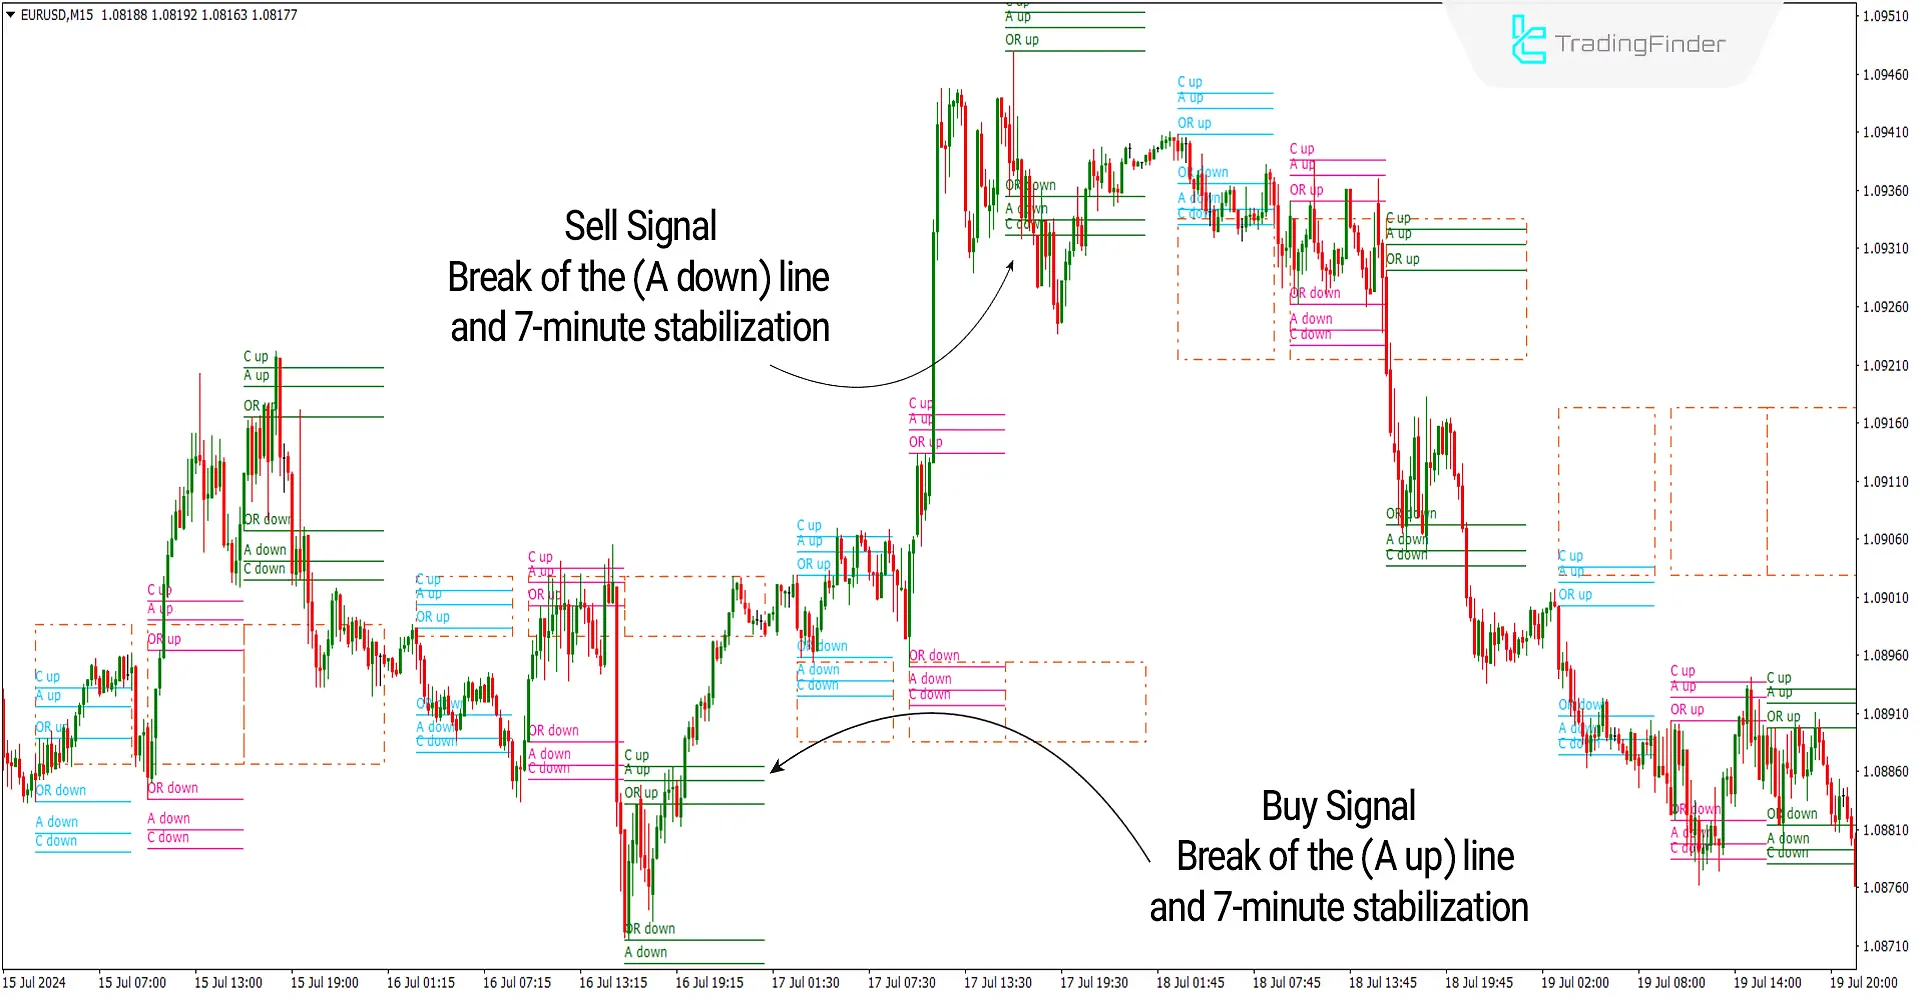
In the image below, the price chart of the EURUSD currency pair is shown in a 15-minute time frame. A buy signal is initially issued when the price moves above the A up level and stabilizes for 7 minutes, indicating the start of an uptrend and entry into a buy trade.
A sell signal is also issued when the price breaks below the A down level and stabilizes below it for 7 minutes, indicating the start of a downtrend and entry into a sell trade.

Overview
The ACD trading strategy is a breakout strategy that performs best in volatile or strongly trending markets, such as crude oil (Brent) and stocks. If the price is above the Pivots, the trend is bullish; if it is below the Pivots and MT4 levels indicator , the trend is bearish.
The ACD strategy is a technical tool used to measure the balance between Supply and Demand in the market. By analyzing the volume and price of trades, this indicator helps traders identify the trend's strength and suitable entry and exit points.
Bullish Signal Conditions of the Indicator (Bullish Setup)
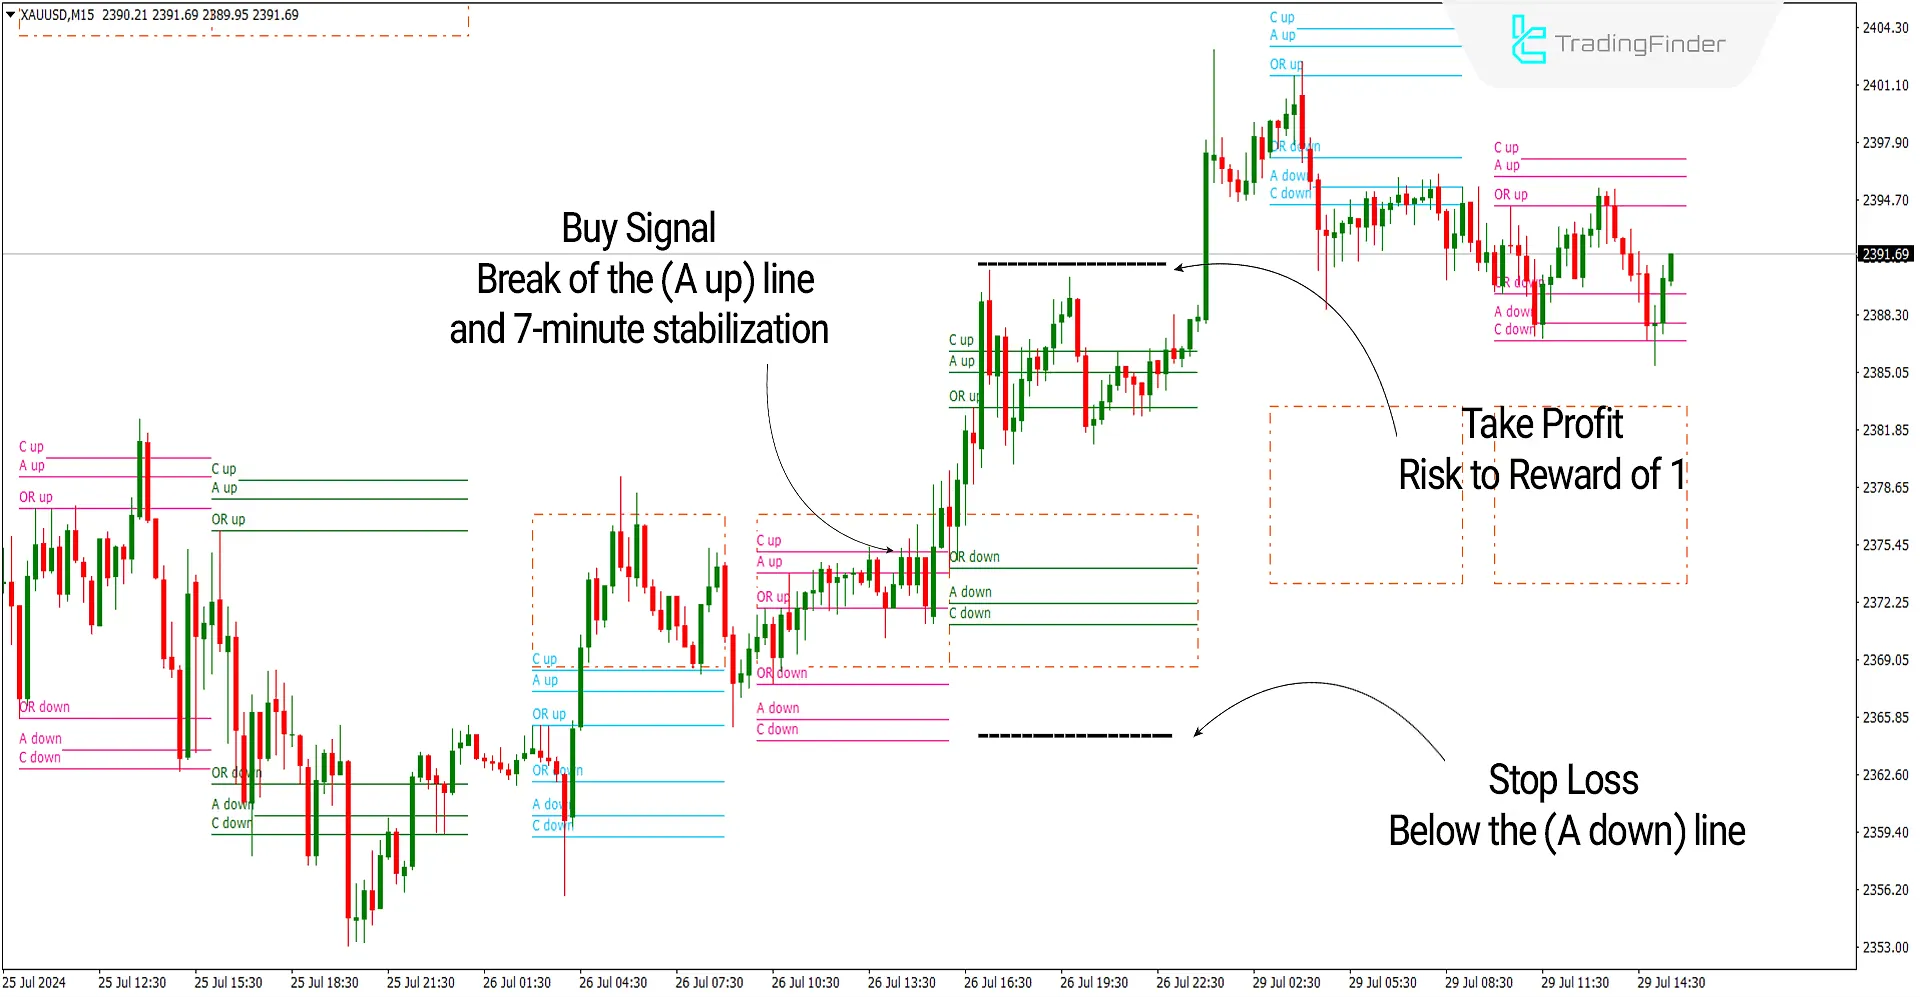
In the image below, the price chart of Gold (XAUUSD) is shown in a 15 minute time frame. When the A up line is broken, it is recommended to wait for a while to ensure it is not a Fake Breakout and the price stabilizes above this line.
Eventually, the price should stabilize on the A up level for 7 minutes, after which you can enter a buy position.
Take Profit and Stop Loss for Buy Trades of the ACD Indicator
After entering the trade, the best stop loss you can choose is below the A down line. The appropriate Reward to Risk ratio for this strategy is 1, which you can use to set your take profit.

Bearish Signal Conditions of the Indicator (Bearish Setup)
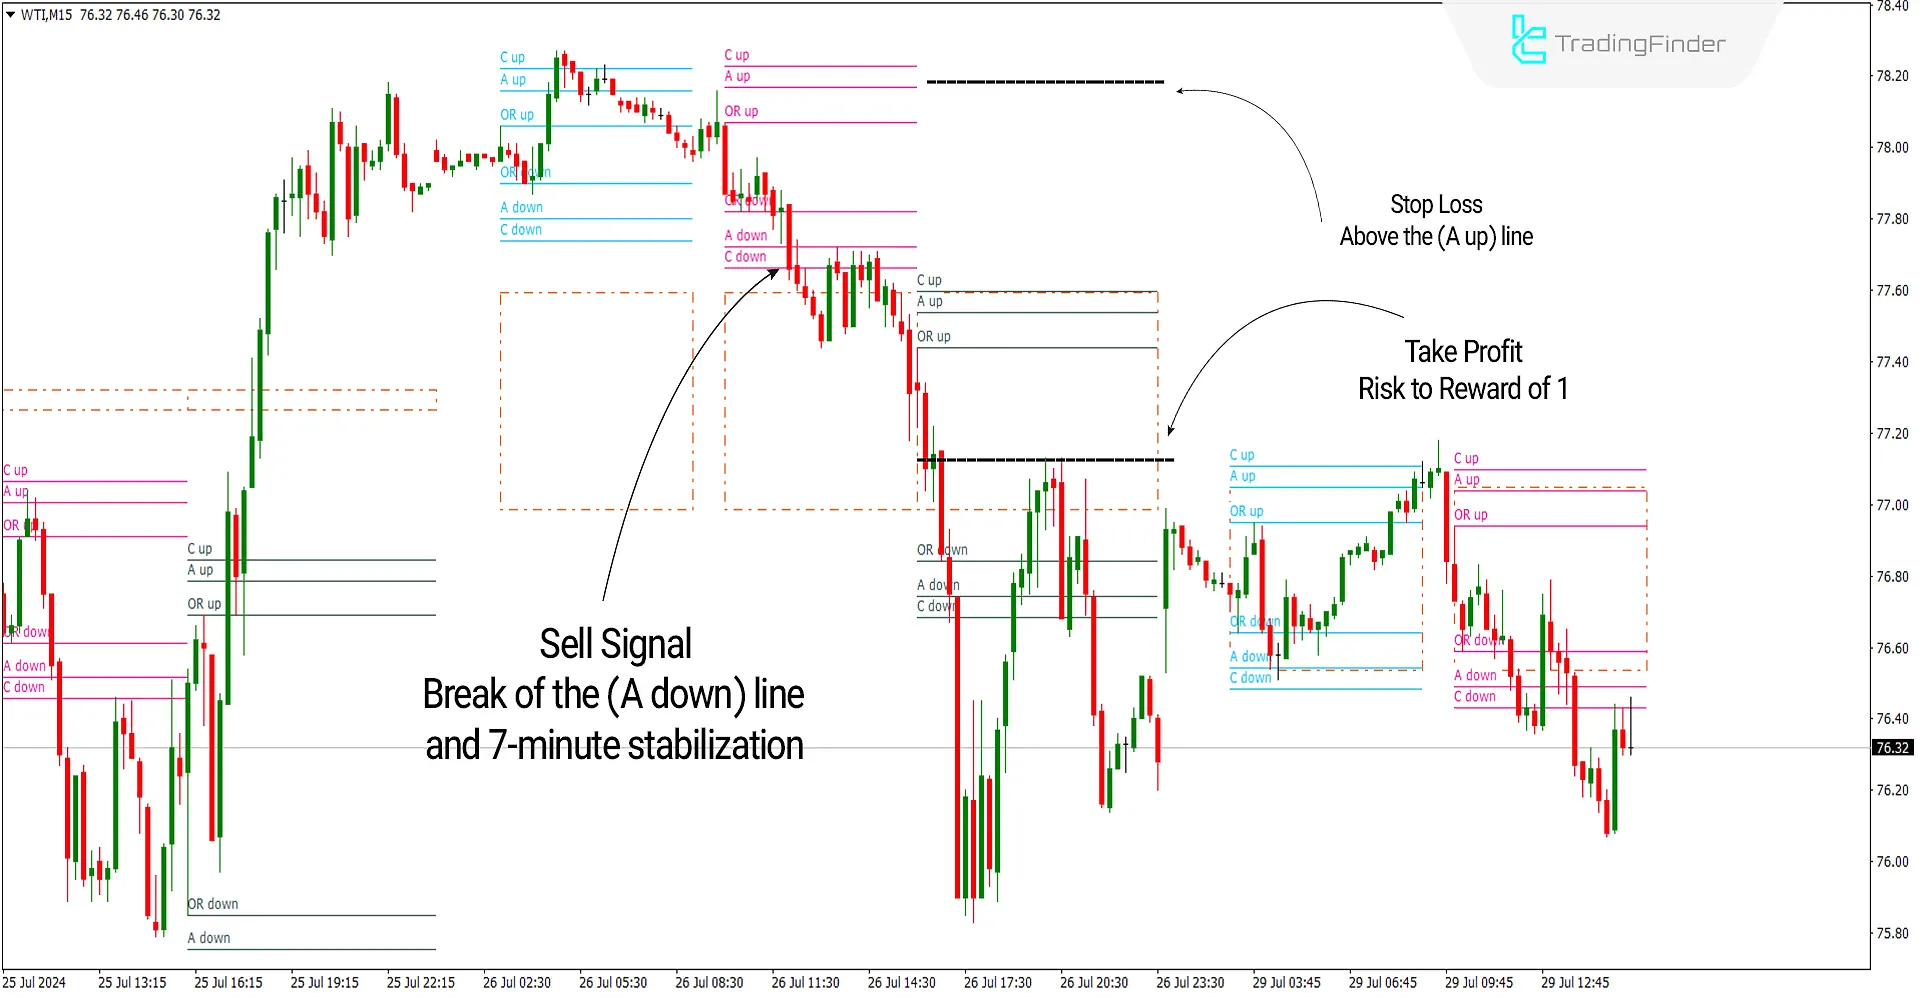
In the image below, the price chart of Texas Oil (WTI) is shown in a 30-minute time frame. When the A down line is broken, it is recommended to wait for a while to ensure it is not a Fake Breakout and the price stabilizes below this line.
Eventually, the price should stabilize below the A down level for 7 minutes, after which you can enter a sell position.
Take Profit and Stop Loss for Sell Trades of the ACD Indicator
After entering the trade, the best stop loss you can choose is above the A up line. The appropriate Reward to Risk ratio for this strategy is 1, which you can use to set your take profit.

ACD Indicator Settings

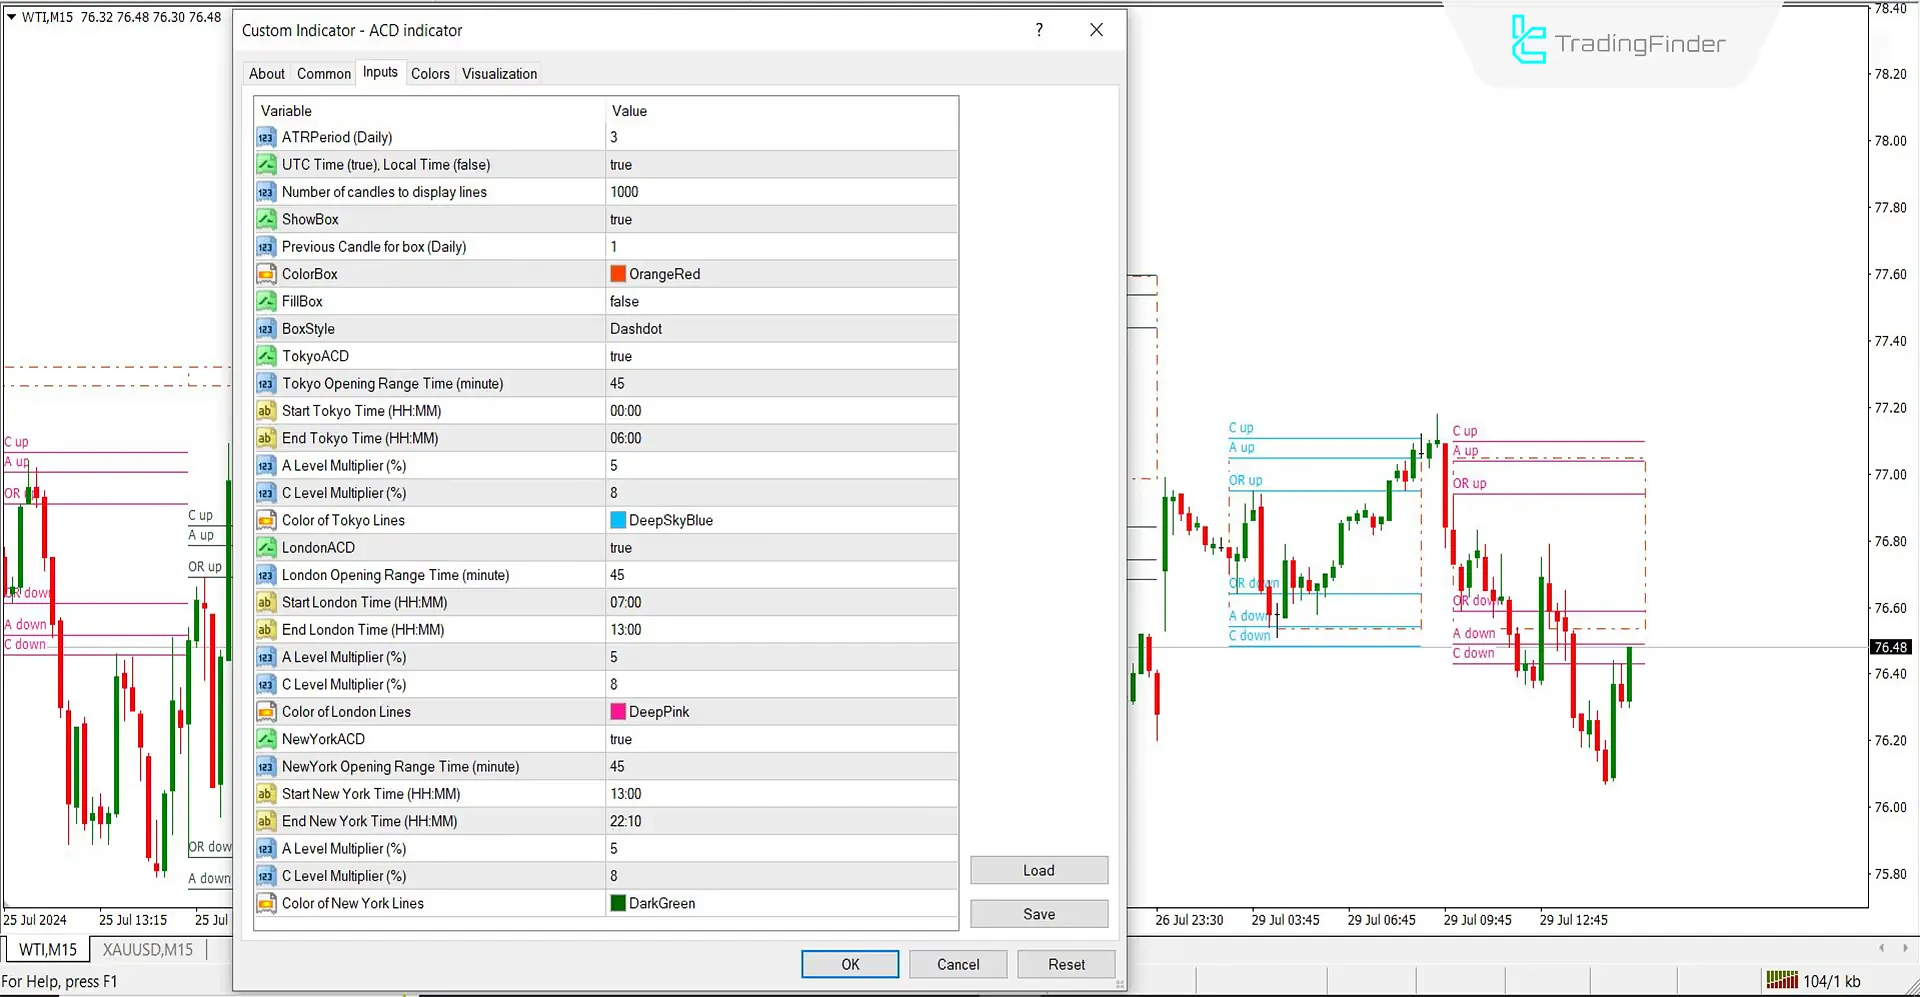
- ATR Period (Daily): Default value for calculations in the daily time frame is 3
- UTC Time (true) Local Time (false): Set TRUE to consider UTC time
- Number of candles to display lines: Considers 1000 candles back for calculations
- ShowBox: Set to True
- Previous Candle for box (Daily): Considers the previous daily candle for calculations
- ColorBox: OrangeRed color displayed on the chart
- FillBox: Set to false for a hollow box
- BoxStyle: Set to Dashdot
- TokyoACD: Set to True
- Tokyo Opening Range Time (minute): Consider High and Low in the first 45 minutes of the Tokyo session
- Start Tokyo Time (HH): Start of the Tokyo session is at 00:00
- End Tokyo Time (HH): End of the Tokyo session is at 06:00
- A Level Multiplier (%): The percentage distance of the A lines is 5
- C Level Multiplier (%): The percentage distance of the C lines is 8
- Color of Tokyo Lines: Tokyo session color is blue or as desired
- LondonACD: Set to True
- London Opening Range Time (minute): Consider High and Low in the first 45 minutes of the London session
- Start London Time (HH): Start of the London session is at 07:00
- End London Time (HH): End of the London session is at 13:00
- A Level Multiplier (%): The percentage distance of the A lines is 5
- C Level Multiplier (%): The percentage distance of the C lines is 8
- Color of London Lines: London session color is pink or as desired
- NewYorkACD: Set to True
- New York Opening Range Time (minute): Consider High and Low in the first 45 minutes of the New York session
- Start New York Time (HH): Start of the New York session is at 13:00
- End New York Time (HH): End of the New York session is at 22:10
- A Level Multiplier (%): The percentage distance of the A lines is 5
- C Level Multiplier (%): The percentage distance of the C lines is 8
- Color of New York Lines: New York session color is yellow or as desired
Conclusion
The ACD indicator, an indicator in MetaTrader 5, can identify high-potential levels for trading as a strategy.
It can also be used for different time frames and trading styles, helping determine market direction by comparing the current price to the Opening Range (OR). Additionally, this Trading tool provides suitable entry and exit points for trades.
ACD MT4 PDF
ACD MT4 PDF
Click to download ACD MT4 PDFIn which markets can the ACD Indicator be used?
The ACD Indicator can be used in various markets, including forex, commodities, and stocks. It is flexible and can be combined with different trading styles.
What are the benefits of using the ACD Indicator?
The ACD Indicator helps traders identify potential trend breakouts and receive straightforward entry and exit signals. It is also customizable for different markets and styles.
That is awsome.Thanks for sharing. Is it possible to add ON/OFF button?
you can use setting. please check video
Sorry for asking again. what is the section of Previous Candle Box do? What does it do for calculation? I can't it figure out the boxes! it is not the High or Low of day. thanks in advanced if explain little bit.
please see videos and read content carefully. you need to understand concept of this indicator at first.


