![CCI Filter Levels Oscillator for MT4 Download – Free – [TradingFinder]](https://cdn.tradingfinder.com/image/466725/13-170-en-cci-filter-levels-mt4-01.webp)
![CCI Filter Levels Oscillator for MT4 Download – Free – [TradingFinder] 0](https://cdn.tradingfinder.com/image/466725/13-170-en-cci-filter-levels-mt4-01.webp)
![CCI Filter Levels Oscillator for MT4 Download – Free – [TradingFinder] 1](https://cdn.tradingfinder.com/image/466724/13-170-en-cci-filter-levels-mt4-02.webp)
![CCI Filter Levels Oscillator for MT4 Download – Free – [TradingFinder] 2](https://cdn.tradingfinder.com/image/466727/13-170-en-cci-filter-levels-mt4-03.webp)
![CCI Filter Levels Oscillator for MT4 Download – Free – [TradingFinder] 3](https://cdn.tradingfinder.com/image/466726/13-170-en-cci-filter-levels-mt4-04.webp)
The CCI Filter Levels Indicator enables precise analysis of different market conditions through dynamic color-coding based on the CCI (Commodity Channel Index).
This oscillator is an advanced version of the classic CCI indicator, offering clear buy and sell signals in the form of a color-coded line within a separate window using flexible settings.
This trading tool draws circular markers on the chart: green circles represent buy signals, and red circles indicate sell signals.
CCI Filter Levels Oscillator Specifications Table
The features and specifications of the CCI Filter Indicator are listed in the table below.
|
Indicator Categories:
|
Oscillators MT4 Indicators
Signal & Forecast MT4 Indicators
|
|
Platforms:
|
MetaTrader 4 Indicators
|
|
Trading Skills:
|
Intermediate
|
|
Indicator Types:
|
Overbought and Oversold MT4 Indicators
Reversal MT4 Indicators
|
|
Timeframe:
|
Multi-Timeframe MT4 Indicators
|
|
Trading Style:
|
Day Trading MT4 Indicators
Scalper MT4 Indicators
Swing Trading MT4 Indicators
|
|
Trading Instruments:
|
Stock Market MT4 Indicators
Cryptocurrency MT4 Indicators
Forex MT4 Indicators
|
CCI Filter Indicator at a Glance
In the CCI Filter Levels Oscillator, the logic is based on comparing the CCI value to specific trigger levels. Each color on the oscillator line represents a different market state:
- Green: When the CCI value exceeds the upper (positive) trigger level
- Red: When the CCI value drops below the lower (negative) trigger level
- Blue: When the CCI value is between zero and the upper trigger level
- Yellow: When the CCI value is between zero and the lower trigger level
- Gray: Indicates a phase shift
Buy Signal
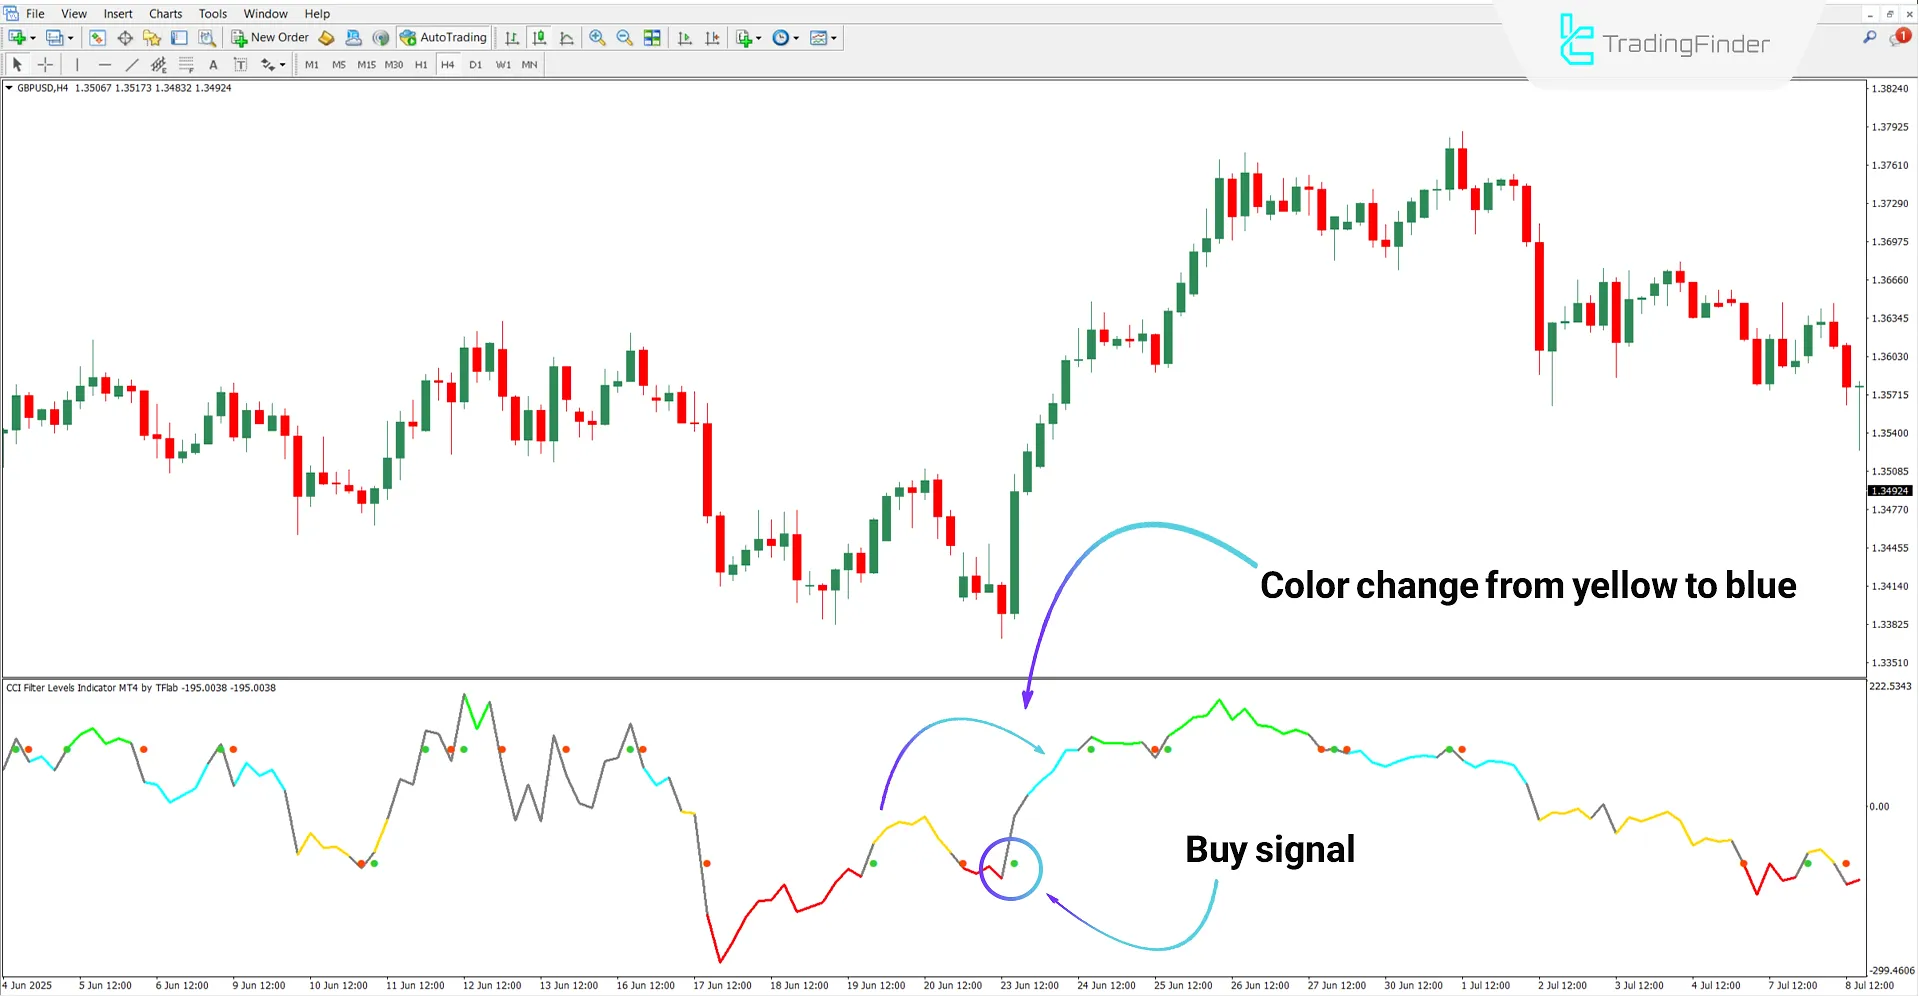
In the4-hour chart of the GBP/USD currency pair, the uptrend is confirmed by a color change in the indicator line from yellow to blue, followed by green. The CCI line crossing above the positive trigger level reflects strong buyer momentum. Finally, the indicator prints a green dot to issue the buy signal.

Sell Signal
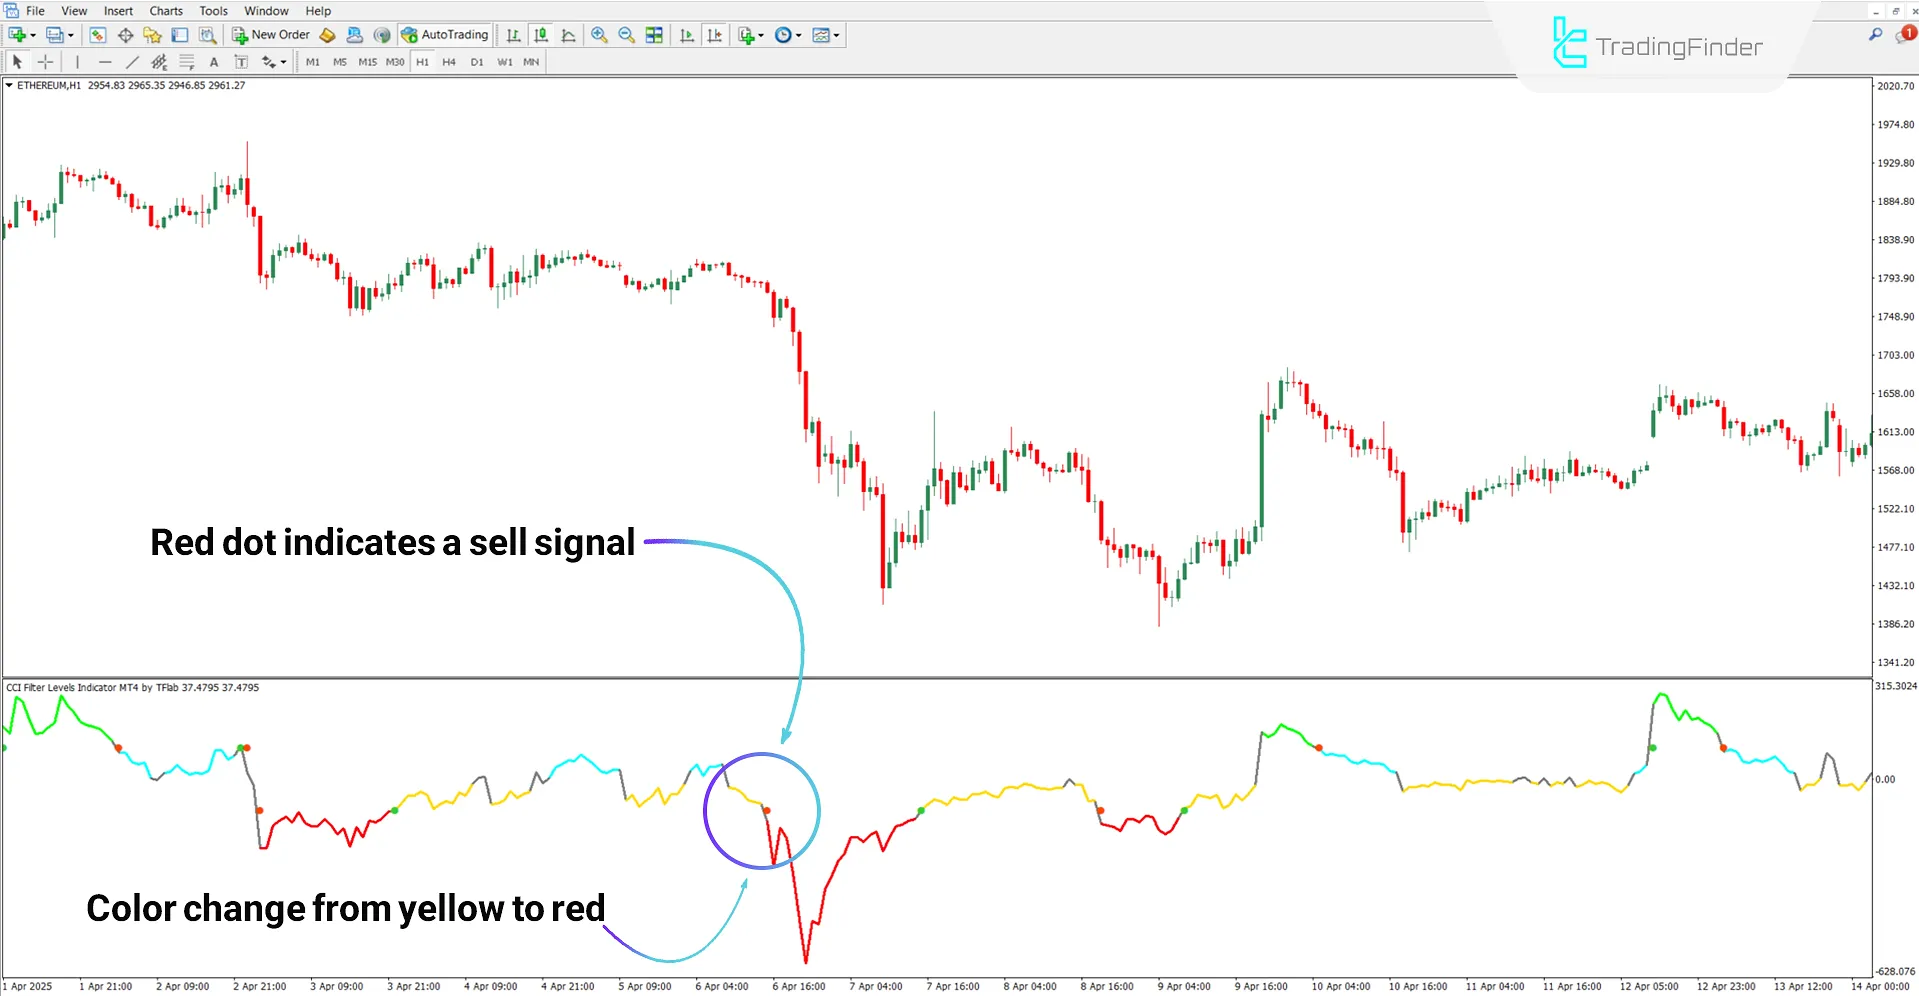
In the 1-hour chart of Ethereum (ETH), the downtrend is identified as the indicator line falls below the zero level, changing from yellow to red. Under these conditions, the sell entry signal is marked with a red dot on the oscillator.

CCI Filter Levels Oscillator Settings
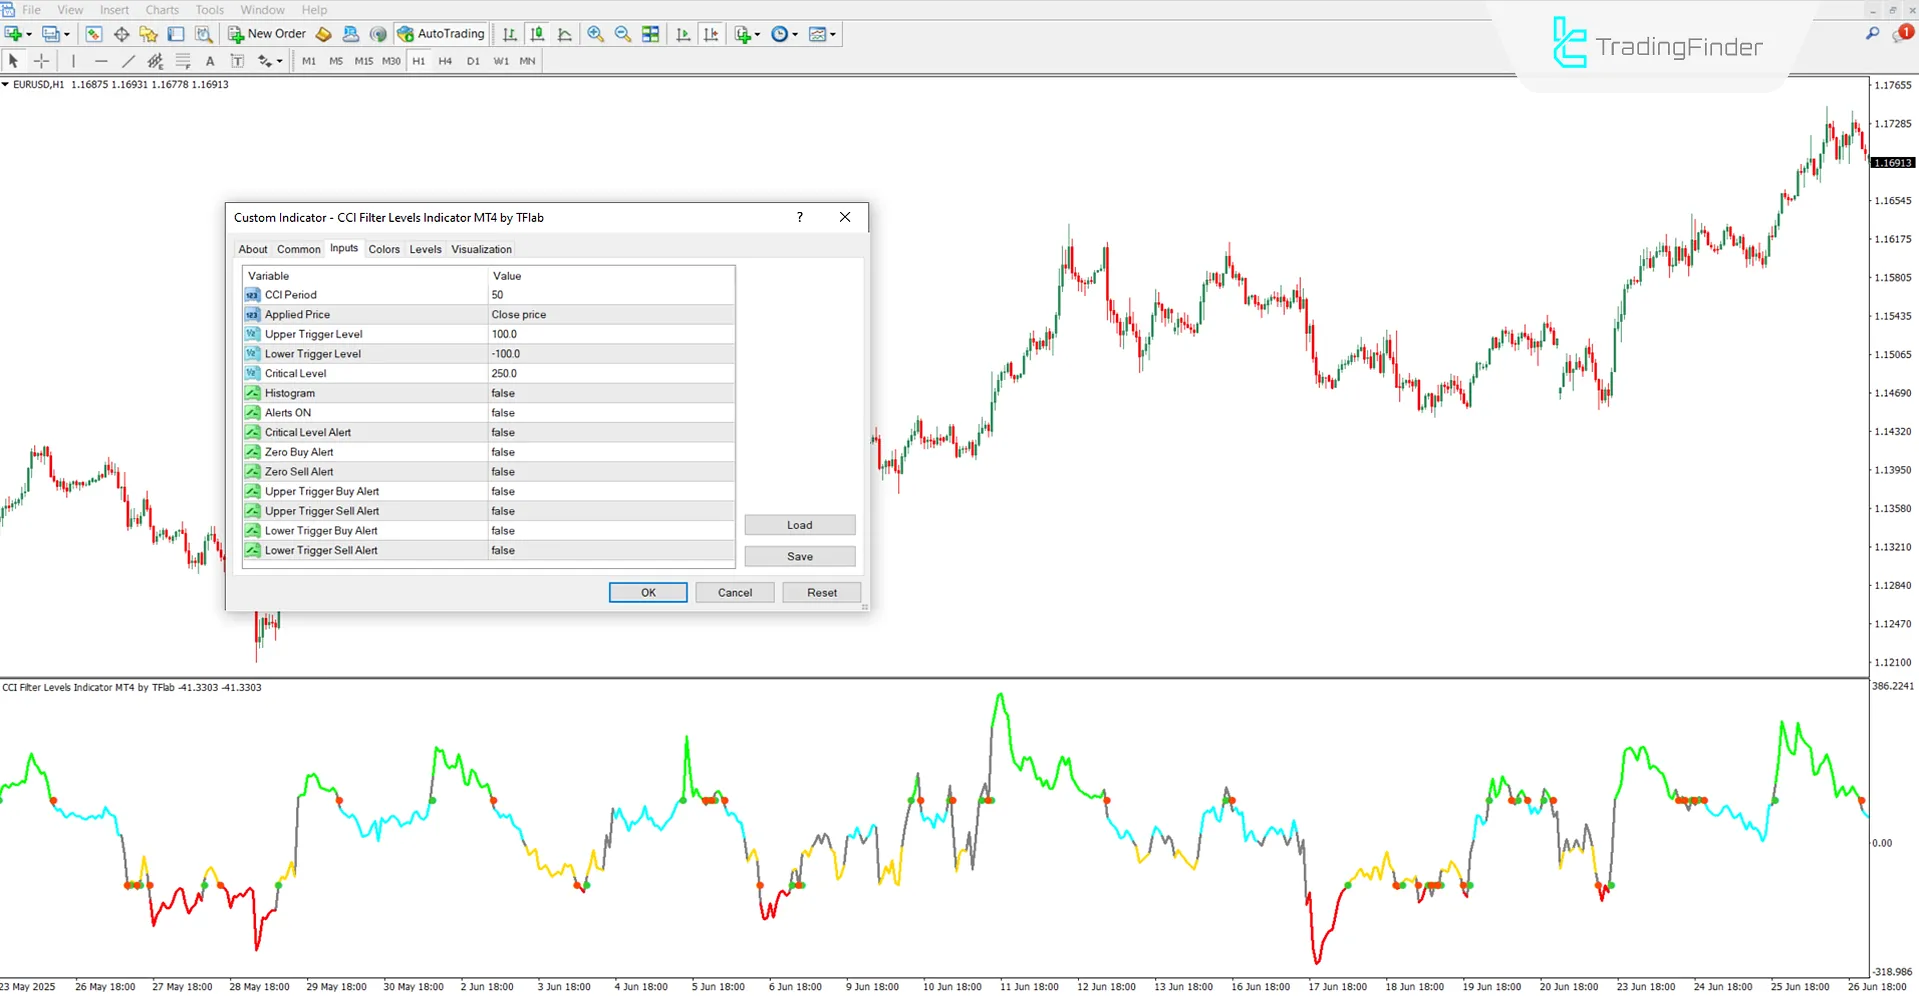
The settings for the CCI Filter Indicator are described as follows:

- CCI Period: The number of periods used to calculate the CCI
- Applied Price: The price type used in the calculation (e.g., close, typical)
- Upper Trigger Level: The positive trigger level for identifying buy signals
- Lower Trigger Level: The negative trigger level for identifying sell signals
- Critical Level: A threshold for filtering or issuing special alerts
- Histogram: Enable/turn the histogram view on or off
- Alerts: Enable/disable alerts
- Critical Level Alert: Alert when the price crosses the critical level
- Zero Buy Alert: Alert when crossing zero upwards
- Zero Sell Alert: Alert when crossing zero downwards
- Upper Trigger Buy Alert: Alert for buy entry at upper trigger level breakout
- Upper Trigger Sell Alert: Alert for selling in overbought zones
- Lower Trigger Buy Alert: Alert for buying in oversold zones
- Lower Trigger Sell Alert: Alert for sell entry at lower trigger level breakout
Conclusion
The CCI Filter Levels Indicator is an advanced technical analysis tool based on the CCI index, clearly visualizing market conditions through intelligent color schemes. This oscillator identifies entry and exit points using upper and lower trigger levels, marking them with small colored circles.
Additionally, by enabling the Histogram option, the output can be displayed in the form of a bar-style oscillator.
CCI Filter Levels Oscillator MT4 PDF
CCI Filter Levels Oscillator MT4 PDF
Click to download CCI Filter Levels Oscillator MT4 PDFWhat does the green color in the CCI Filter Indicator mean?
It means the CCI line has crossed above the upper (positive) trigger level.
Can I change the CCI period?
Yes, the CCI period can be adjusted in the settings section of the CCI Filter Levels Oscillator.