![Daily High Low Indicator for MetaTrader 4 Download - Free - [Trading Finder]](https://cdn.tradingfinder.com/image/104787/10-18-en-daily-h-l-mt4-1.webp)
![Daily High Low Indicator for MetaTrader 4 Download - Free - [Trading Finder] 0](https://cdn.tradingfinder.com/image/104787/10-18-en-daily-h-l-mt4-1.webp)
![Daily High Low Indicator for MetaTrader 4 Download - Free - [Trading Finder] 1](https://cdn.tradingfinder.com/image/104666/10-18-en-daily-h-l-mt4-03.webp)
![Daily High Low Indicator for MetaTrader 4 Download - Free - [Trading Finder] 2](https://cdn.tradingfinder.com/image/104665/10-18-en-daily-h-l-mt4-02.webp)
![Daily High Low Indicator for MetaTrader 4 Download - Free - [Trading Finder] 3](https://cdn.tradingfinder.com/image/104655/10-18-en-daily-h-l-mt4-05.webp)
The Daily High-Low Indicator is one of the powerful tools in MetaTrader 4 Indicator that helps traders in technical analysis to identify critical Support and Resistance levels based on the highest (High) and lowest (Low) prices recorded during a trading day.
This indicator marks the highest and lowest prices of the current and previous trading day on the chart with red lines (lowest price) and green lines (highest price). These levels can help determine appropriateEntry-Exit points and Take Profit-Stop Loss levels. This indicator is particularly useful in all markets, especially in volatile markets where price movements are fast and unpredictable.
Indicator Table
Indicator Categories: | Price Action MT4 Indicators Support & Resistance MT4 Indicators Levels MT4 Indicators |
Platforms: | MetaTrader 4 Indicators |
Trading Skills: | Elementary |
Indicator Types: | Breakout MT4 Indicators Trend MT4 Indicators Reversal MT4 Indicators |
Timeframe: | Multi-Timeframe MT4 Indicators |
Trading Style: | Day Trading MT4 Indicators Intraday MT4 Indicators Swing Trading MT4 Indicators |
Trading Instruments: | Share Stocks MT4 Indicators Forward Market MT4 Indicators Indices Market MT4 Indicators Commodity Market MT4 Indicators Stock Market MT4 Indicators Cryptocurrency MT4 Indicators Forex MT4 Indicators |
Indicator at a Glance
The Daily High and Low Indicator is a practical tool for identifying key price levels. Using this indicator, traders can determine the daily high and low price levels and base their analyses on them. By plotting these levels, the indicator allows them to be used as support and resistance levels, aiding traders in making more precise decisions.
Buy Signal Conditions of the Indicator (Support Level)
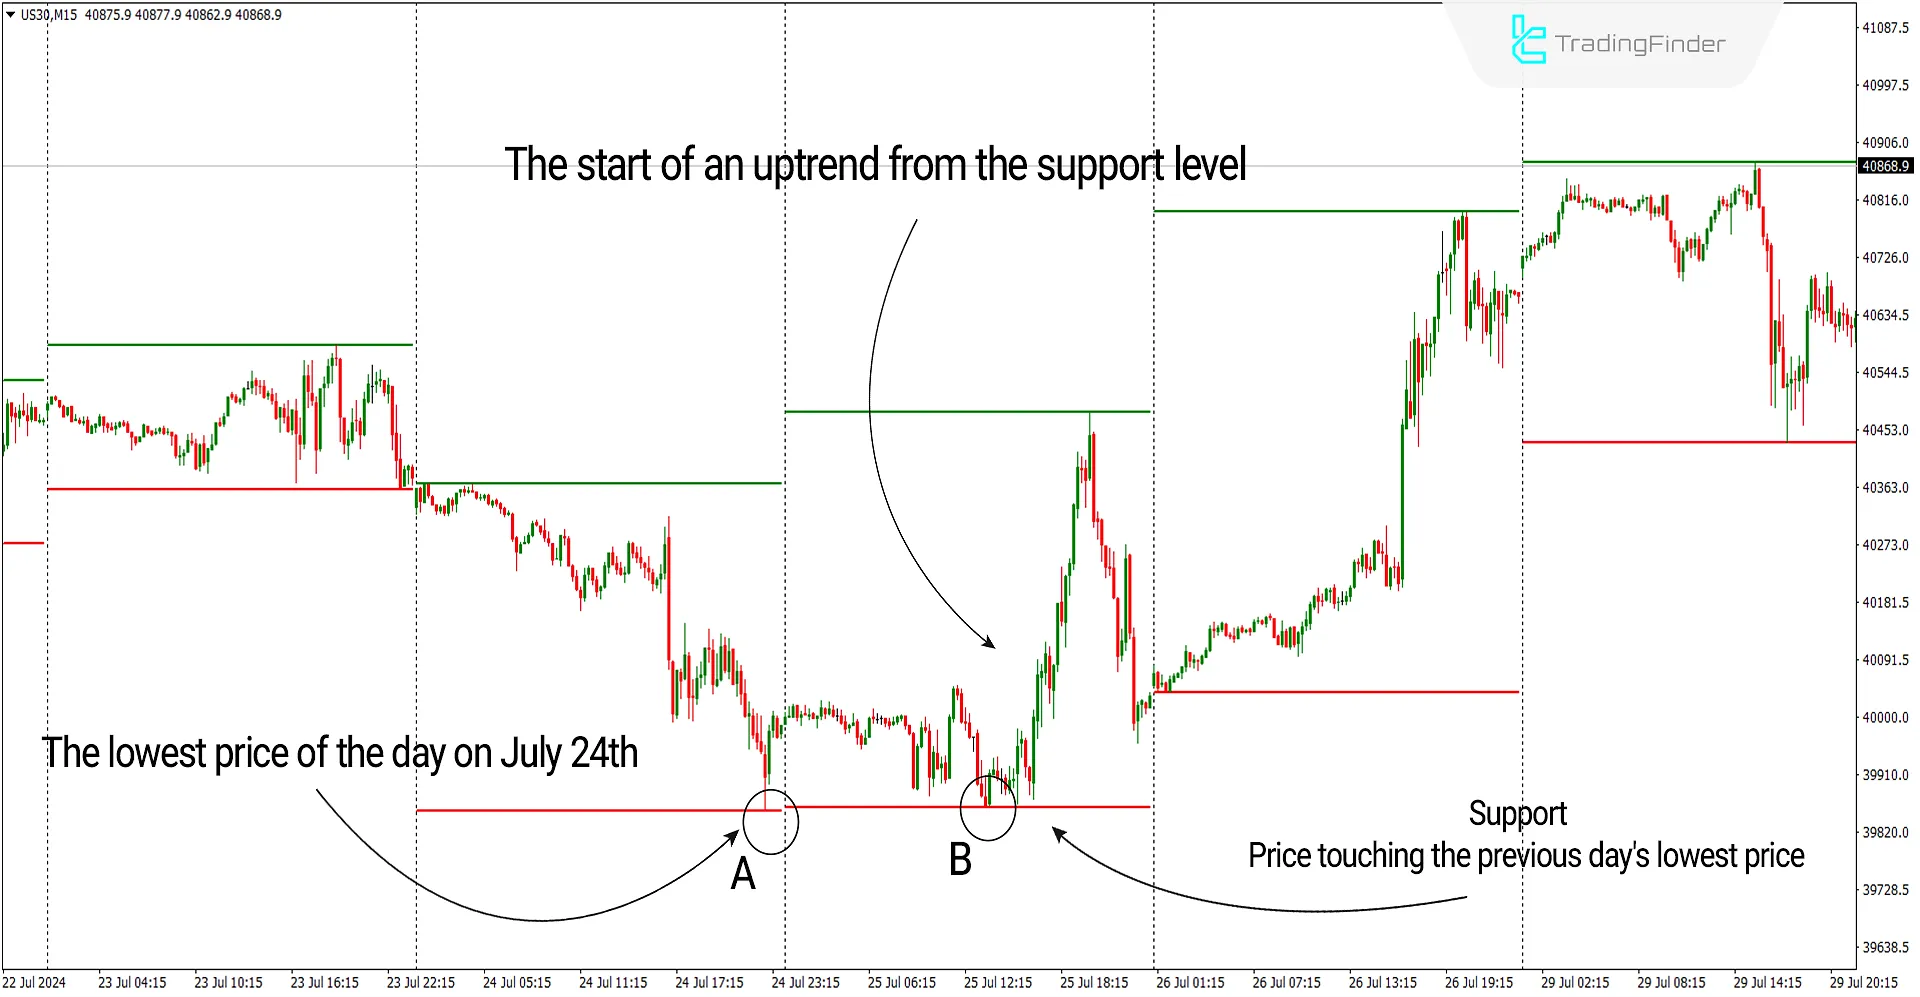
The chart below shows the Dow Jones Index (symbol US30) in a 15-minute timeframe. On July 24th, the chart recorded the day's lowest price at point (A). The next day, it is observed that the price again reached the price range of (A) at point (B), where the previous day's (supportive) level functioned well. To enter Buy Positions, traders could have looked for price reversal confirmations, such as candlestick or classic reversal patterns around point (B)
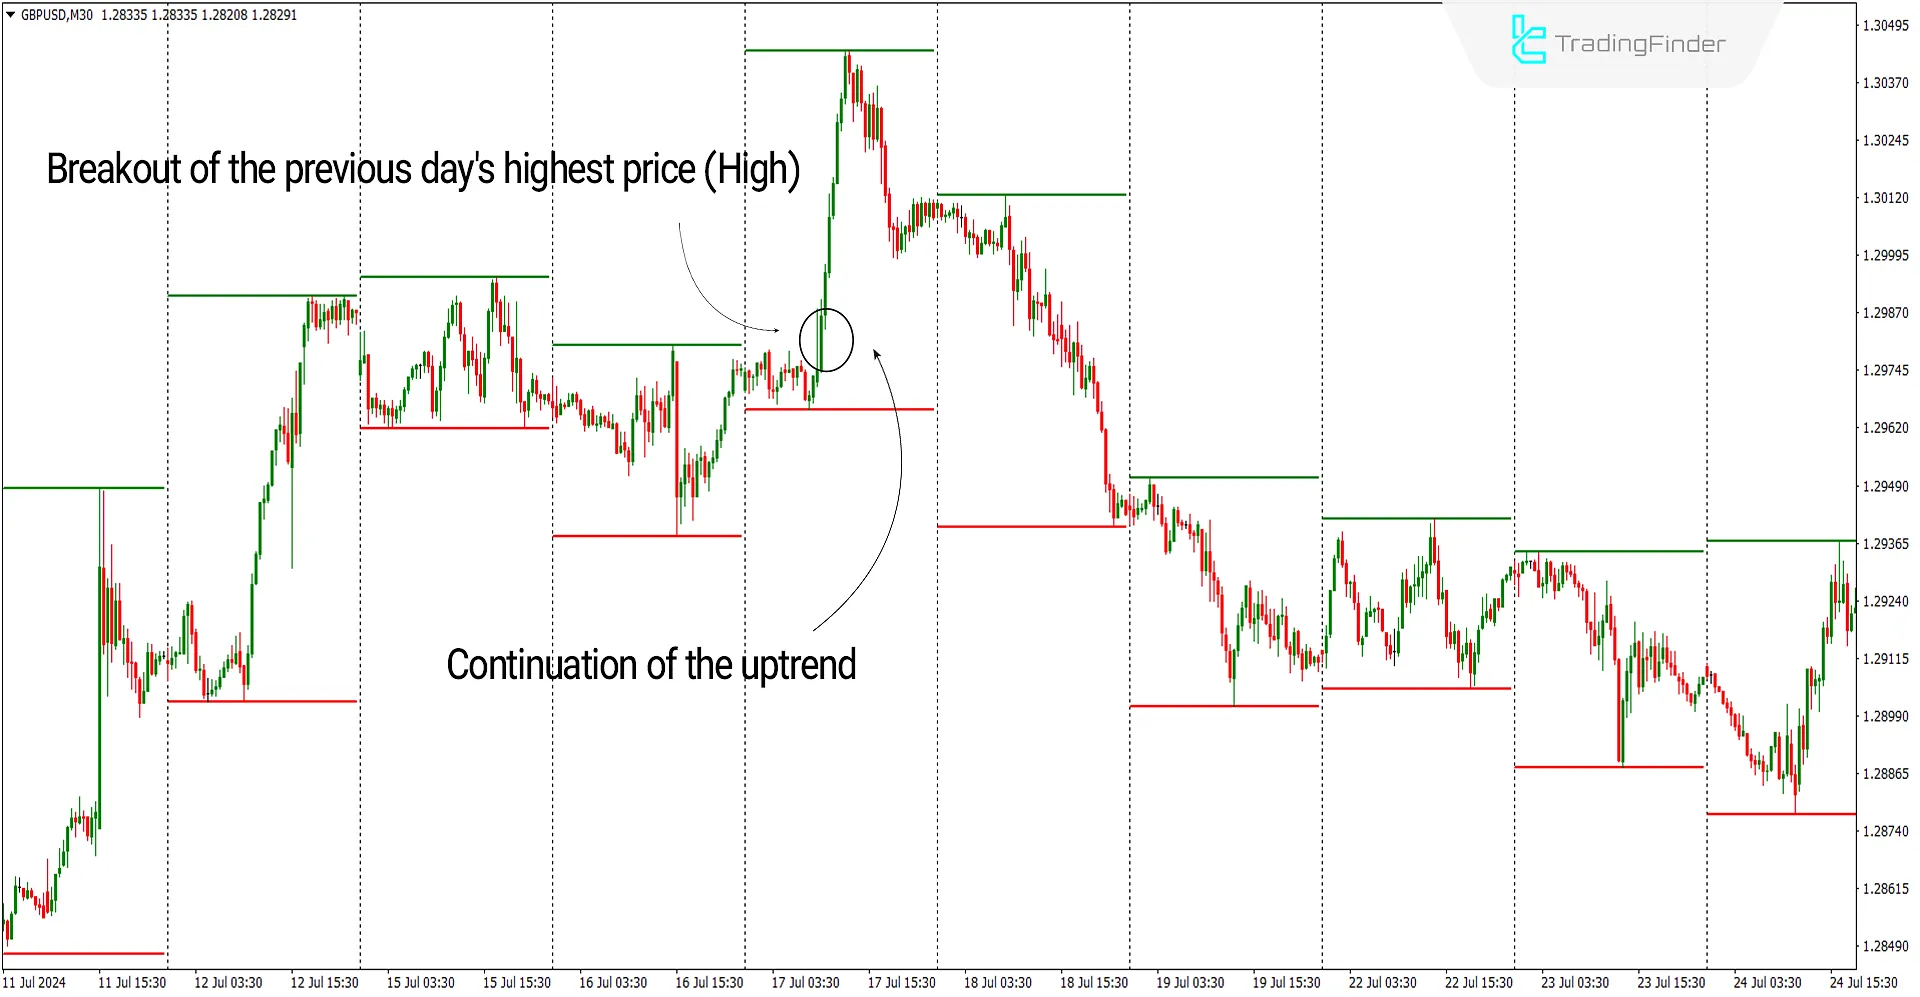
In the chart below, for the GBP to USD (GBPUSD), it is also observed that after breaking the previous day's highest price (High), the recent uptrend continued.
Sell Signal Conditions of the Indicator (Resistance Level)
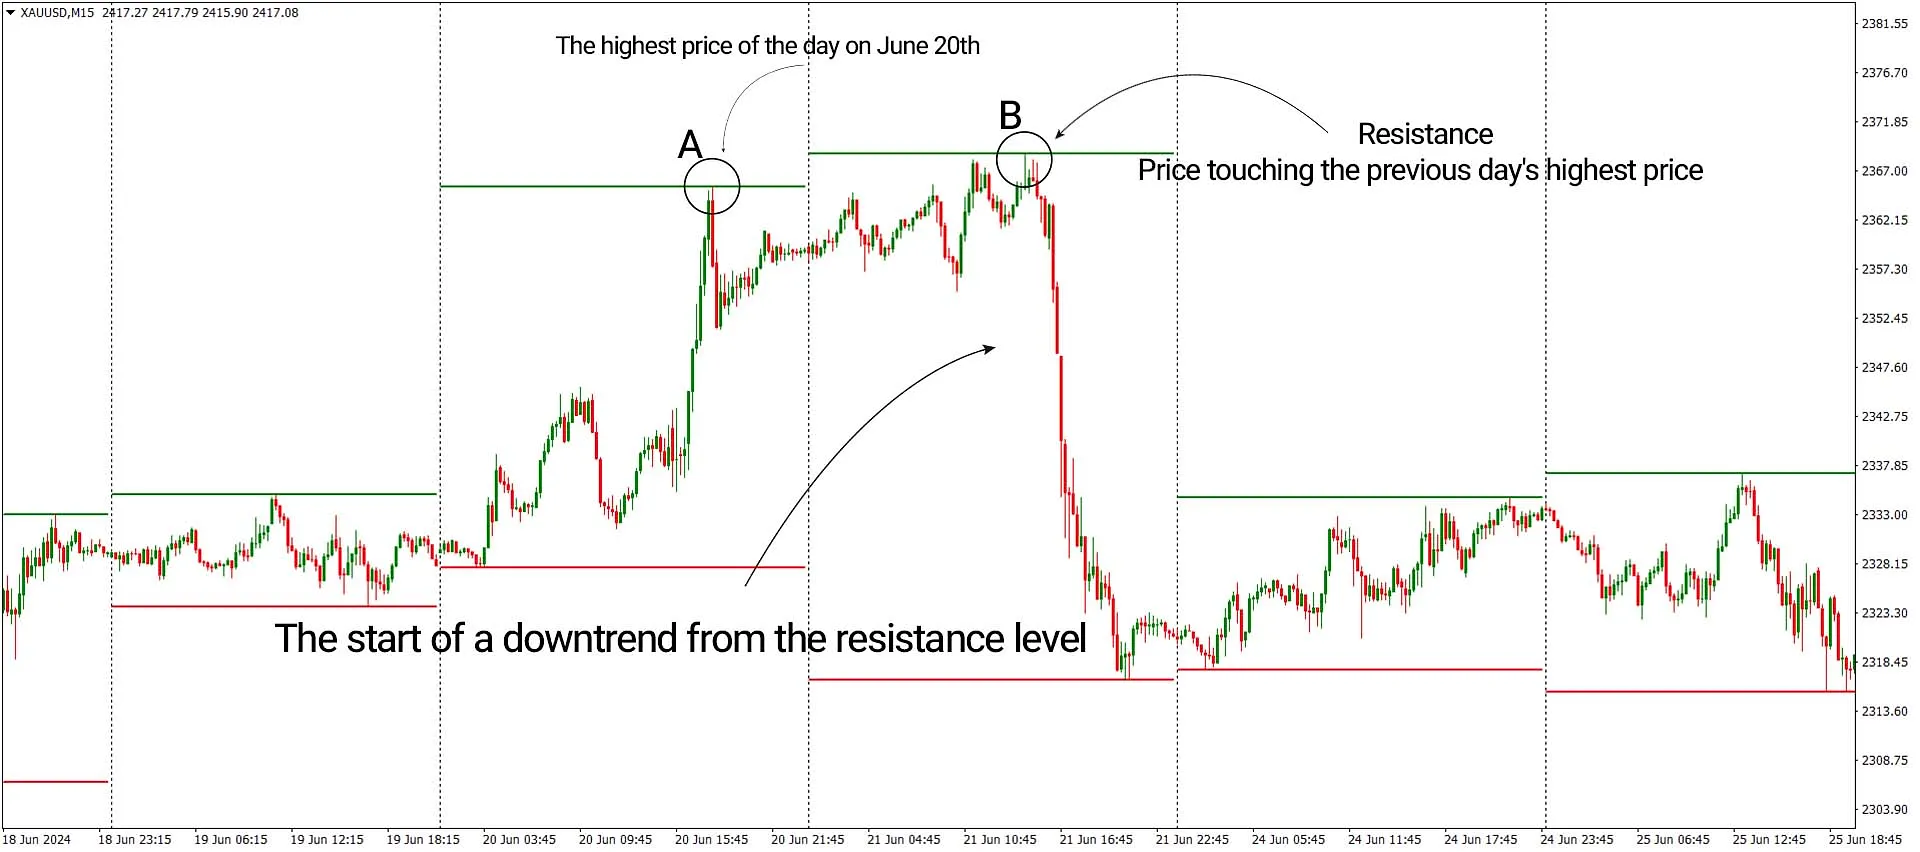
The chart below shows the price of Gold to US Dollar (symbol XAUUSD) in a 15-minute timeframe. On June 20th, the chart recorded the day's highest price at point (A). The next day, it is observed that the price again reached the price range of (A) at point (B), where the previous day's (resistance) level functioned well. Traders could have looked for price reversal confirmations, such as candlestick patterns or classic reversal patterns around point (B), to enter Sell Positions.
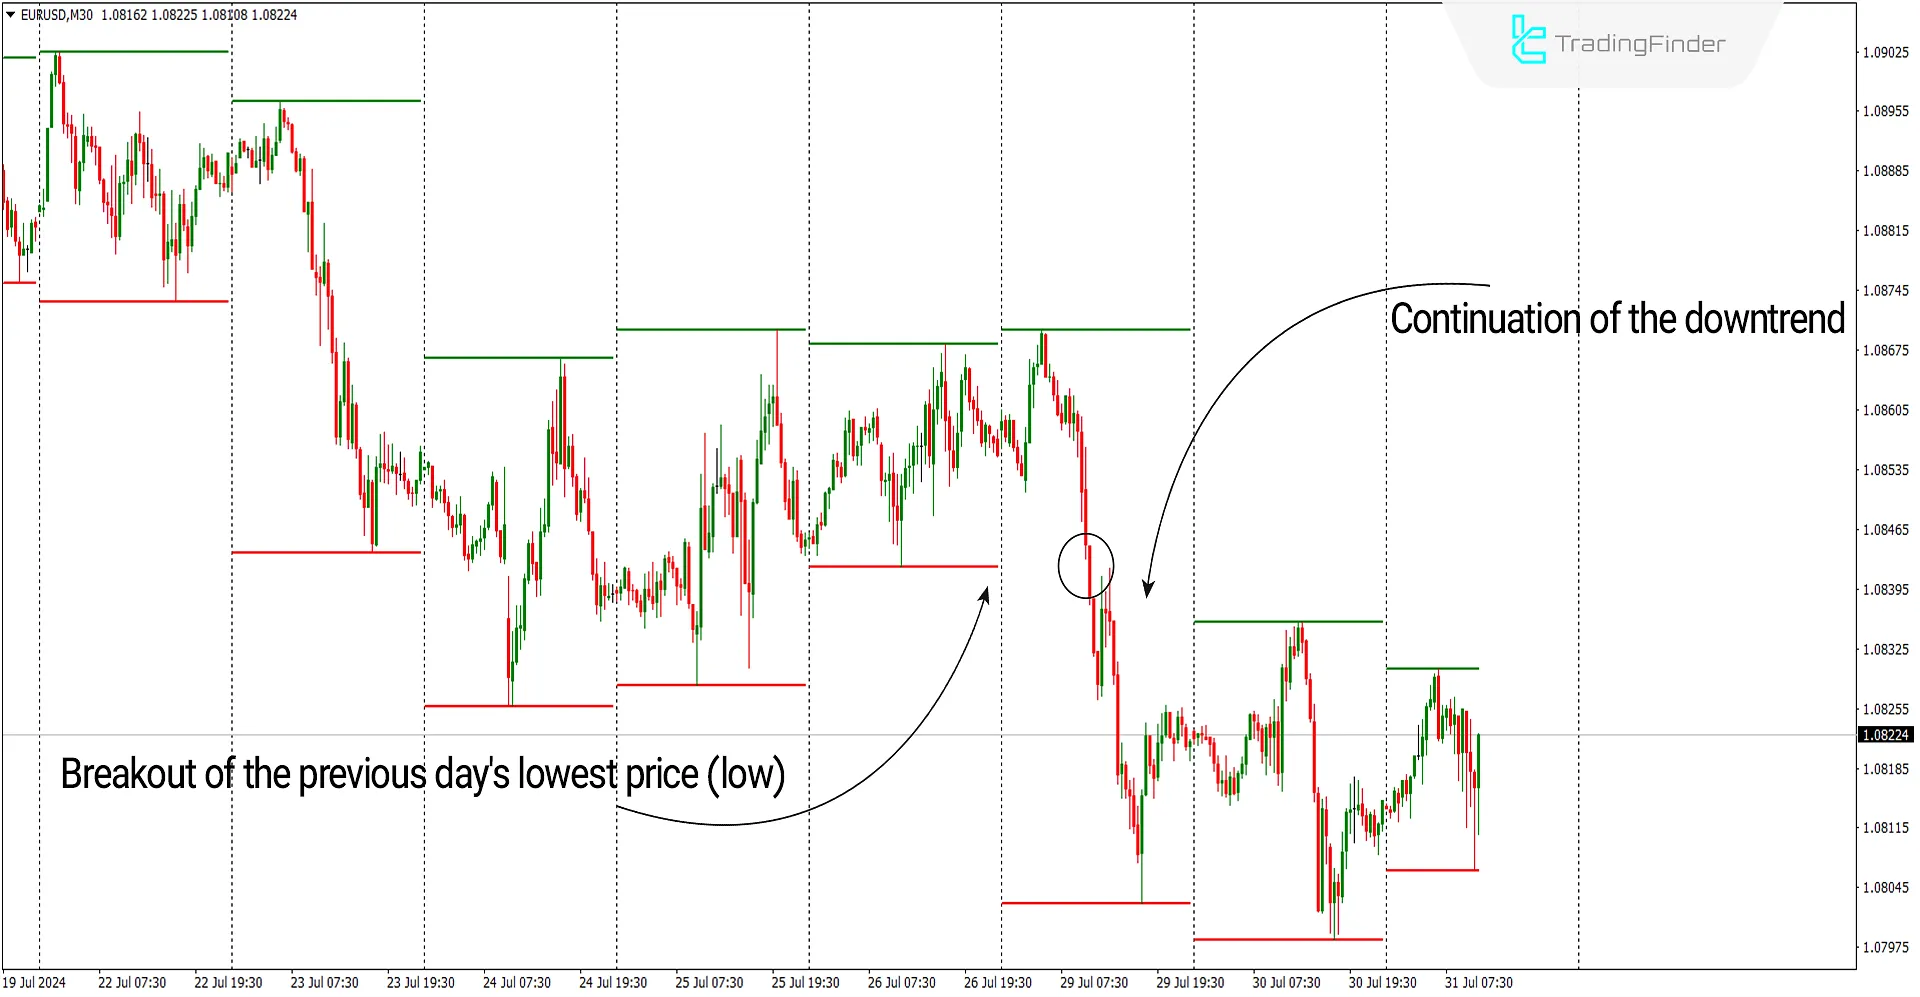
In the chart below, for the EUR to USD (EURUSD), it is also observed that after breaking the previous day's lowest price (Low), the recent downtrend continued.
Daily High-Low Indicator Settings
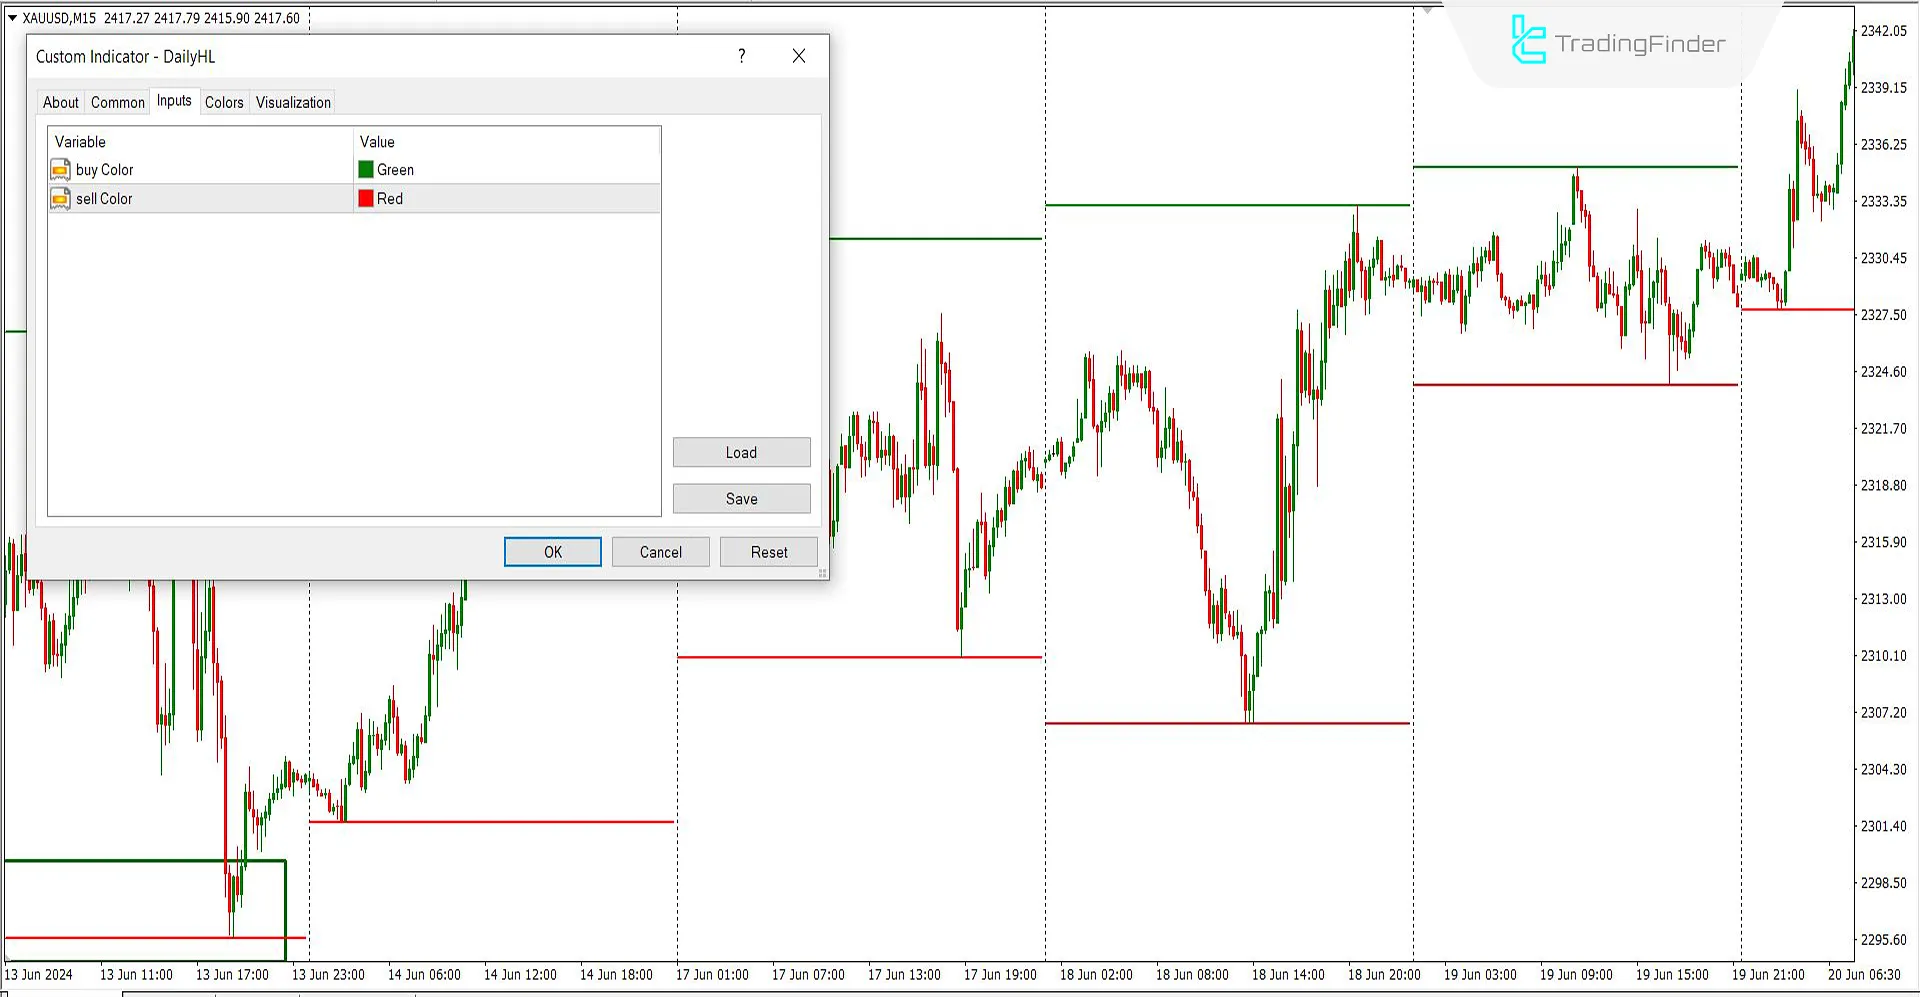
- Buy Color: The color for the highest price level can be green or any preferred color
- Sell Color: The color for the lowest price level can be green or any preferred color
Conclusion
This indicator is an essential tool in technical analysis because it automatically identifies the High and Low price levels without the need for chart analysis. Traders can use this indicator with other technical indicators, such as Moving Averages, Relative Strength Indexes (RSI), or Bollinger Bands, to confirm signals and improve trading accuracy.
Daily High Low MT4 PDF
Daily High Low MT4 PDF
Click to download Daily High Low MT4 PDFWhat is the Daily High-Low Indicator used for?
This indicator is used to identify the highest and lowest prices of the current and previous trading day, providing critical support and resistance levels for trading decisions.
How can the Daily H-L Indicator be combined with other tools?
This indicator can be combined with other technical tools such as moving averages, RSI, or Bollinger Bands to enhance trading signals and increase accuracy.


