![Fibonacci Retracement Assistant Indicator for MT4 Download - Free - [TFlab]](https://cdn.tradingfinder.com/image/105272/10-10-en-fibonacci-retracement-mt4.webp)
![Fibonacci Retracement Assistant Indicator for MT4 Download - Free - [TFlab] 0](https://cdn.tradingfinder.com/image/105272/10-10-en-fibonacci-retracement-mt4.webp)
![Fibonacci Retracement Assistant Indicator for MT4 Download - Free - [TFlab] 1](https://cdn.tradingfinder.com/image/31223/10-10-en-fibo-ret-assistant-mt4-02.avif)
![Fibonacci Retracement Assistant Indicator for MT4 Download - Free - [TFlab] 2](https://cdn.tradingfinder.com/image/31226/10-10-en-fibo-ret-assistant-mt4-03.avif)
![Fibonacci Retracement Assistant Indicator for MT4 Download - Free - [TFlab] 3](https://cdn.tradingfinder.com/image/31237/10-10-en-fibo-ret-assistant-mt4-04.avif)
The Fibonacci Retracement Assistant Indicator is one of the MetaTrader 4 indicators. Fibonacci is one of the most widely used tools in technical analysis that helps traders identify key price reversal points.
To use this indicator, you must first select two points on the price chart in MetaTrader using the Fibonacci tool: one high point (High) and one low point (Low). The indicator then plots lines at Fibonacci ratios between these two points. These lines act as support and resistance levels where the price may potentially retrace.
Indicator Table
Indicator Categories: | Trading Assist MT4 Indicators Chart & Classic MT4 Indicators Levels MT4 Indicators Fibonacci MT4 Indicators |
Platforms: | MetaTrader 4 Indicators |
Trading Skills: | Intermediate |
Indicator Types: | Entry and Exit MT4 Indicators Reversal MT4 Indicators |
Timeframe: | Multi-Timeframe MT4 Indicators |
Trading Style: | Day Trading MT4 Indicators Fast Scalper MT4 Indicators Scalper MT4 Indicators Swing Trading MT4 Indicators |
Trading Instruments: | Share Stocks MT4 Indicators Indices Market MT4 Indicators Commodity Market MT4 Indicators Stock Market MT4 Indicators Cryptocurrency MT4 Indicators Forex MT4 Indicators |
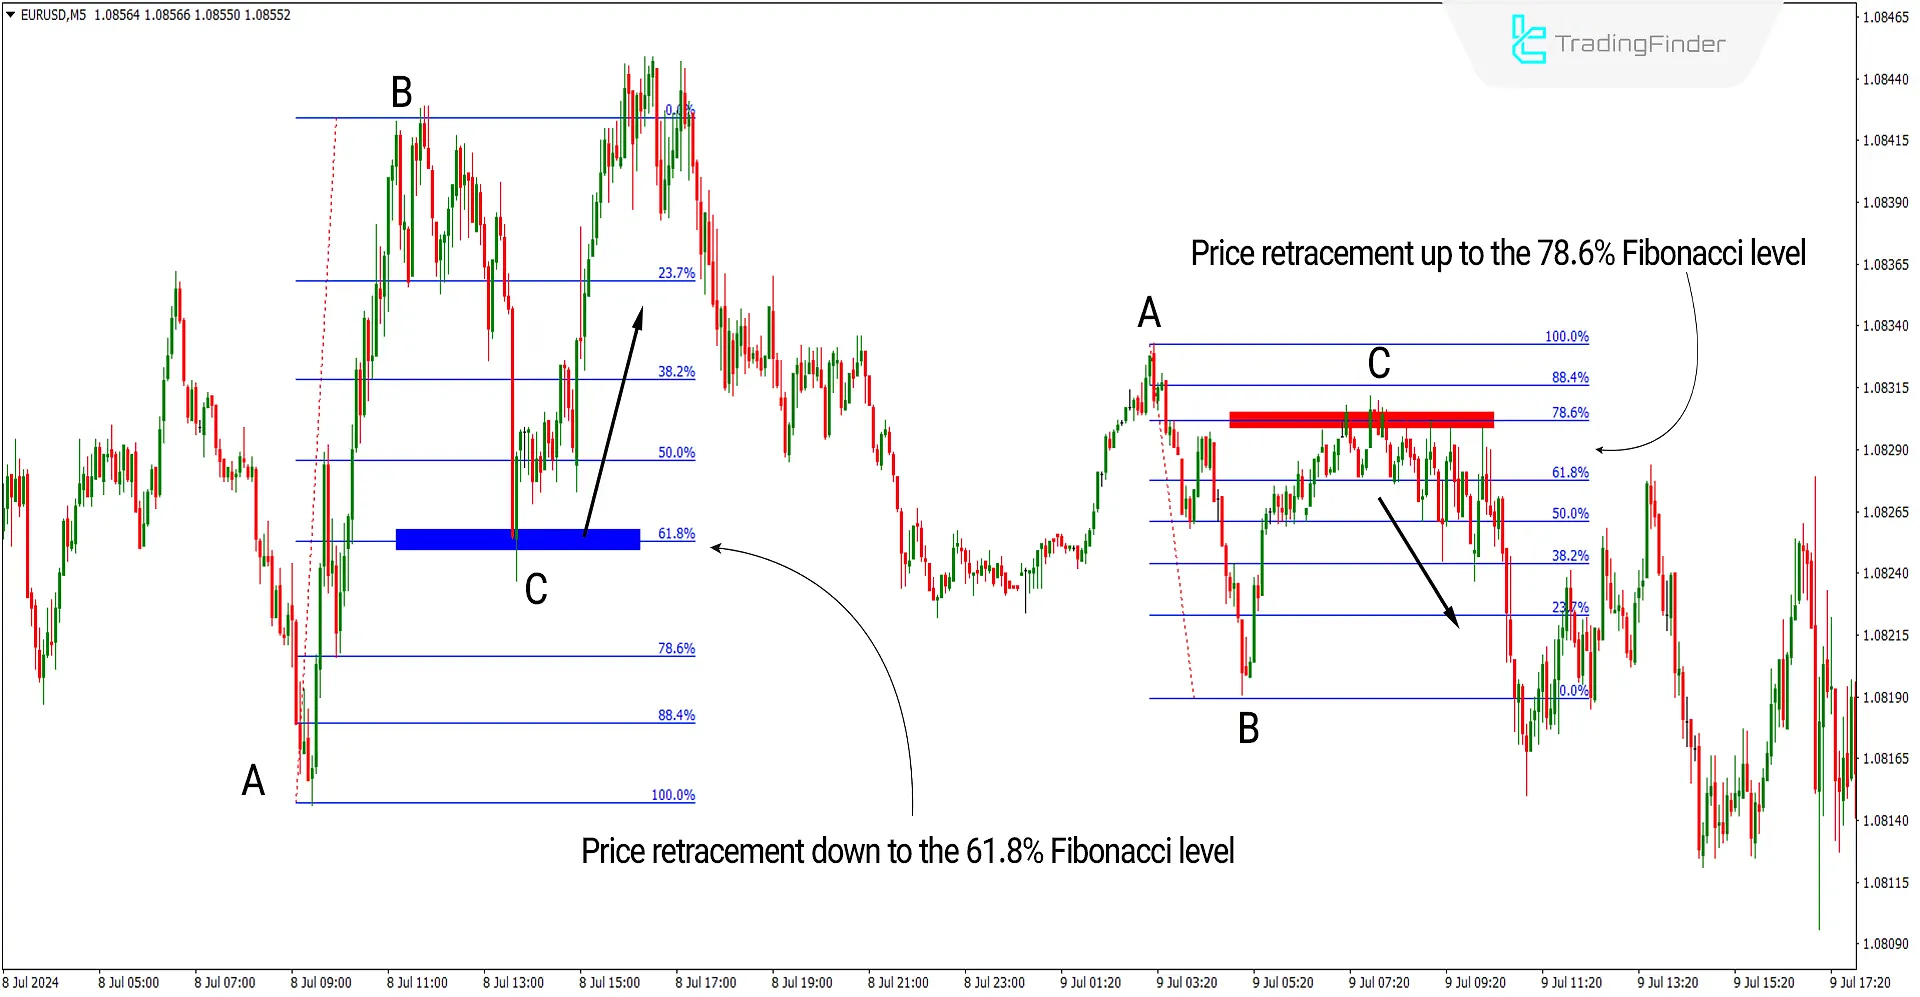
The image below shows a chart of the EUR/USD currency pair in a 5-minute timeframe. On the left side of the image, an upward move (AB) has occurred, with its retracement (BC) reaching the 61.8% Fibonacci level and showing a bullish reaction.
Thus, the Fibonacci retracement level has effectively acted as support. Additionally, on the right side of the image, a downward move (AB) has occurred, with its retracement (BC) reaching the 78.6% level and showing a bearish reaction. Therefore, the Fibonacci level acted as resistance in this case.

Overview
The Fibonacci Retracement Assistant Indicator is a powerful tool in Technical Analysis that can help traders identify Reversal points and critical Support and Resistance levels.
However, it can be combined with other technical analysis tools, such as trend lines, to optimize its use.
Bullish Fibonacci Conditions (Buy Position)
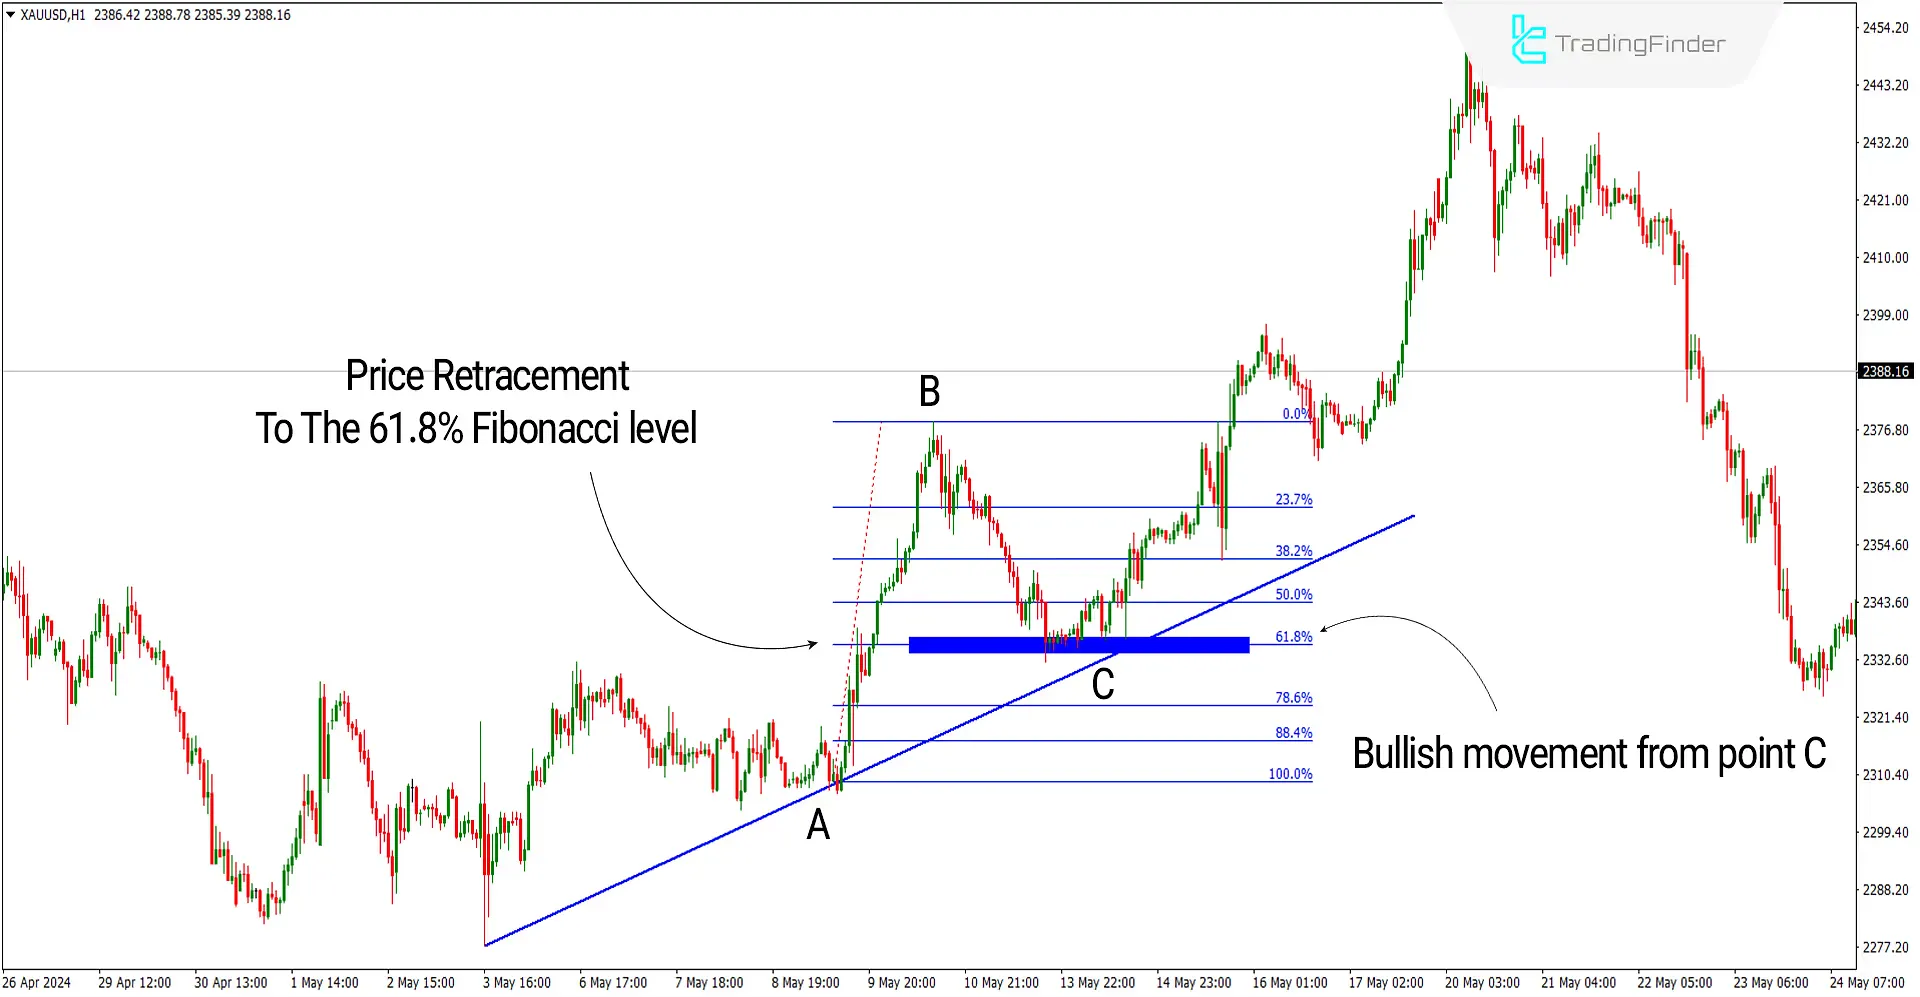
The image below shows the price chart of gold (XAUUSD) in a one-hour timeframe. The retracement (BC) has reached the 61.8% Fibonacci level and coincides with an upward trend line (Bullish Trend line).
In this scenario, the 61.8% Fibonacci level has acted as support, creating a favorable opportunity to enter a buy trade. Top of FormBottom of Form

Bearish Fibonacci Conditions (Sell Position)
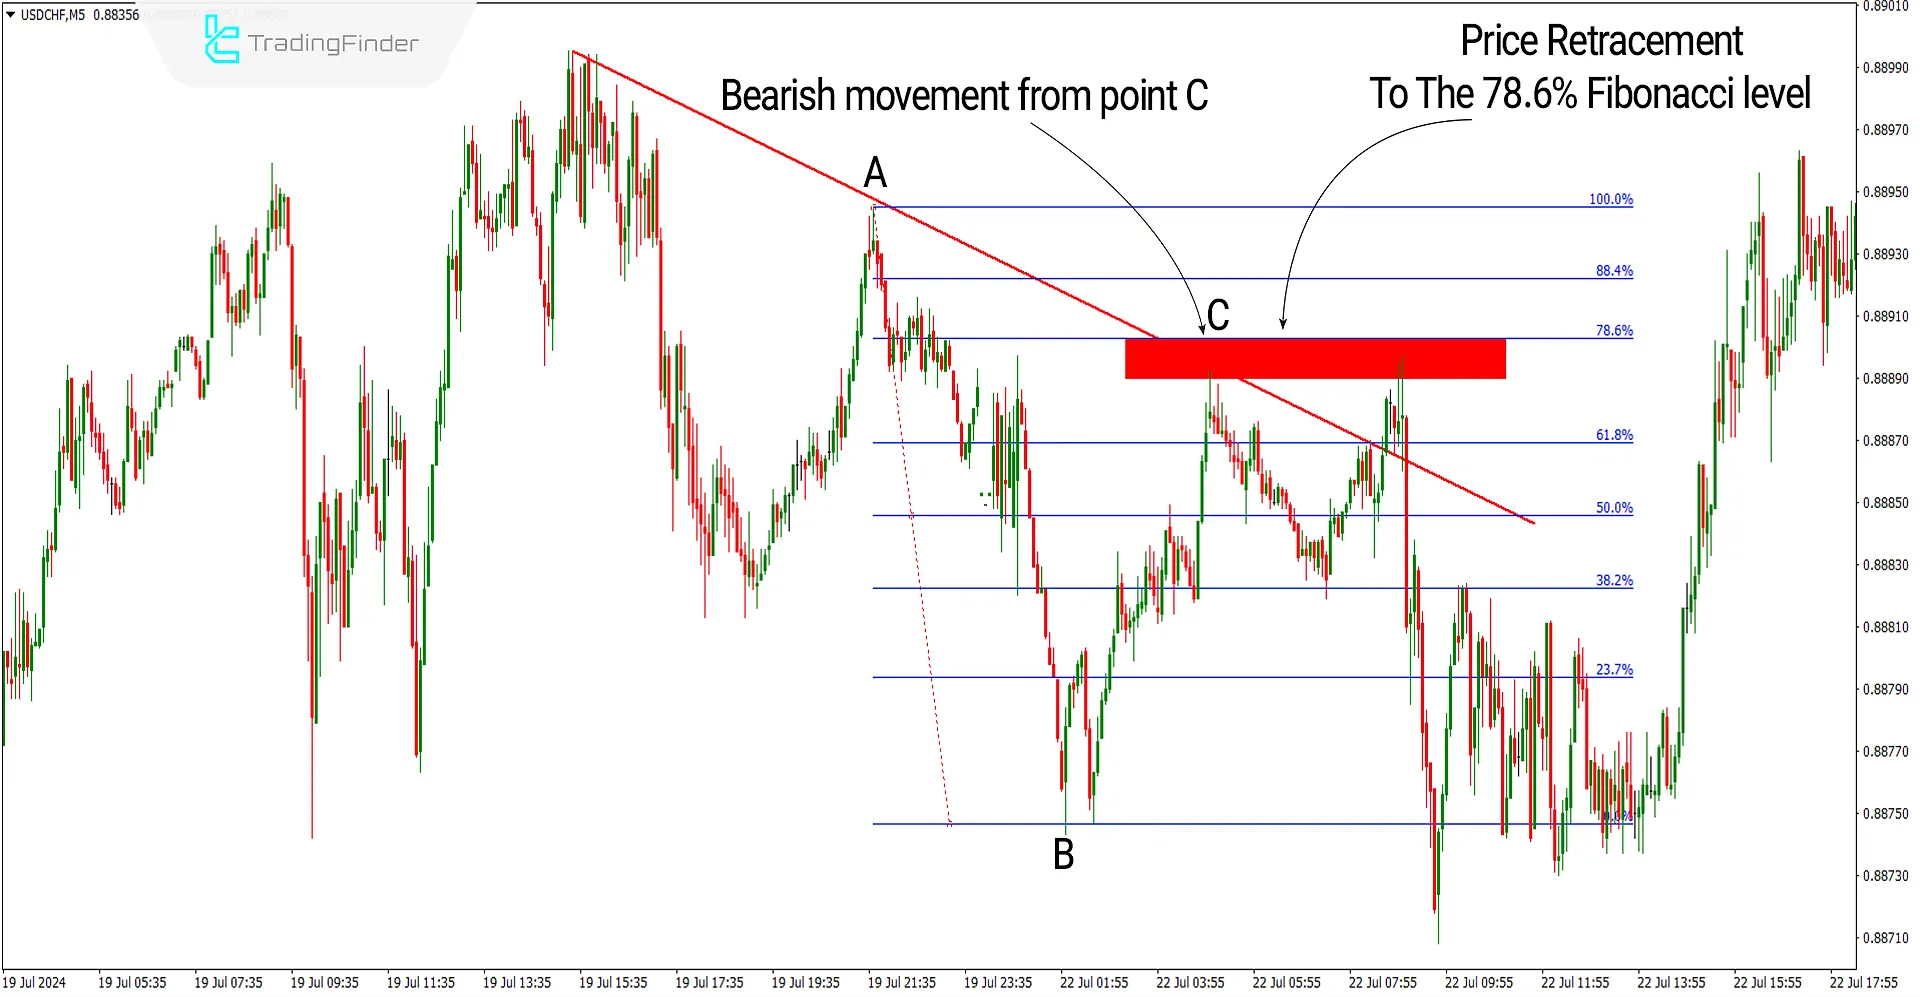
The price chart of the USD/CHF currency pair in a 5-minute timeframe is shown in the image below. The retracement (BC) has reached the 78.6% Fibonacci level and coincides with a downward trend line.
In this scenario, the 78.6% Fibonacci level has acted as resistance, creating a favorable opportunity to enter a sell trade.

Fibonacci Retracement Indicator Settings

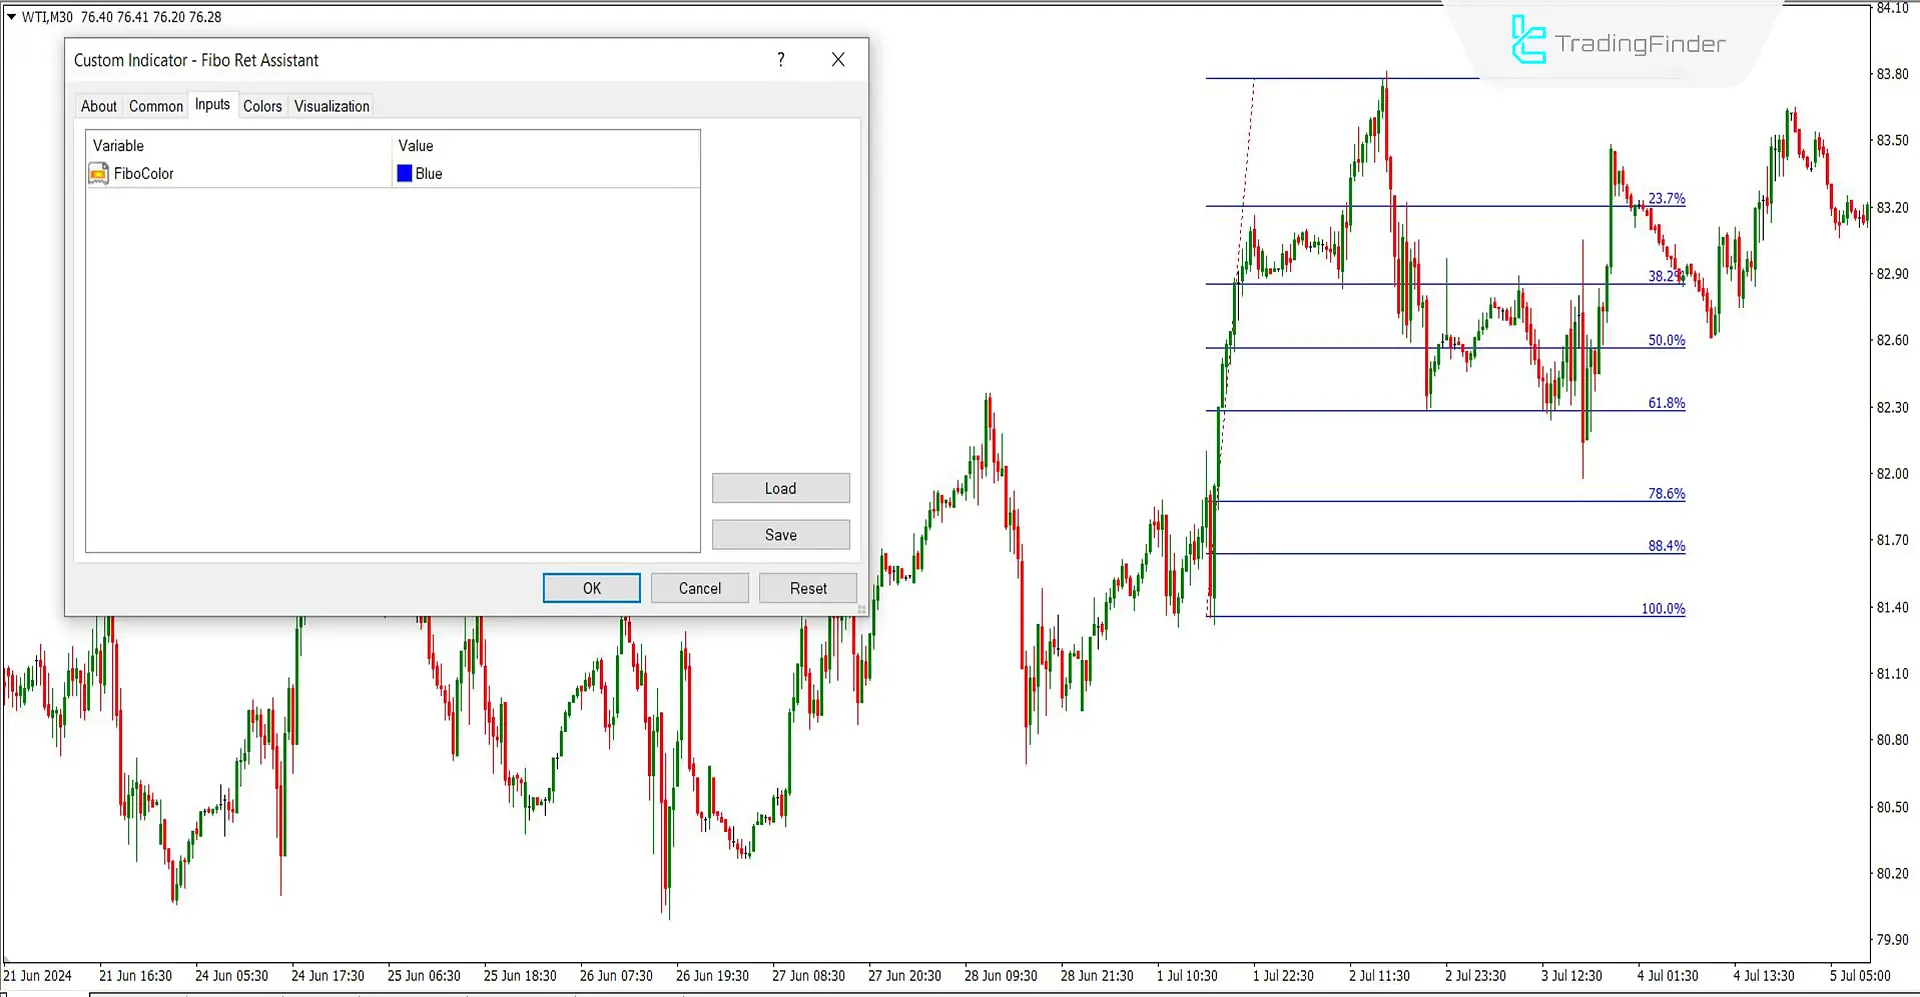
- FiboColor: Select your desired color based on the chart background color.
Note: The main level settings for the Fibonacci Assistant Indicator are preset, and no changes are needed.
Conclusion
Support and resistance levels are among the most critical and influential in market movements and trends. Fibonacci Retracement is one tool whose levels can act as support and resistance in the price.
By using Fibonacci ratios in their trading strategy, traders can determine potential MT4 Support and resistance levels based on previous price movements.
Fibonacci Retracement Assistant MT4 PDF
Fibonacci Retracement Assistant MT4 PDF
Click to download Fibonacci Retracement Assistant MT4 PDFWhat is the Fibonacci Retracement Assistant Indicator?
The Fibonacci Retracement Indicator uses Fibonacci ratios to determine support and resistance levels for price movement.
How can the accuracy of the Fibonacci Retracement Indicator be increased?
Combining this indicator with other technical analysis tools, such as trend lines, can help you make better trading decisions.


