


![Keltner Channels Indicator for MT4 – [TradingFinder] - Download](https://cdn.tradingfinder.com/image/459964/2-99-en-kletner-channels-mt4-1.webp)
![Keltner Channels Indicator for MT4 – [TradingFinder] - Download 1](https://cdn.tradingfinder.com/image/459921/2-99-en-kletner-channels-mt4-2.webp)
![Keltner Channels Indicator for MT4 – [TradingFinder] - Download 2](https://cdn.tradingfinder.com/image/459922/2-99-en-kletner-channels-mt4-3.webp)
![Keltner Channels Indicator for MT4 – [TradingFinder] - Download 3](https://cdn.tradingfinder.com/image/459920/2-99-en-kletner-channels-mt4-4.webp)
The Keltner Channels Trading Indicator is a technical analysis tool used for identifying trends, volatility, and entry/exit points in the market. This indicator, similar in appearance toBollinger Bands, consists of three colored bands in overbought and oversold zones, yet differs significantly in terms of calculation, interpretation, and signaling.
Keltner Channels Trading Indicator Table
The general specifications of the Keltner Channels Trading Indicator are provided in the table below:
Indicator Categories: | Volatility MT4 Indicators Currency Strength MT4 Indicators Trading Assist MT4 Indicators |
Platforms: | MetaTrader 4 Indicators |
Trading Skills: | Intermediate |
Indicator Types: | Reversal MT4 Indicators |
Timeframe: | Multi-Timeframe MT4 Indicators |
Trading Style: | Intraday MT4 Indicators |
Trading Instruments: | Stock Market MT4 Indicators Cryptocurrency MT4 Indicators Forex MT4 Indicators |
Glance Keltner Channels Trading Indicator
The Keltner Channels Trading Indicator is a trend-following and volatility-tracking tool built with a simple moving average (SMA) as the central line and two ATR-based bands.
This indicator uses the moving average to track the trend and uses the ATR (Average True Range) to adjust the channel width based on current market volatility:
- In high-volatility markets, the channels widen;
- In low-volatility markets, the channels narrow.
Uptrend Scenario
In the 5-minute chart of the EUR/AUD pair, a bullish reversal signal occurs when the price breaks below the lower band and then re-enters the channel.
If a bullish reversal candlestick appears along with positive divergence in indicators like RSI or MACD, it reinforces the potential end of the oversold phase and the start of an upward movement.
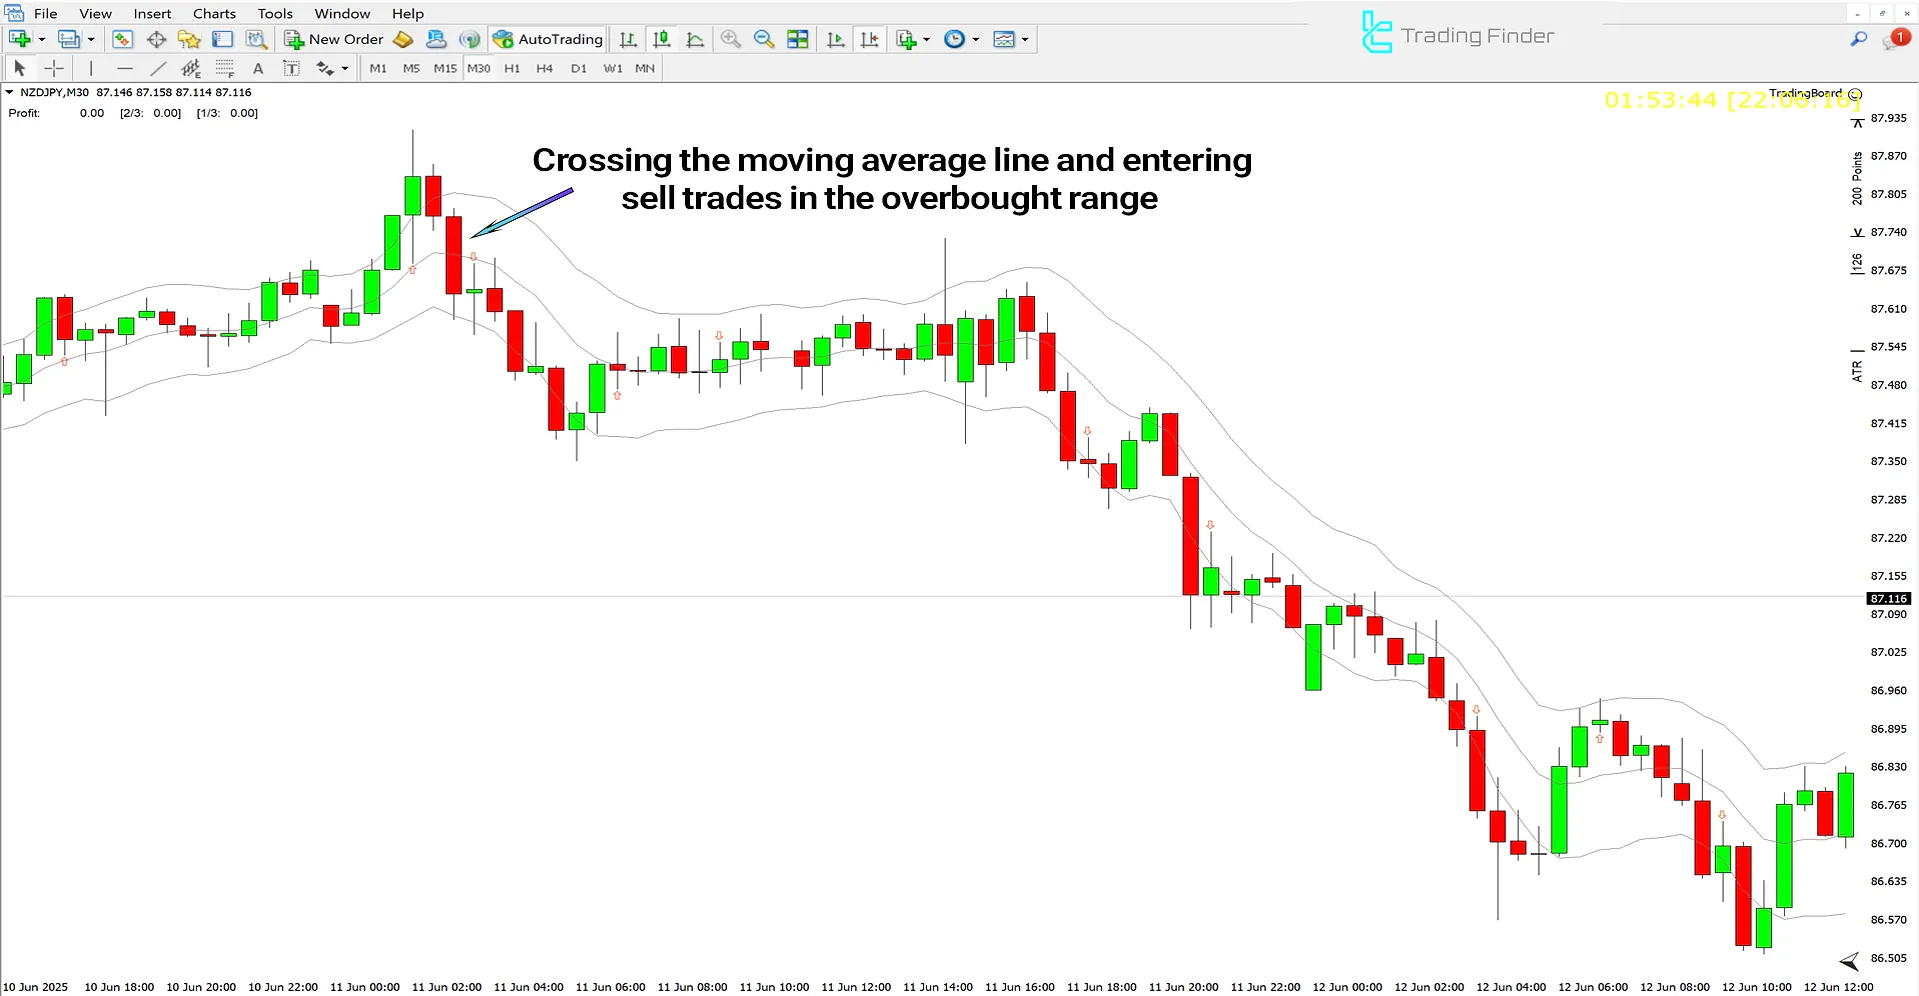
Downtrend Scenario
The price chart below shows the NZD/JPY currency pair on a 30-minute timeframe. In this trading tool, when the price returns to the channel after breaking above the upper band, it may indicate a weakening bullish momentum and a possible price reversal.
If this return is accompanied by bearish reversal candlesticks, it provides a strong signal to consider entering sell positions.
Keltner Channels Trading Indicator Settings
The settings panel of the Keltner Channels Trading Indicator is shown in the image below:
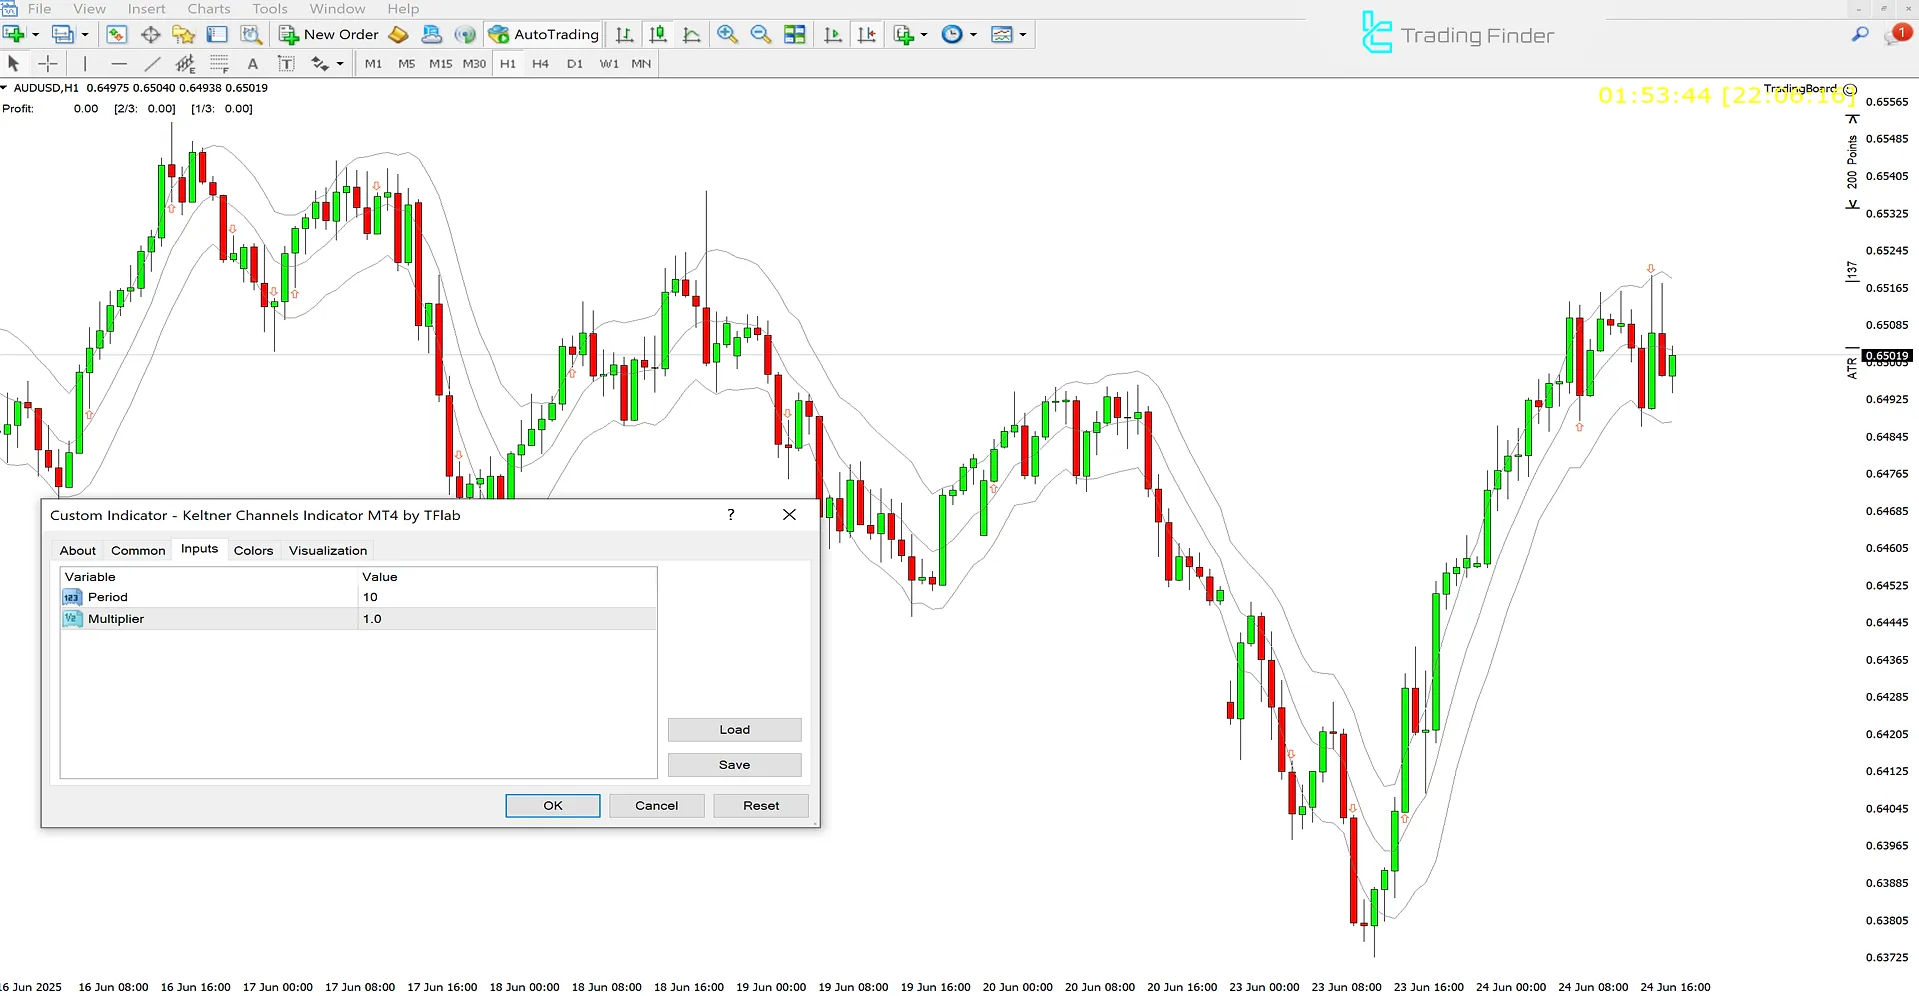
- Period: The lookback period
- Multiplier: Multiplier for ATR-based bands
Conclusion
When price returns into the Keltner Channel after breaking the bands especially when combined with reversal candlesticks and divergence it signals a potential trend reversal.
In overbought zones (upper band), these signals usually lead to sell opportunities, and in oversold zones (lower band), they often indicate buy opportunities.
Keltner Channels MT4 PDF
Keltner Channels MT4 PDF
Click to download Keltner Channels MT4 PDFHow can divergence be used to strengthen the signals of the Keltner Channels Indicator?
When the price moves outside the upper band and negative divergence is observed—or when the price drops below the lower band and positive divergence appears—the likelihood of a price reversal significantly increases.
In the Keltner Channels Indicator, what does it mean when the price fluctuates between the bands and the EMA line is flat?
This scenario indicates a sideways or non-trending market condition in the Keltner Channels Indicator.


