![Download MMR Indicator [a Combination of 4 Indicators: MACD, EMA, LWMA, and RSI] MT4](https://cdn.tradingfinder.com/image/453712/2-101-en-mmr-mt4-1.webp)
![Download MMR Indicator [a Combination of 4 Indicators: MACD, EMA, LWMA, and RSI] MT4 0](https://cdn.tradingfinder.com/image/453712/2-101-en-mmr-mt4-1.webp)
![Download MMR Indicator [a Combination of 4 Indicators: MACD, EMA, LWMA, and RSI] MT4 1](https://cdn.tradingfinder.com/image/453699/2-101-en-mmr-mt4-2.webp)
![Download MMR Indicator [a Combination of 4 Indicators: MACD, EMA, LWMA, and RSI] MT4 2](https://cdn.tradingfinder.com/image/453710/2-101-en-mmr-mt4-3.webp)
![Download MMR Indicator [a Combination of 4 Indicators: MACD, EMA, LWMA, and RSI] MT4 3](https://cdn.tradingfinder.com/image/453711/2-101-en-mmr-mt4-4.webp)
The MMR Indicator on MetaTrader 4 is a combination of four technical analysis tools: MACD, EMA, LWMA, and the RSI indicator.
The output of this trading tool is displayed as a histogram, which marks potential trade entry zones with green and red bars depending on the market trend direction.
By merging four analytical tools, the MMR Indicator reduces signal noise and provides a clearer view of market conditions.
MMR Indicator Table
The general specifications of the MMR Combined Indicator are presented in the table below.
Indicator Categories: | Oscillators MT4 Indicators Currency Strength MT4 Indicators Momentum Indicators in MT4 MACD Indicators for MetaTrader 4 |
Platforms: | MetaTrader 4 Indicators |
Trading Skills: | Intermediate |
Indicator Types: | Reversal MT4 Indicators |
Timeframe: | Multi-Timeframe MT4 Indicators |
Trading Style: | Intraday MT4 Indicators |
Trading Instruments: | Stock Market MT4 Indicators Cryptocurrency MT4 Indicators Forex MT4 Indicators |
Indicator Overview
The MMR Indicator draws a colored histogram on the chart by combining four analytical components.
- Green bars above the zero line indicate a dominant bullish condition;
- Red bars below the zero line reflect a bearish trend.
These bars are formed based on the average results of the underlying indicators, accurately depicting the market’s strength and direction.
Uptrend Conditions
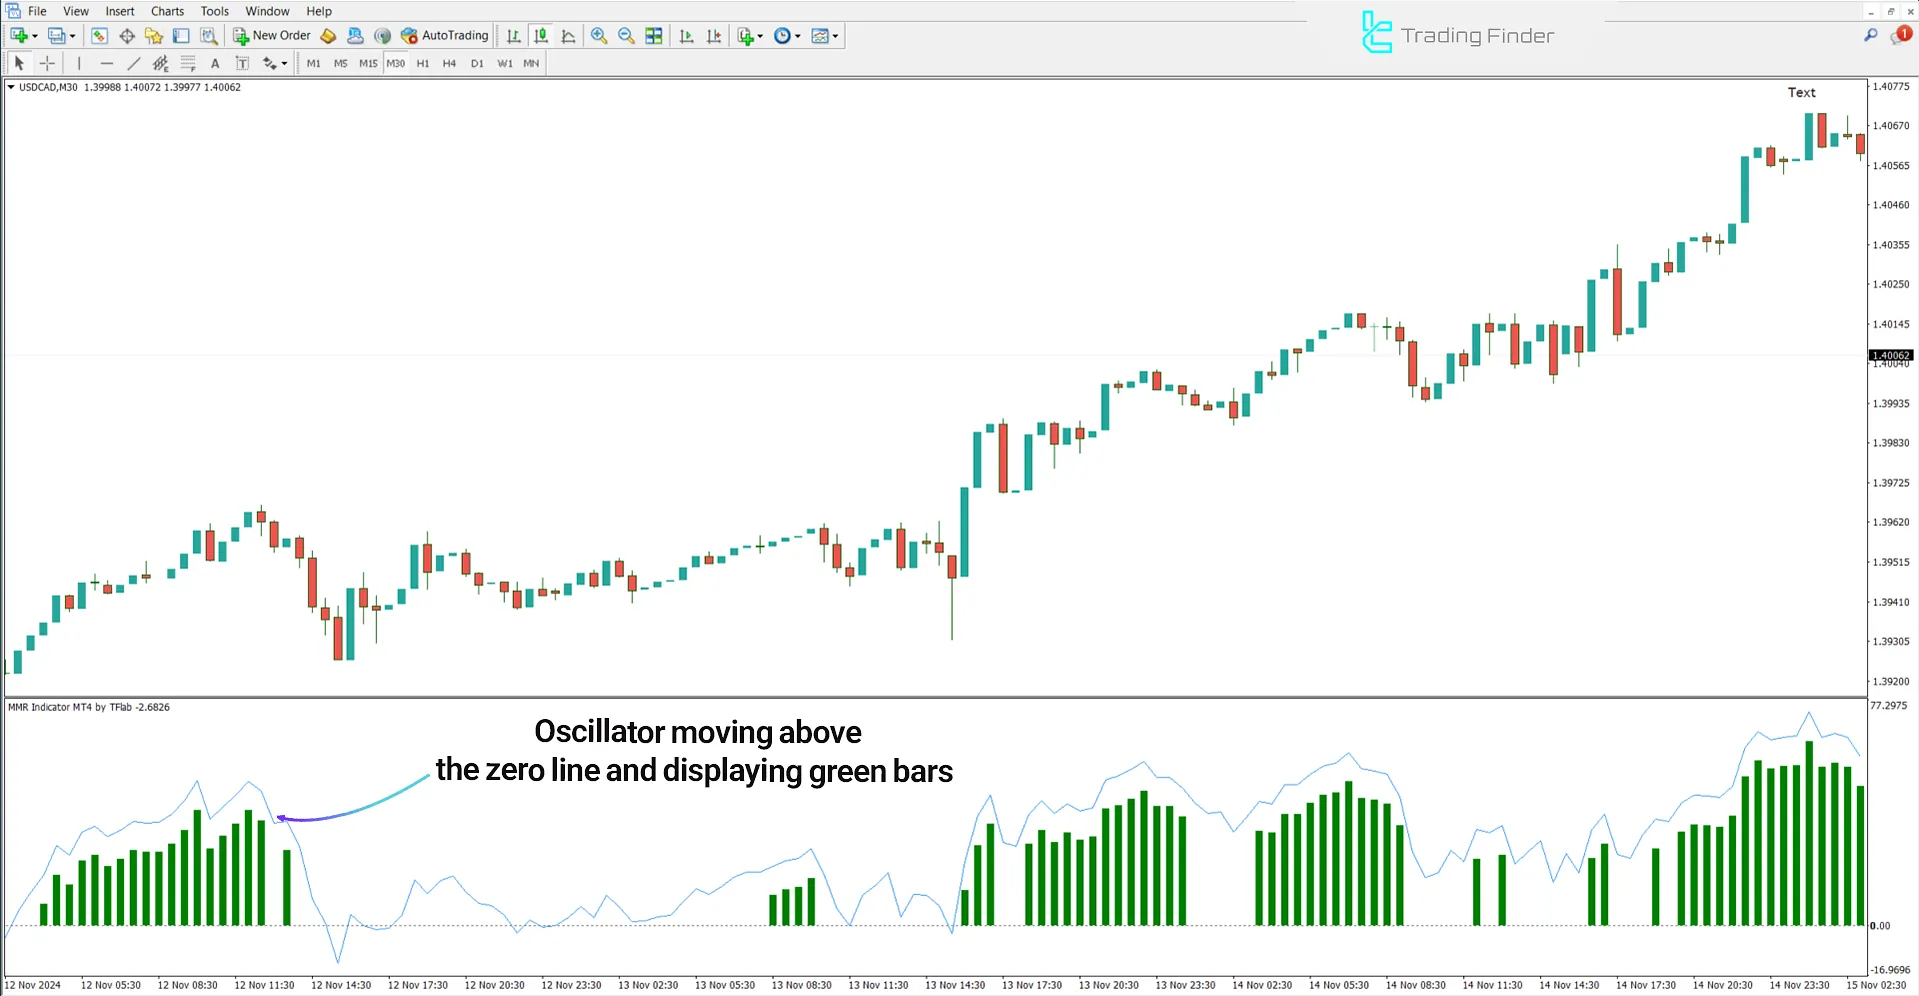
The following price chart displays the USD/CAD currency pair in a 30-minute timeframe. In this oscillator, the RSI exiting the oversold zone signals a weakening of selling pressure and a potential trend reversal.
Simultaneously, a bullish crossover in MACD and the price breaking above the EMA or LWMA confirm the trend reversal signal.
Once a green bar forms above the zero line in MMR and the candlestick color turns green, a suitable buy zone is established.

Downtrend Conditions
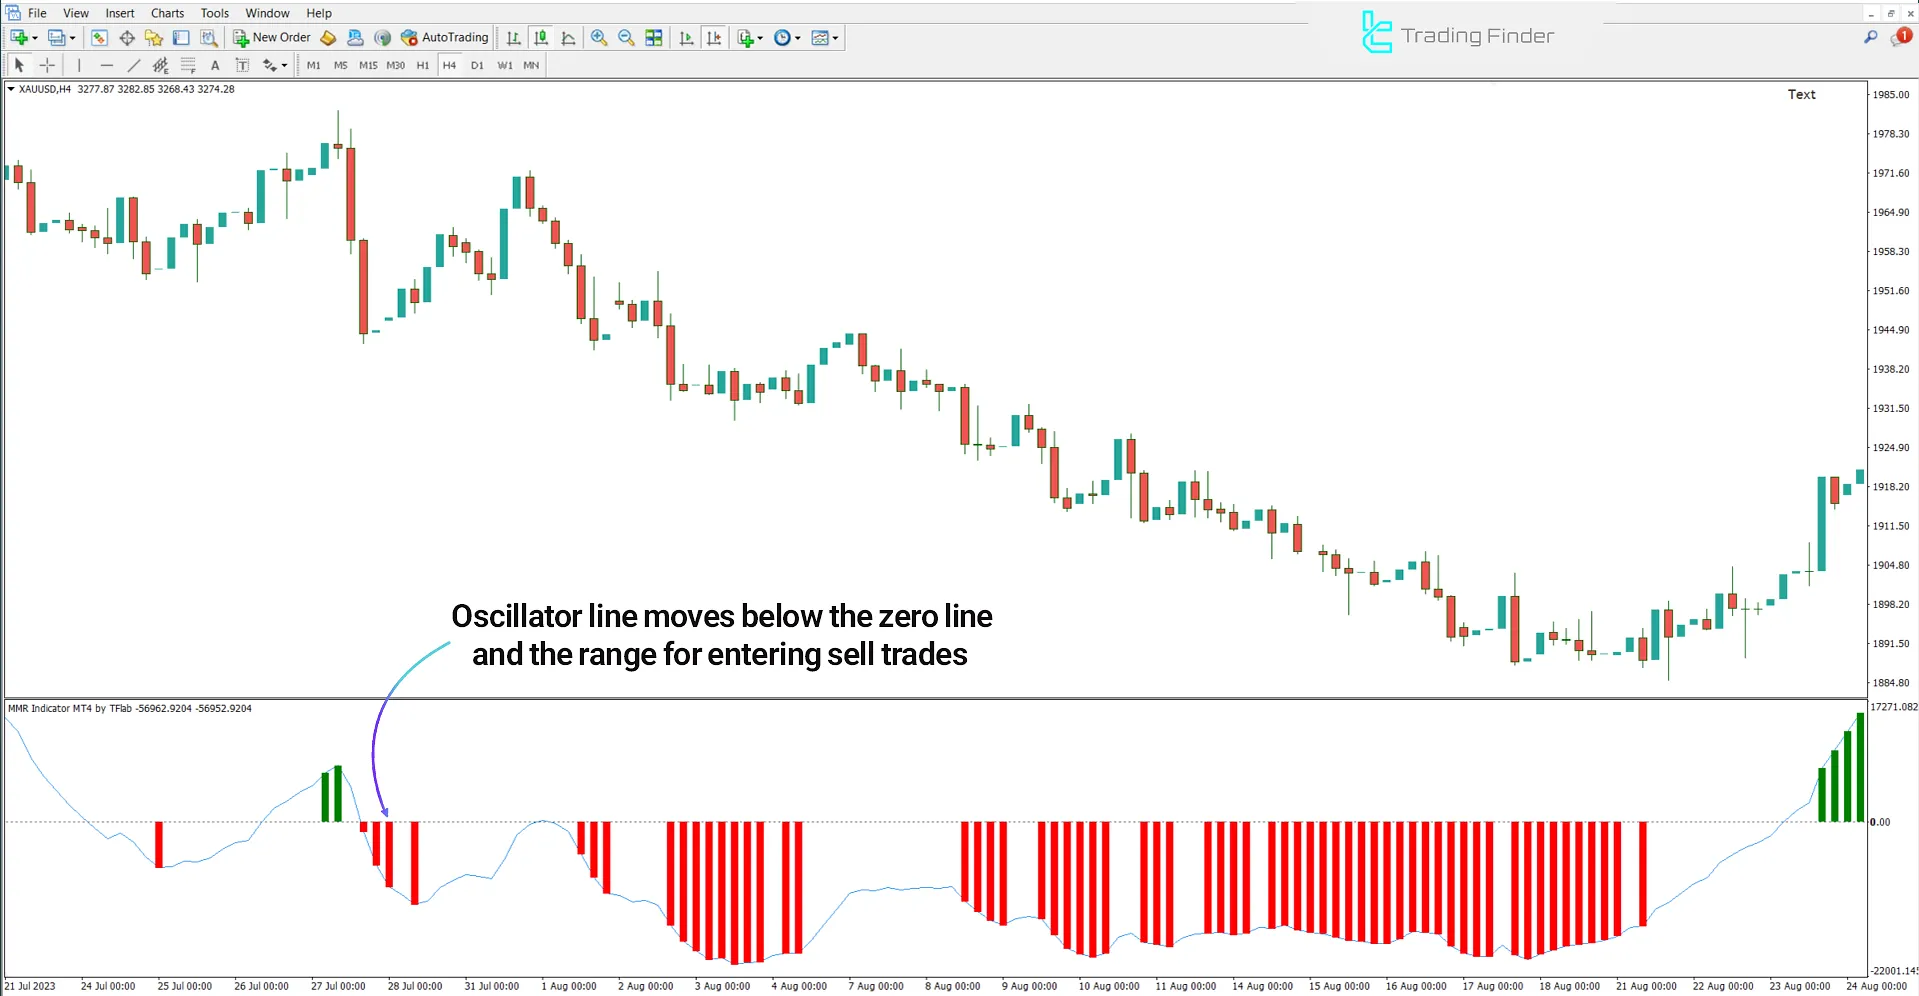
The chart below shows Gold (XAU/USD) in a 4-hour timeframe. Once the RSI exits the overbought zone, early signs of weakening buying pressure appear.
A negative histogram line, aligned with the price closing below the moving averages EMA or LWMA, indicates a shift in market direction.
The formation of a red bar below the zero line in the MMR histogram, accompanied by a red candlestick, marks a sell entry zone.

MMR Indicator Settings
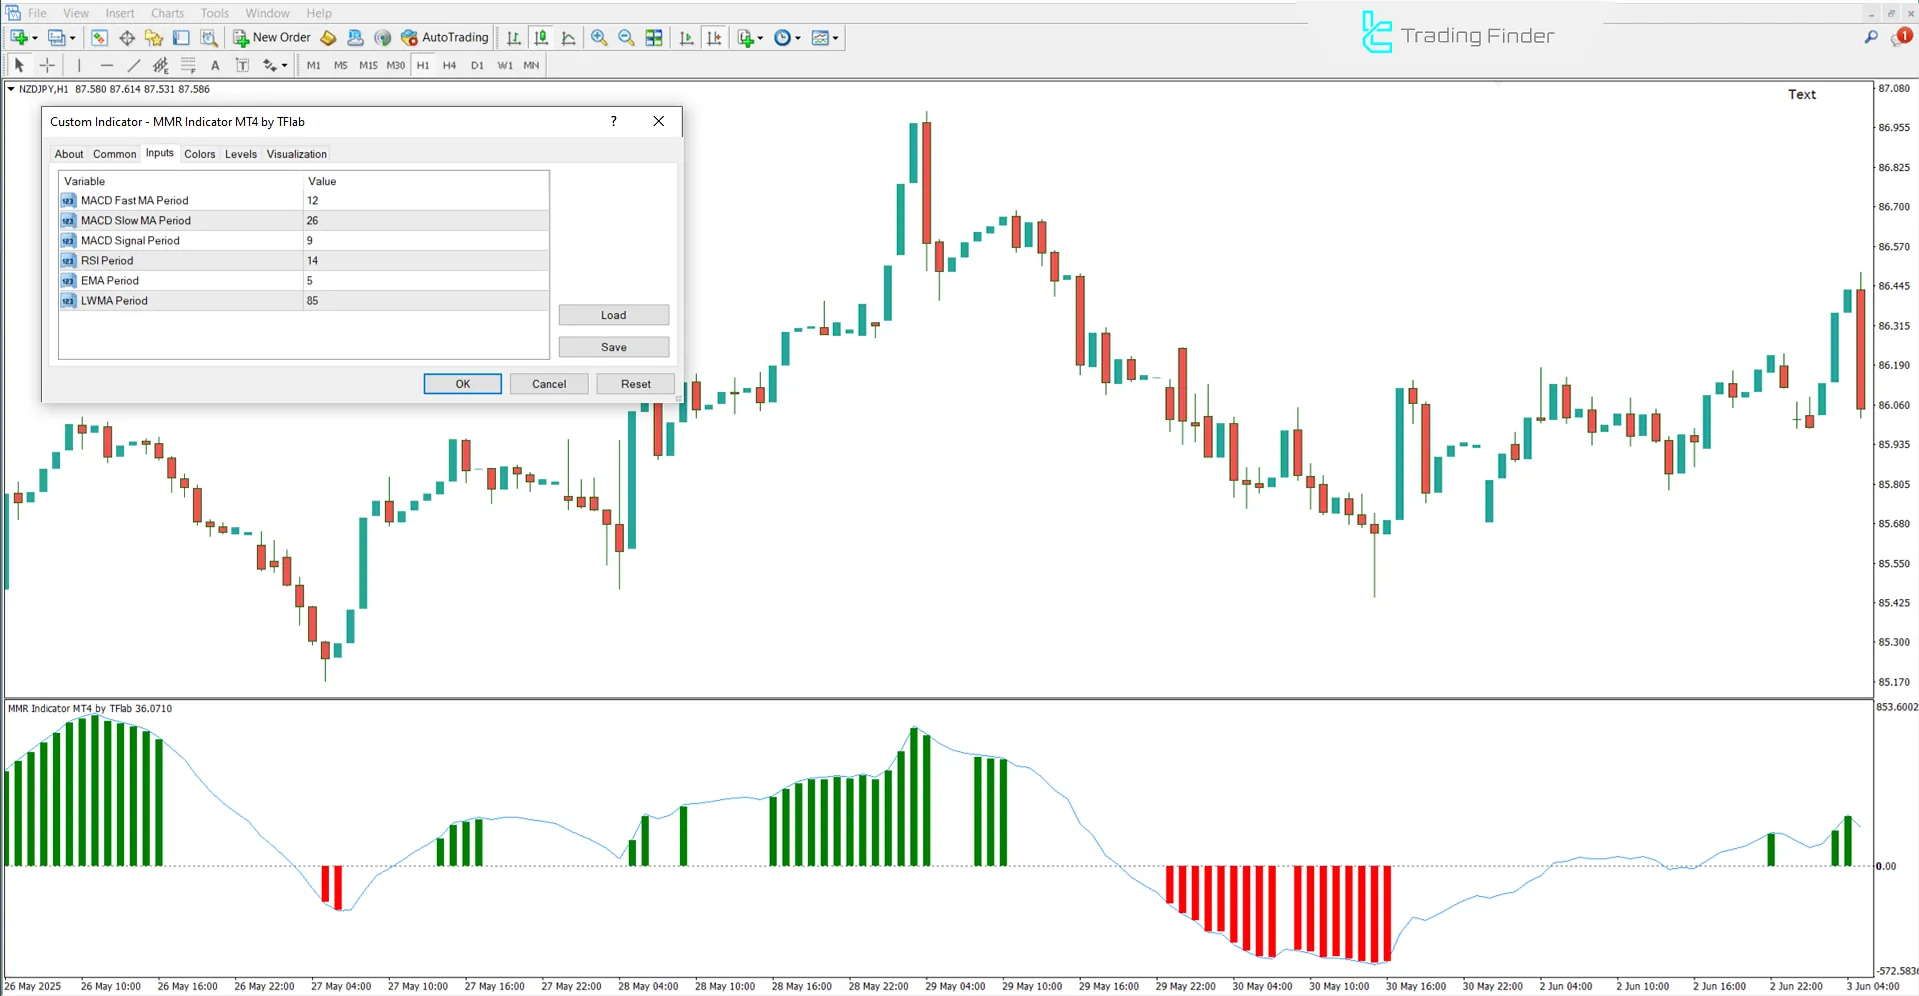
The image below shows the settings panel of the MMR oscillator in trading:

- MACD Fast MA Period: Fast Moving Average Period in MACD;
- MACD Slow MA Period: Slow Moving Average Period in MACD;
- MACD Signal Period: Signal Line Calculation Period in MACD;
- RSI Period: Standard RSI Period;
- EMA Period: Exponential Moving Average Period;
- LWMA Period: Linear Weighted Moving Average Period.
Conclusion
The MMR Combined Indicator, leveraging four technical analysis, is a valuable tool for trend and momentum analysis. This oscillator displays price direction and trade entry and exit zones via clear green and red histograms.
MMR A Combination of 4 Indicators MACD MT4 PDF
MMR A Combination of 4 Indicators MACD MT4 PDF
Click to download MMR A Combination of 4 Indicators MACD MT4 PDFIs the MMR Indicator suitable for all timeframes?
Yes, this oscillator can be used across all time intervals.
Is the MMR Indicator suitable for generating entry or exit signals?
No, the MMR Indicator does not directly generate entry or exit signals.


