

![Percentage Volume Oscillator MT4 Download - Free - [TradingFinder]](https://cdn.tradingfinder.com/image/135517/13-44-en-percentage-volume-oscillator-mt4-1.webp)
![Percentage Volume Oscillator MT4 Download - Free - [TradingFinder] 1](https://cdn.tradingfinder.com/image/135504/13-44-en-percentage-volume-oscillator-mt4-2.webp)
![Percentage Volume Oscillator MT4 Download - Free - [TradingFinder] 2](https://cdn.tradingfinder.com/image/135516/13-44-en-percentage-volume-oscillator-mt4-3.webp)
![Percentage Volume Oscillator MT4 Download - Free - [TradingFinder] 3](https://cdn.tradingfinder.com/image/135515/13-44-en-percentage-volume-oscillator-mt4-4.webp)
The Percentage Volume Oscillator is a volume based oscillator on the MetaTrader 4 platform. This oscillator measures the relative changes in trading volume within financial markets.
Traders can use this trading tool to identify suitable Entry and Exit points and better analyze Uptrends or Downtrends. This indicator includes two moving average lines and a histogram, displayed separately from the price chart.
Indicator Specifications Table
|
Indicator Categories:
|
Oscillators MT4 Indicators
Volatility MT4 Indicators
Trading Assist MT4 Indicators
|
|
Platforms:
|
MetaTrader 4 Indicators
|
|
Trading Skills:
|
Advanced
|
|
Indicator Types:
|
Reversal MT4 Indicators
|
|
Timeframe:
|
Multi-Timeframe MT4 Indicators
|
|
Trading Style:
|
Intraday MT4 Indicators
|
|
Trading Instruments:
|
Share Stocks MT4 Indicators
Forward Market MT4 Indicators
Indices Market MT4 Indicators
Commodity Market MT4 Indicators
Stock Market MT4 Indicators
Cryptocurrency MT4 Indicators
Forex MT4 Indicators
|
Percentage Volume Indicator at a Glance
This indicator displays the difference between two moving averages as a histogram. When the fluctuations are in the positive phase, the histogram is green, and when in the negative phase, it turns red. The Percentage Volume Oscillator also helps traders identify trend reversal points.
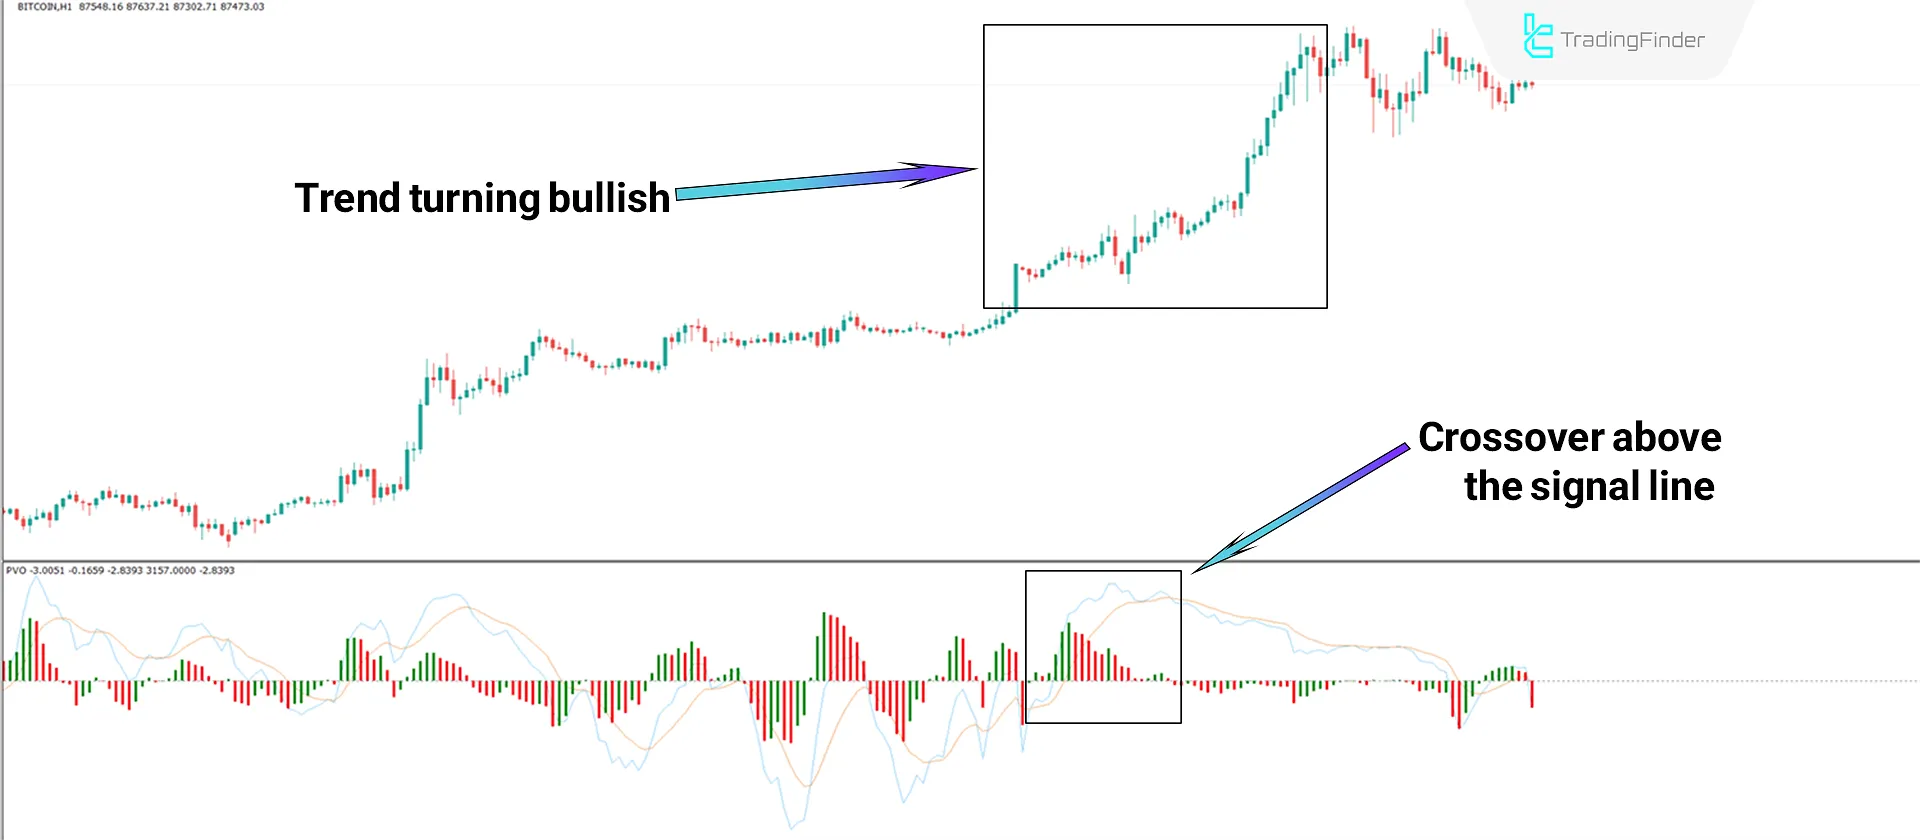
Bullish Trend Conditions
The 1-hour timeframe price chart of Bitcoin (BTC) demonstrates the indicator’s behavior under bullish trend conditions. As illustrated, the moving average line (blue line) crosses above the signal line (orange line) and oscillates in the positive phase (above zero).
The difference between these two moving averages is also shown using the histogram. In such conditions, a green histogram indicates that the trend remains bullish.
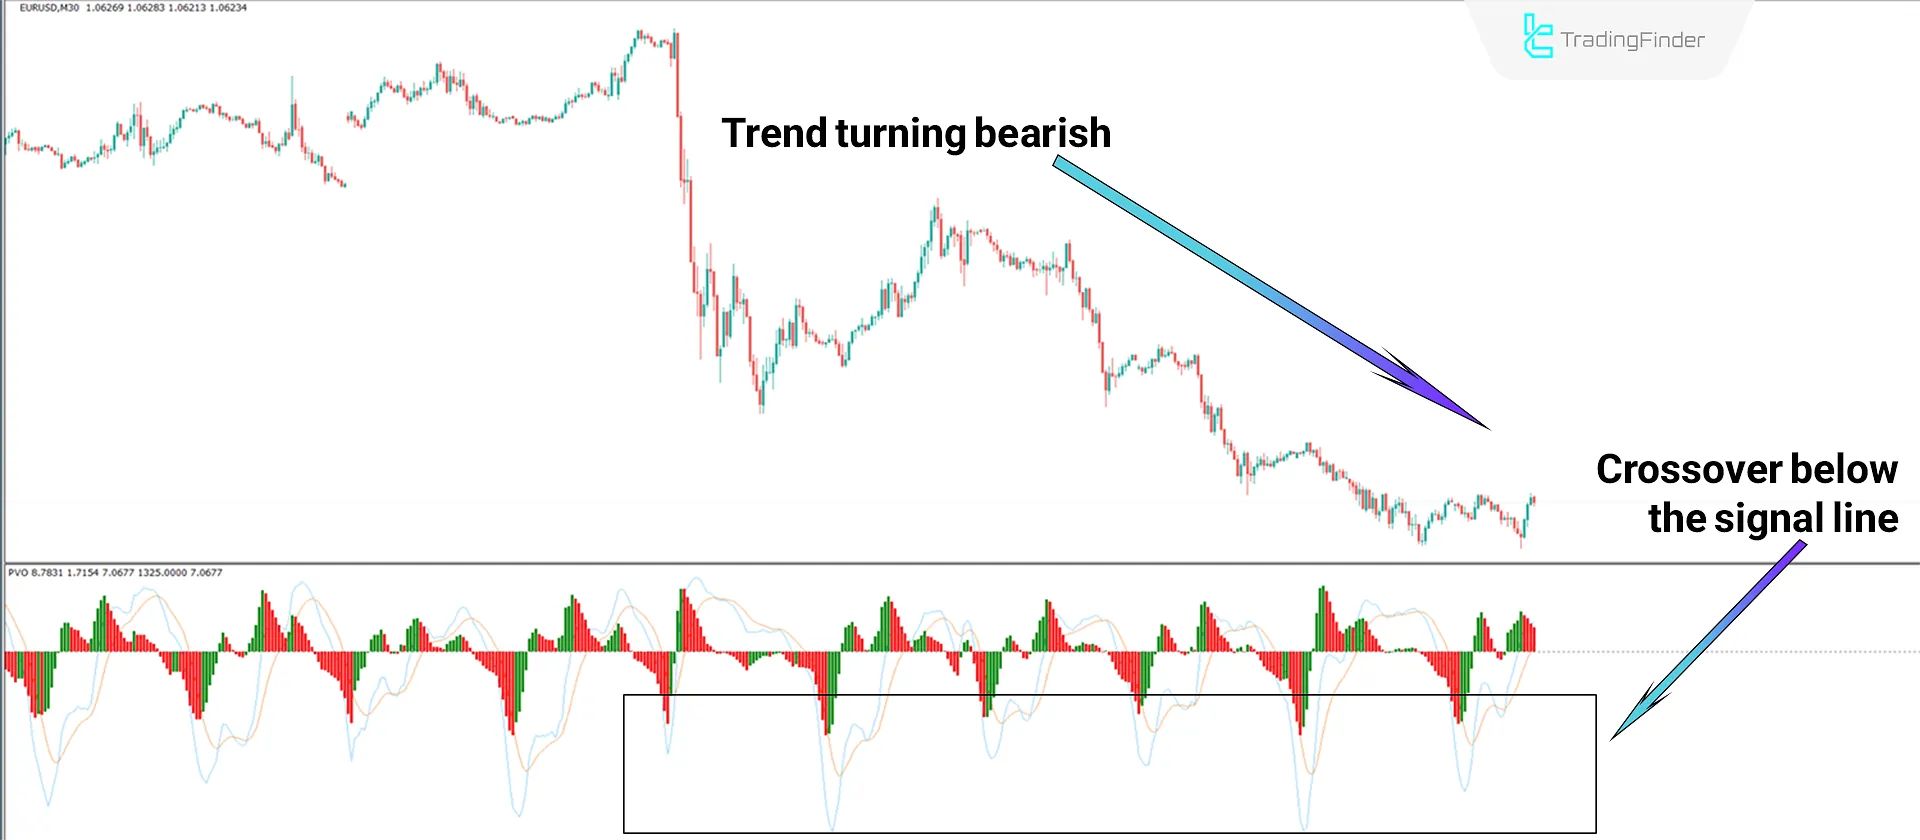
Bearish Trend Conditions
According to the 30-minute timeframe price chart of the EUR/USD currency pair, the moving average line (blue line) crosses below the signal line (orange line) and oscillates in the negative phase (below zero). The difference between these two moving averages is also displayed with the histogram. In such conditions, a red histogram indicates that the trend remains bearish.
Indicator Settings
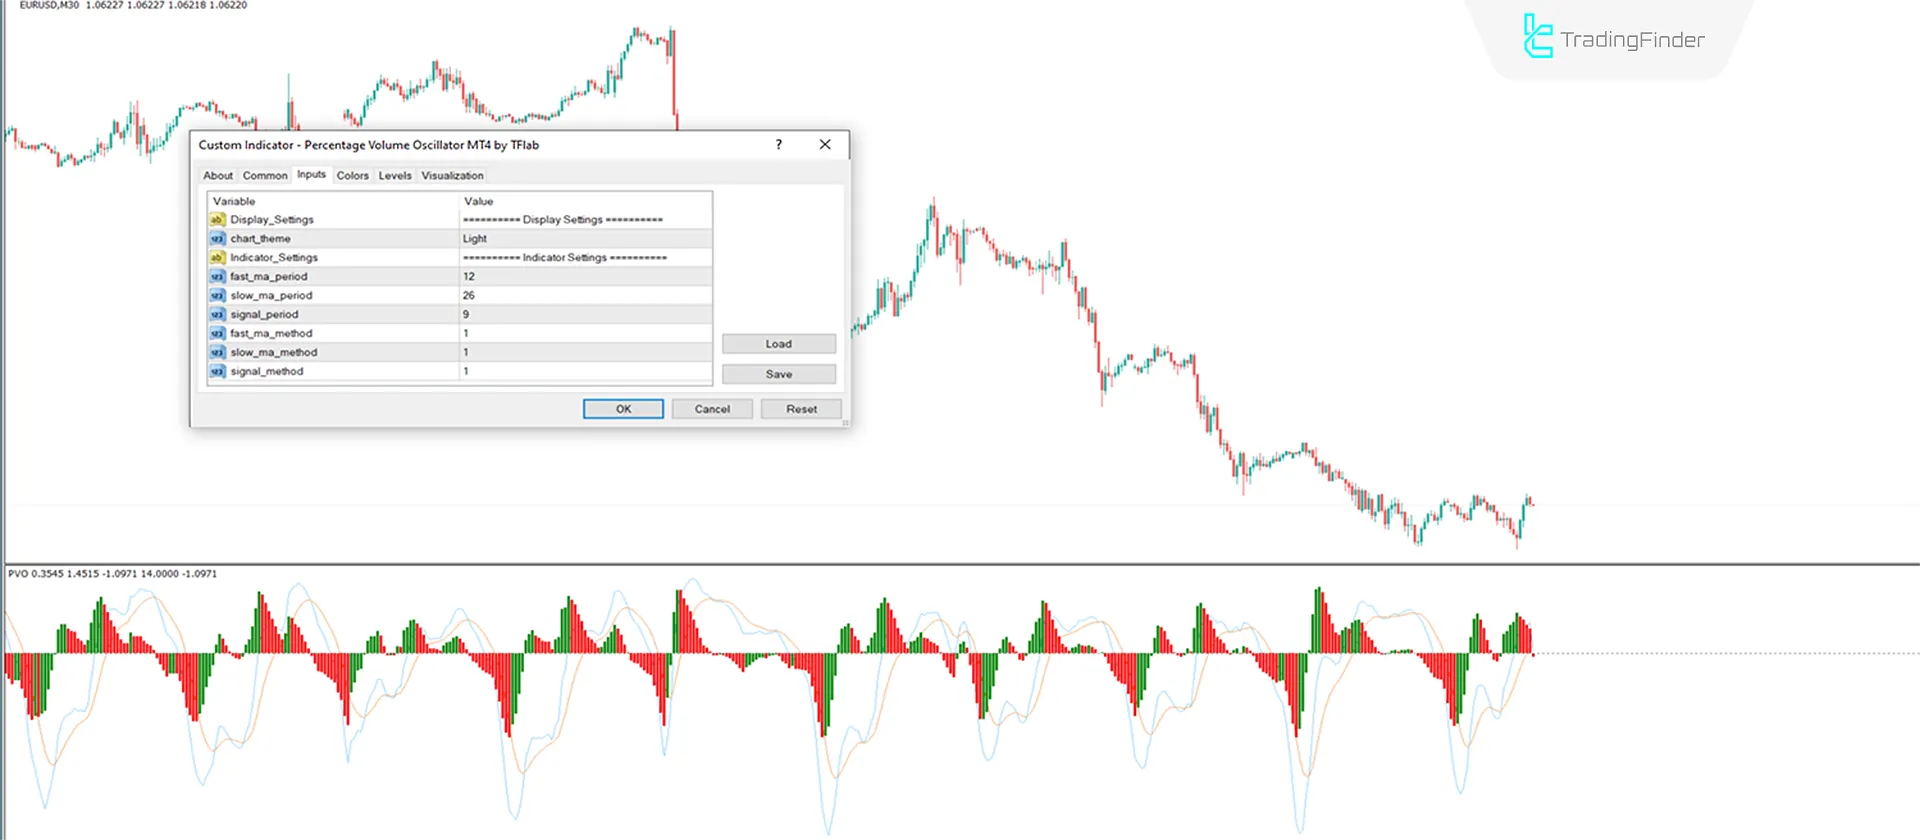
- Chart theme: Indicator theme;
- Fast ma period: Fast moving average period set to 12;
- Slow ma period: Slow moving average period set to 26;
- Signal period: Signal line period set to 9;
- Fast ma method: Fast moving average calculation method set to 1;
- Slow ma method: Slow moving average calculation method set to 1;
- Signal method: Signal calculation method set to 1.
Conclusion
The Percentage Volume Oscillator in MetaTrader 4 is a powerful tool for technical analysis. Traders can use this volatility indicator to analyze volume relatively and in conjunction with other analytical tools, such as trend indicators, to gain a clear understanding of volume flow in the market.
Percentage Volume Oscillator MT4 PDF
Percentage Volume Oscillator MT4 PDF
Click to download Percentage Volume Oscillator MT4 PDFDoes this indicator provide entry signals for trades?
No, this indicator does not provide any signals for trade entries.
What is the suitable timeframe for using this indicator?
The Percentage Volume Oscillator is multi-timeframe and works across all timeframes.