![Sideway Trend Indicator for MetaTrader 4 - Free - [TradingFinder]](https://cdn.tradingfinder.com/image/163811/4-28-en-sideway-trend-mt4-1.webp)
![Sideway Trend Indicator for MetaTrader 4 - Free - [TradingFinder] 0](https://cdn.tradingfinder.com/image/163811/4-28-en-sideway-trend-mt4-1.webp)
![Sideway Trend Indicator for MetaTrader 4 - Free - [TradingFinder] 1](https://cdn.tradingfinder.com/image/163778/4-28-en-sideway-trend-mt4-2.webp)
![Sideway Trend Indicator for MetaTrader 4 - Free - [TradingFinder] 2](https://cdn.tradingfinder.com/image/163779/4-28-en-sideway-trend-mt4-3.webp)
![Sideway Trend Indicator for MetaTrader 4 - Free - [TradingFinder] 3](https://cdn.tradingfinder.com/image/163780/4-28-en-sideway-trend-mt4-4.webp)
The Sideway Trend Indicator is one of the key tools in MetaTrader 4 indicators that helps identify trendless (range or neutral) market periods.
This MetaTrader 4 oscillator provides clear trading signals for entry into trades as soon as the market exits the range condition. It helps traders enter the market with greater accuracy under optimal conditions.
Sideway Trend Indicator Specifications
The table below is dedicated to reviewing the features and capabilities of this indicator:
Indicator Categories: | Oscillators MT4 Indicators Signal & Forecast MT4 Indicators Trading Assist MT4 Indicators |
Platforms: | MetaTrader 4 Indicators |
Trading Skills: | Intermediate |
Indicator Types: | Range MT4 Indicators Leading MT4 Indicators |
Timeframe: | Multi-Timeframe MT4 Indicators |
Trading Style: | Day Trading MT4 Indicators |
Trading Instruments: | Share Stocks MT4 Indicators Stock Market MT4 Indicators Cryptocurrency MT4 Indicators Forex MT4 Indicators |
Indicator at a Glance
The "Sideway Trend" indicator is similar to the classic RSI index, with the difference that its values oscillate within a range between -1 to 1. By displaying neutral zones in green, it helps traders identify market periods lacking a clear trend.
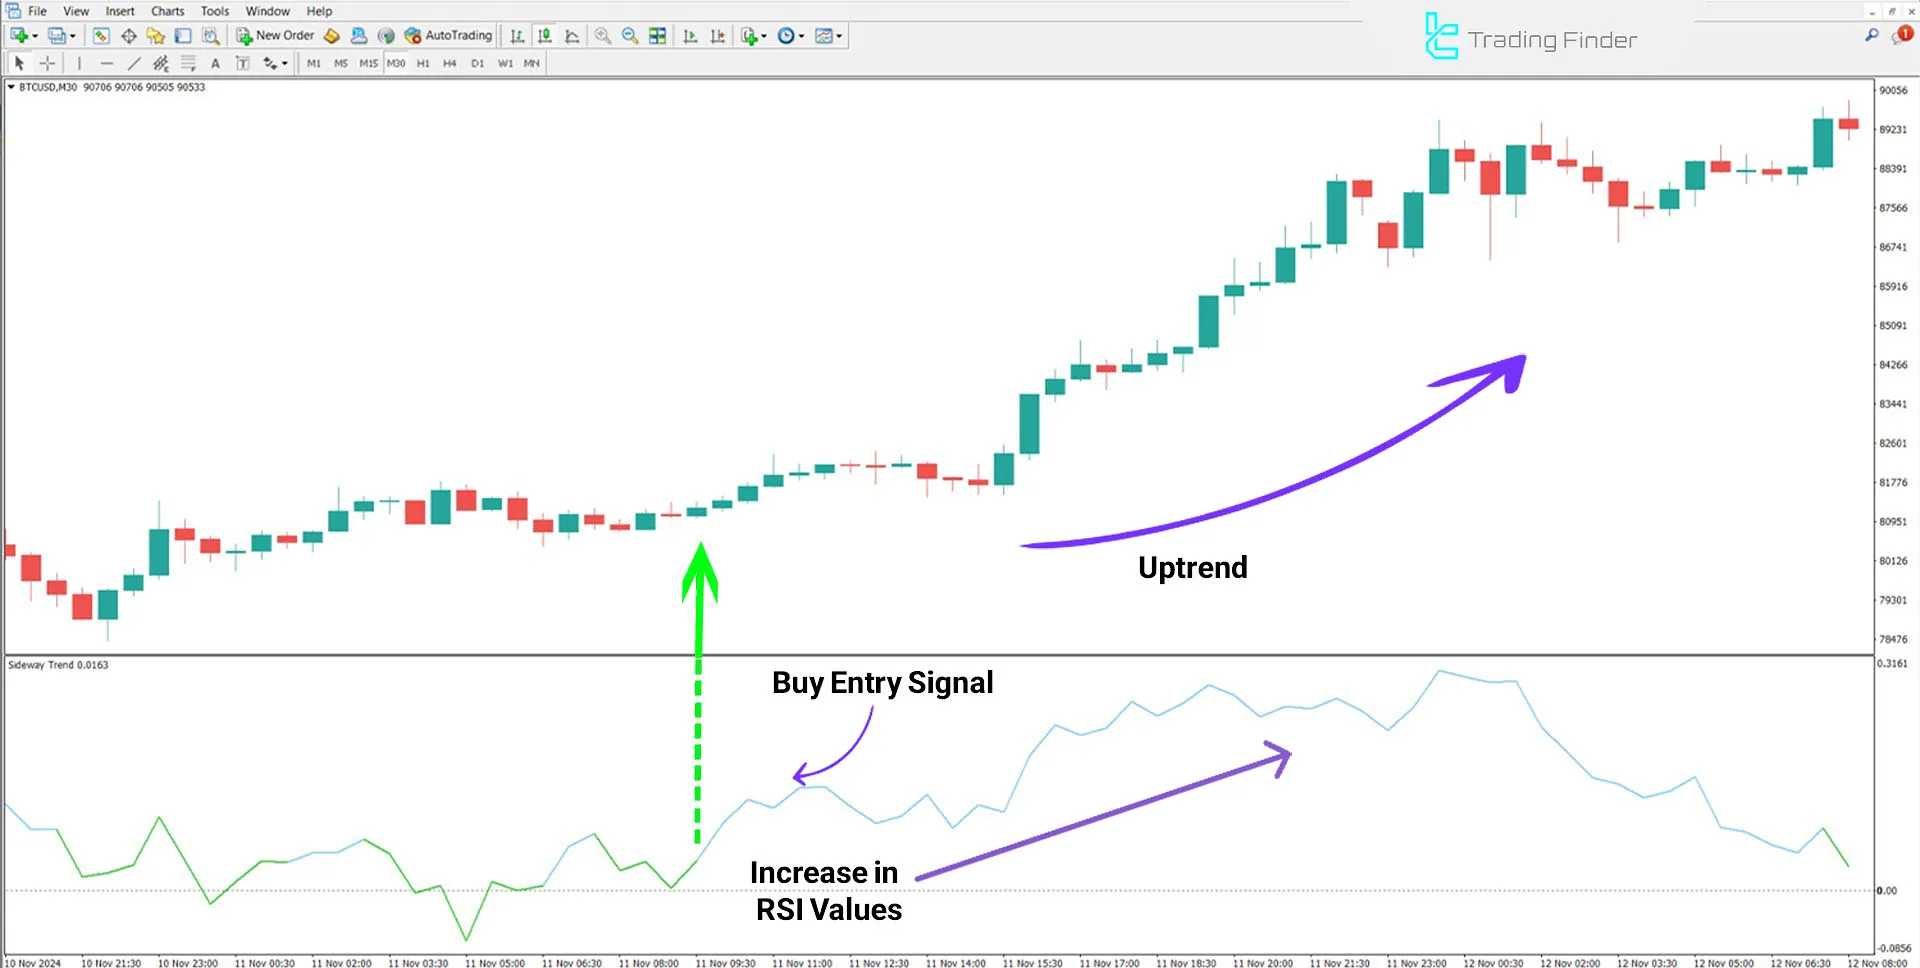
Indicator in Uptrend
When the indicator line exits the neutral zone and moves upwards, its color changes to blue, indicating the start of an uptrend.
This signal demonstrates increased buying pressure in the market and suggests a potential price rise. Traders can use this opportunity to enter the market in the uptrend.

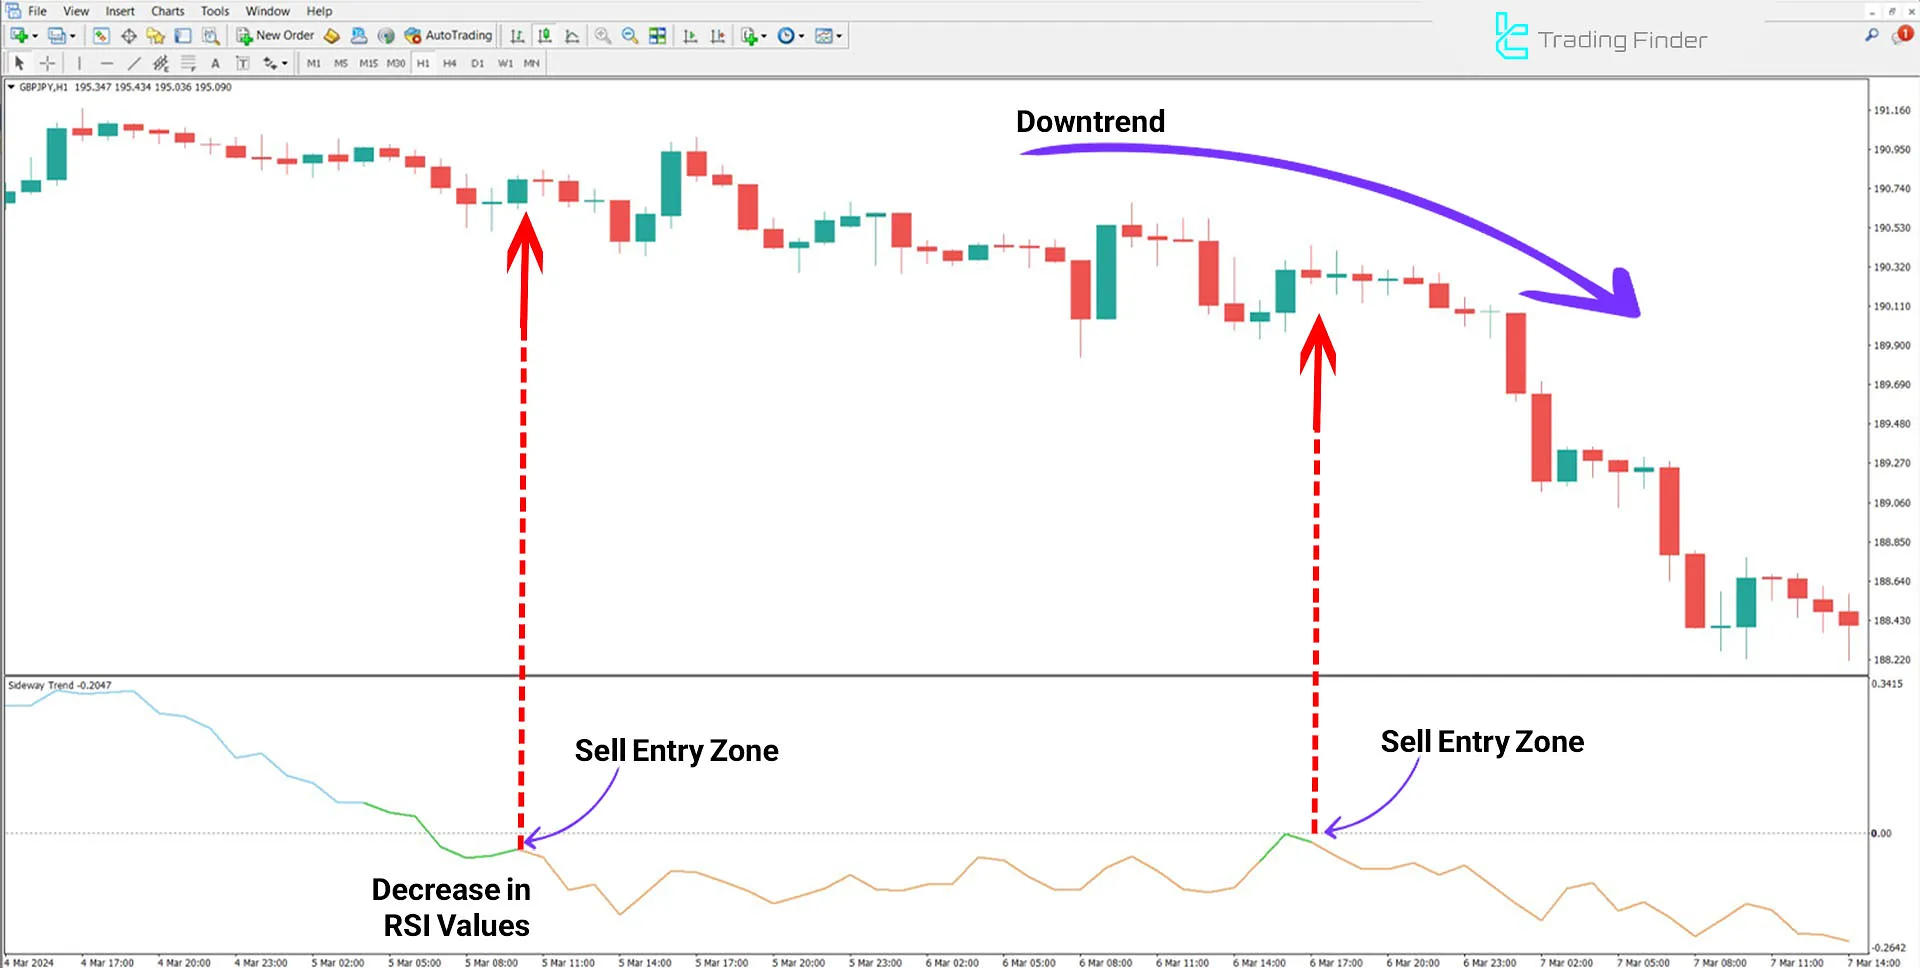
Indicator in Downtrend
Once the indicator line exits the green zone (neutral zone), it changes to red, indicating the start of a downtrend.
This state reflects increased selling pressure in the market, enabling traders to take advantage of selling opportunities (Sell) and profit from falling prices.

Sideway Trend Indicator Settings
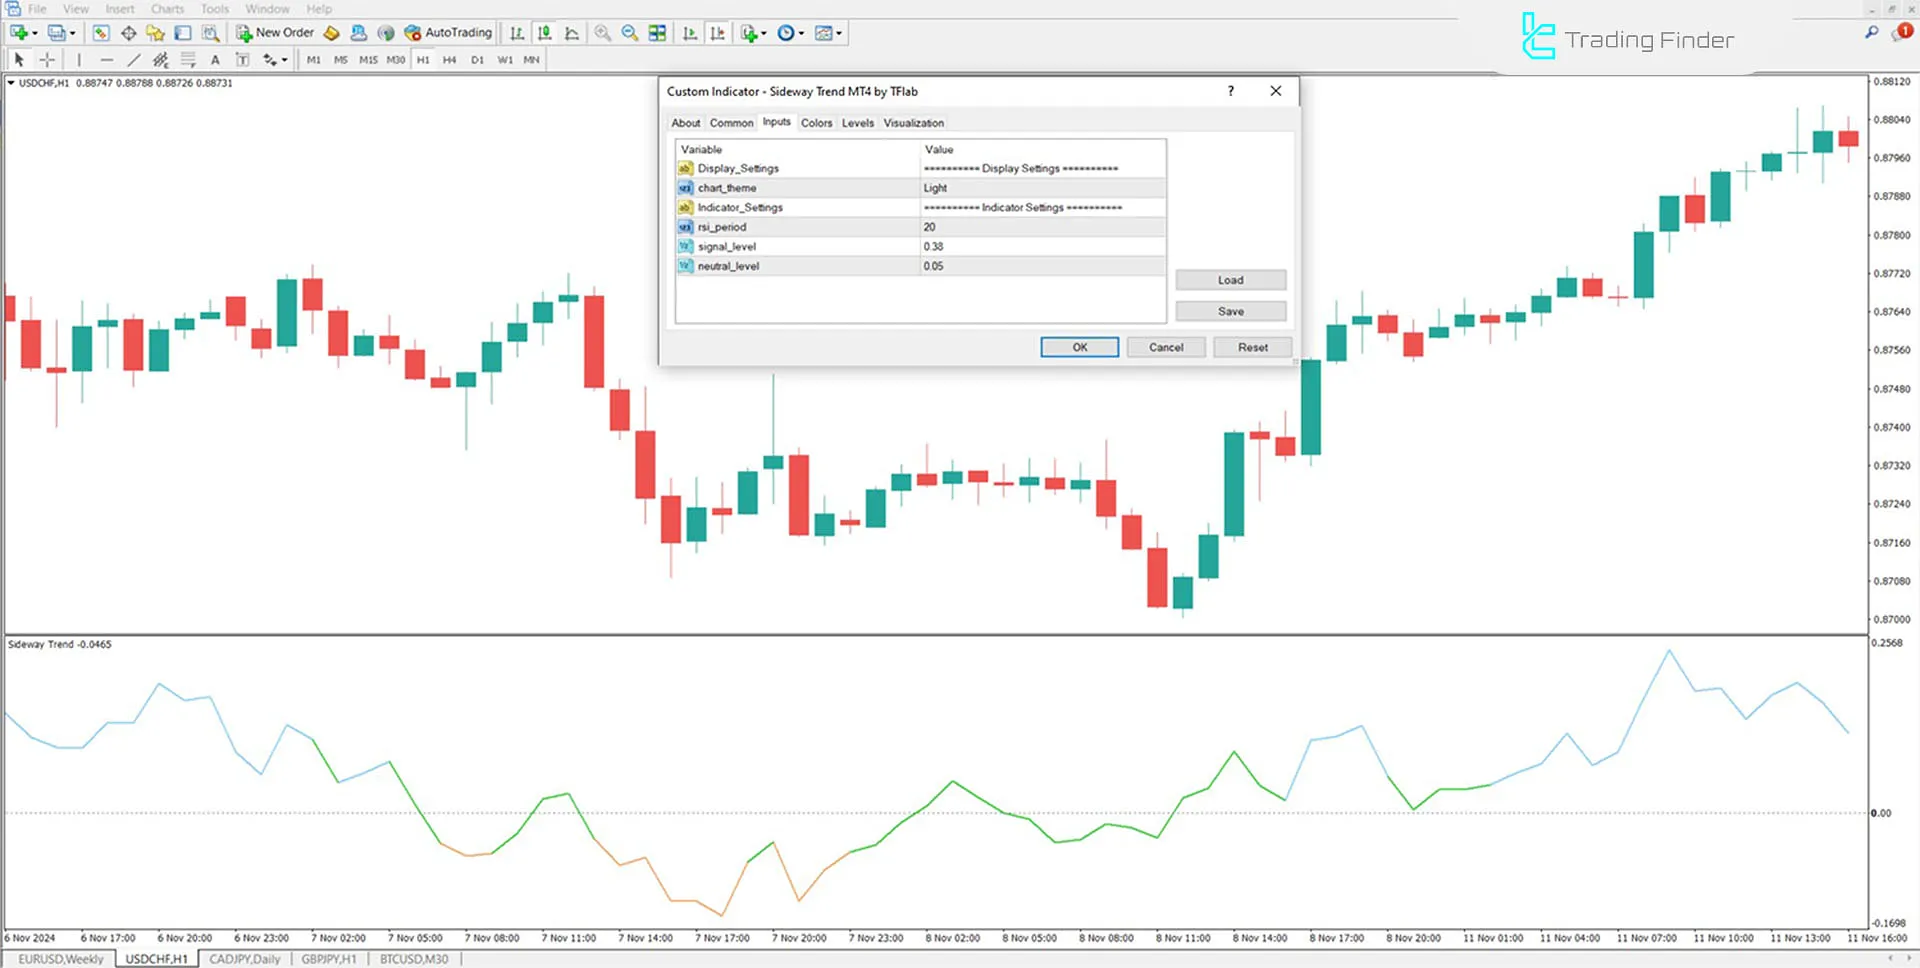
The image below shows the indicator settings:

- Chart Theme: Indicator background image;
- RSI Period: The calculation period of the indicator; the default value is 20;
- Signal Level: Customizable level on the chart; the default value is 0.38;
- Neutral Level: Displays the neutral zone; the default value is 0.05.
Conclusion
The "Sideway Trend" Indicator not only provides entry signals for trades but also identifies neutral zones in green, highlighting market periods without a clear trend.
This feature helps traders avoid entering trades under unfavorable conditions.
Sideway Trend MT4 PDF
Sideway Trend MT4 PDF
Click to download Sideway Trend MT4 PDFHow are neutral zones identified in the indicator?
Neutral zones are displayed in green on the chart, helping traders avoid entering trades in unfavorable conditions.
Which time frames does the indicator work in?
The indicator is usable across various time frames (multi-time frame).


