![Supply and Demand Zones Indicator for MT4 Download - [TradingFinder]](https://cdn.tradingfinder.com/image/270066/2-38-en-supply-and-demand-zones-mt4-1.webp)
![Supply and Demand Zones Indicator for MT4 Download - [TradingFinder] 0](https://cdn.tradingfinder.com/image/270066/2-38-en-supply-and-demand-zones-mt4-1.webp)
![Supply and Demand Zones Indicator for MT4 Download - [TradingFinder] 1](https://cdn.tradingfinder.com/image/270067/2-38-en-supply-and-demand-zones-mt4-2.webp)
![Supply and Demand Zones Indicator for MT4 Download - [TradingFinder] 2](https://cdn.tradingfinder.com/image/270068/2-38-en-supply-and-demand-zones-mt4-3.webp)
![Supply and Demand Zones Indicator for MT4 Download - [TradingFinder] 3](https://cdn.tradingfinder.com/image/270069/2-38-en-supply-and-demand-zones-mt4-4.webp)
The Supply and Demand Zones indicator in the MetaTrader 4 platform is one of the essential tools for technical analysis. It draws strong supply and demand zones.
This MT4 supply and demand indicator automatically identifies past strong demand zones (support areas) or strong supply zones (resistance areas) and highlights them using colored bars.
Supply and Demand Zone Specifications Table
The specifications of the "Supply and Demand Zones Indicator" are presented in the table below:
|
Indicator Categories:
|
Support & Resistance MT4 Indicators
Supply & Demand MT4 Indicators
Levels MT4 Indicators
|
|
Platforms:
|
MetaTrader 4 Indicators
|
|
Trading Skills:
|
Intermediate
|
|
Indicator Types:
|
Reversal MT4 Indicators
|
|
Timeframe:
|
Multi-Timeframe MT4 Indicators
|
|
Trading Style:
|
Intraday MT4 Indicators
|
|
Trading Instruments:
|
Forward Market MT4 Indicators
Stock Market MT4 Indicators
Cryptocurrency MT4 Indicators
Forex MT4 Indicators
|
The provided code is intended for educational purposes to demonstrate concepts and logic, and is not a final or ready-to-use version.
        //+------------------------------------------------------------------+
//| Supply and Demand Zones Indicator - Core Implementation          |
//| Copyright TradingFinder.com - 2023-2025                          |
//+------------------------------------------------------------------+

// Structure for storing zone information
struct Blocks {
   datetime BlockStartTime;  // Zone start time
   int      BlockType;       // 1=support, 2=resistance
   double   BlockHigh;       // Upper price level
   double   BlockLow;        // Lower price level
   datetime BlockEndTime;    // When zone becomes invalid
   bool     BlockTouched;    // Zone has been retested
   color    BlockColor;      // Visual color
};

// Main input parameters (simplified)
input bool  ShowSupport    = true;         // Show support zones
input bool  ShowResistance = true;         // Show resistance zones
input color ColorSupport   = C'34,177,76'; // Support color
input color ColorResist    = C'237,28,36'; // Resistance color

// Global variables
Blocks blocks[];
datetime Level2Time[];  // Market structure points
double   Level2Price[]; // Price at structure points

//+------------------------------------------------------------------+
//| Checks if a new candle has formed or chart has been moved        |
//+------------------------------------------------------------------+
bool Timer1Check() {
   static datetime Timer1 = 0;
   if(Timer1==0 || Timer1!=iTime(Symbol(),PERIOD_CURRENT,0)) {
      Timer1 = iTime(Symbol(),PERIOD_CURRENT,0);
      return true;
   }
   return false;
}

//+------------------------------------------------------------------+
//| Creates a new zone based on market structure point               |
//+------------------------------------------------------------------+
void CreateNewBlock(int index, int structPoint) {
   blocks[index].BlockStartTime = Level2Time[structPoint];
   blocks[index].BlockEndTime = D'2030.12.31'; // Default end time (far future)

   // Determine if support or resistance based on price action
   if(Level2Price[structPoint] < Level2Price[structPoint-1])
      blocks[index].BlockType = 1; // Support zone
   else
      blocks[index].BlockType = 2; // Resistance zone

   int candle = iBarShift(Symbol(),PERIOD_CURRENT,Level2Time[structPoint]);

   // Set price levels based on type
   if(blocks[index].BlockType == 1) {
      blocks[index].BlockLow = iLow(Symbol(),PERIOD_CURRENT,candle);
      blocks[index].BlockHigh = MathMax(iOpen(Symbol(),PERIOD_CURRENT,candle),
                                      iClose(Symbol(),PERIOD_CURRENT,candle));
      blocks[index].BlockColor = ColorSupport;
   } else {
      blocks[index].BlockHigh = iHigh(Symbol(),PERIOD_CURRENT,candle);
      blocks[index].BlockLow = MathMin(iOpen(Symbol(),PERIOD_CURRENT,candle),
                                     iClose(Symbol(),PERIOD_CURRENT,candle));
      blocks[index].BlockColor = ColorResist;
   }

   // Create visual rectangle for the zone
   string name = "Zone-" + TimeToString(blocks[index].BlockStartTime);
   RectangleCreate(0, name, 0,
                  blocks[index].BlockStartTime, blocks[index].BlockLow,
                  blocks[index].BlockEndTime, blocks[index].BlockHigh,
                  blocks[index].BlockColor, STYLE_SOLID, 1, true);
}

//+------------------------------------------------------------------+
//| Check if zone has been touched or invalidated                    |
//+------------------------------------------------------------------+
void CheckZoneStatus(int zoneIndex) {
   // Implementation details...
   // 1. Check if price moved away from zone
   // 2. Check if price returned to test the zone
   // 3. Check if price broke through (invalidating the zone)
}

//+------------------------------------------------------------------+
//| Main function - identifies and updates zones                     |
//+------------------------------------------------------------------+
void Main() {
   // Get market structure points (simplified)
   GetMarketStructure(Level2Time, Level2Price);

   // Process each structure point
   for(int i=0; i<ArraySize(Level2Time); i++) {
      // Check if this point already has a zone
      bool exists = false;
      for(int j=0; j<ArraySize(blocks); j++) {
         if(Level2Time[i] == blocks[j].BlockStartTime) {
            exists = true;
            break;
         }
      }

      // Create new zone if needed
      if(!exists) {
         int index = ArraySize(blocks);
         ArrayResize(blocks, index+1);
         CreateNewBlock(index, i);
      }
   }

   // Update status of existing zones
   for(int i=0; i<ArraySize(blocks); i++) {
      CheckZoneStatus(i);
   }
}
Indicator Overview
Supply and demand zones are formed based on past price behavior and displayed on the chart using colored bars. These bars remain on the chart until they are automatically filled.
The colored bars of this MT4 support and resistance indicator are divided into two categories:
- It has less significance if the price does not touch the supply or demand level.
- When the price hits the supply or demand level, its significance increases, and the probability of price reversal from these levels rises.
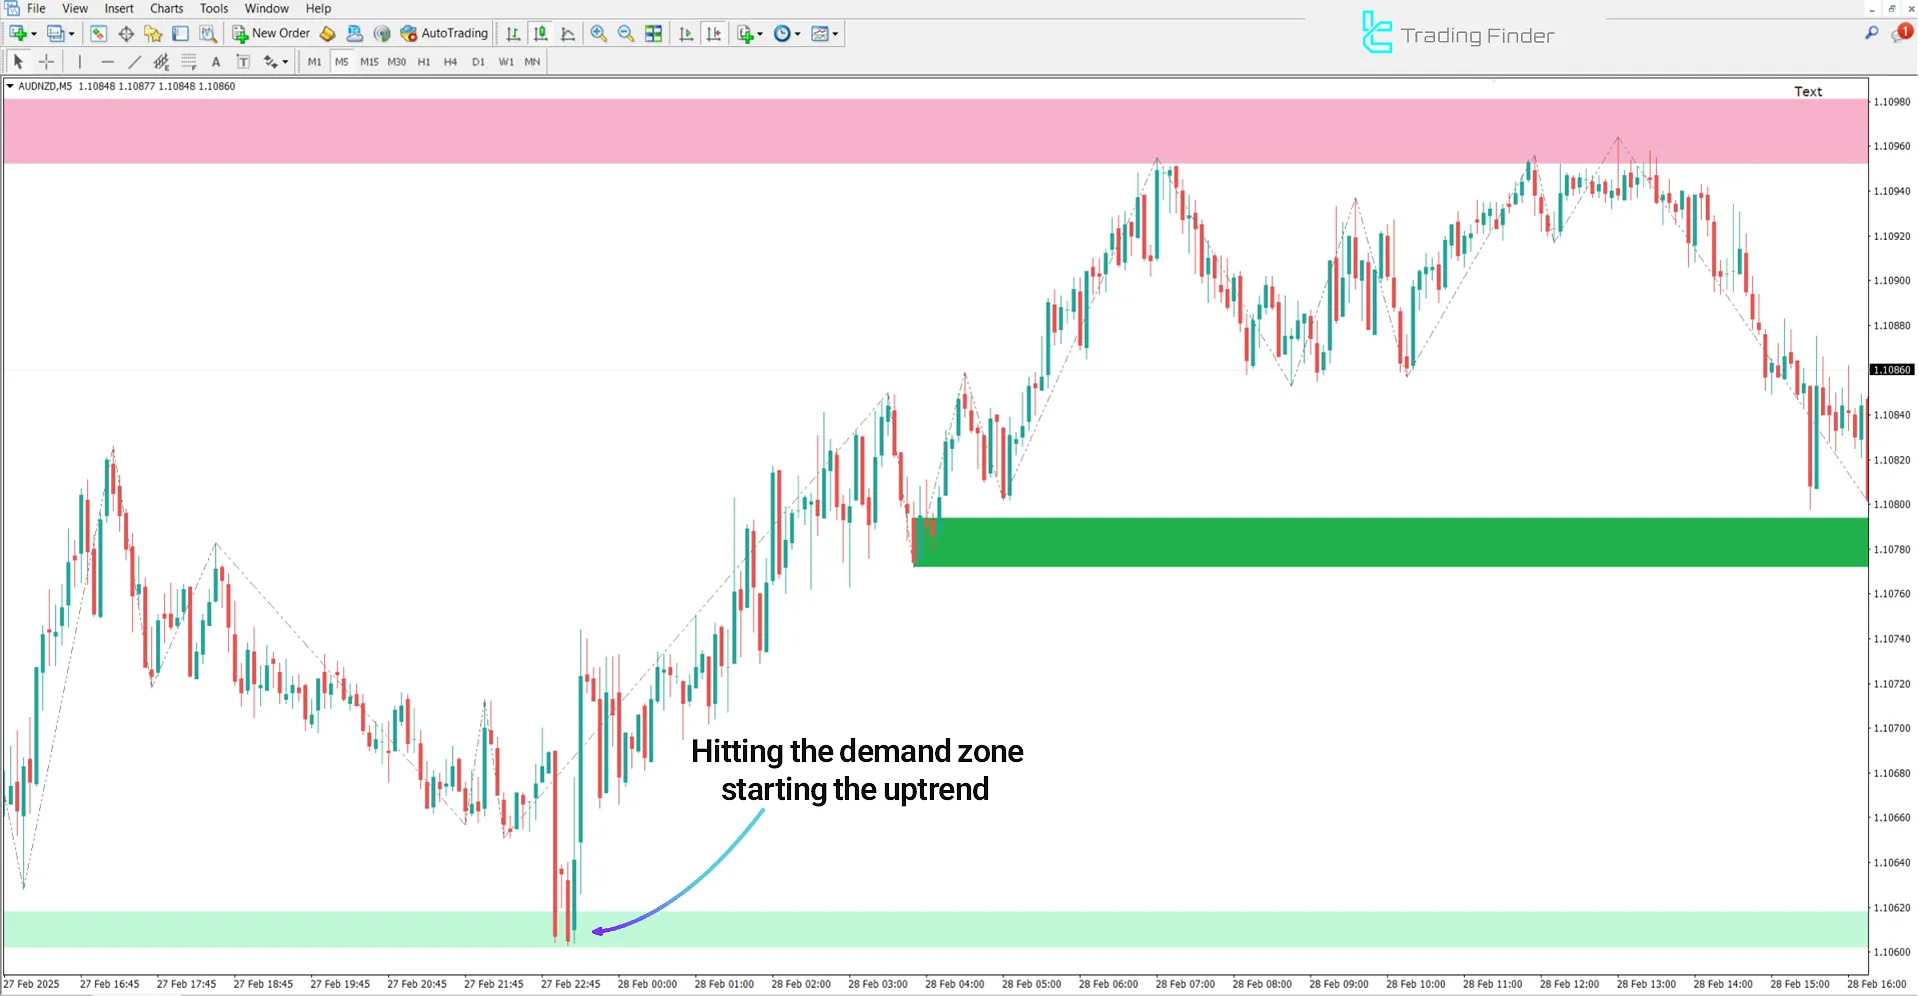
Uptrend Conditions
The price chart of the AUD/NZD currency pair in the 5 minute timeframe is displayed.In this indicator, the price reaches a demand zone (Support Zone) and shows signs of reversal, such as forming a bullish, engulfing candlestick (green).
This signal can indicate a potential price reversal from the demand zone and provide a suitable entry point for buy trades.

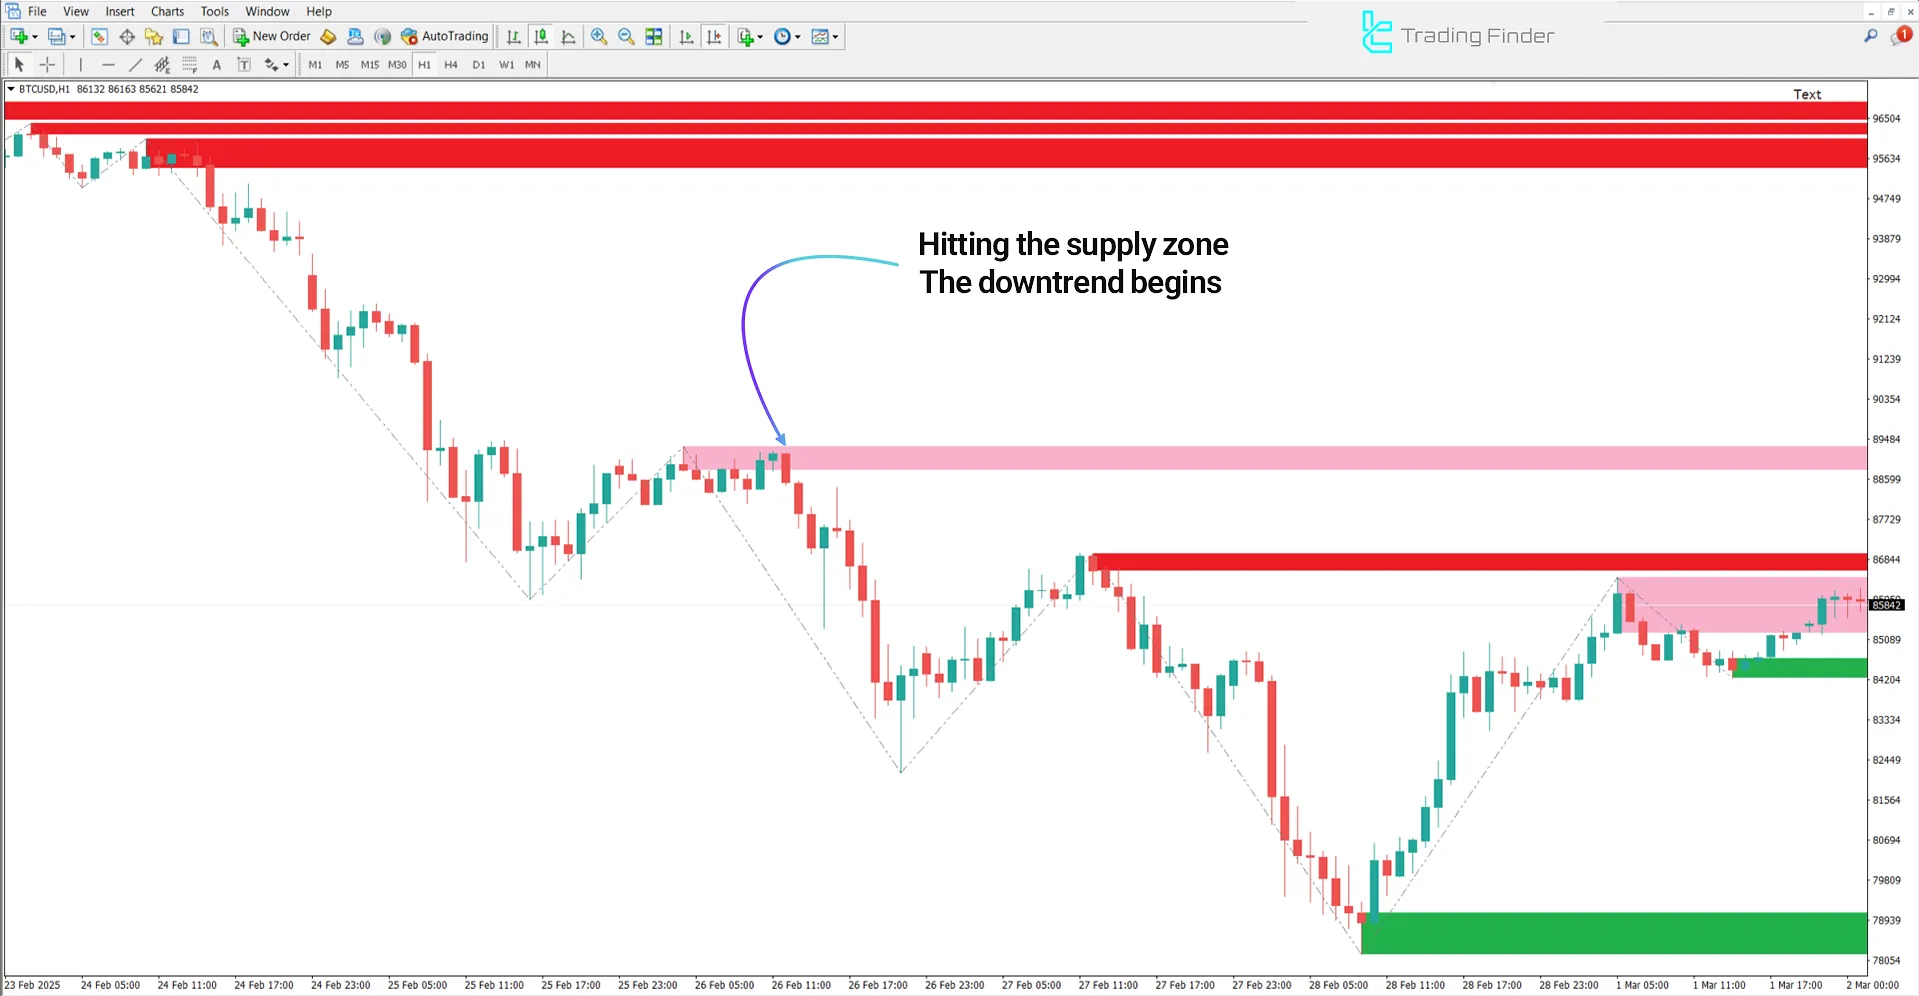
Downtrend Conditions
The image below displays the Bitcoin Cash (BTC/USD) price chart in the one-hour timeframe.
The price reaches a supply zone (Resistance Zone) and shows signs of a trend reversal, such as the formation of Doji and bearish engulfing patterns in this zone.

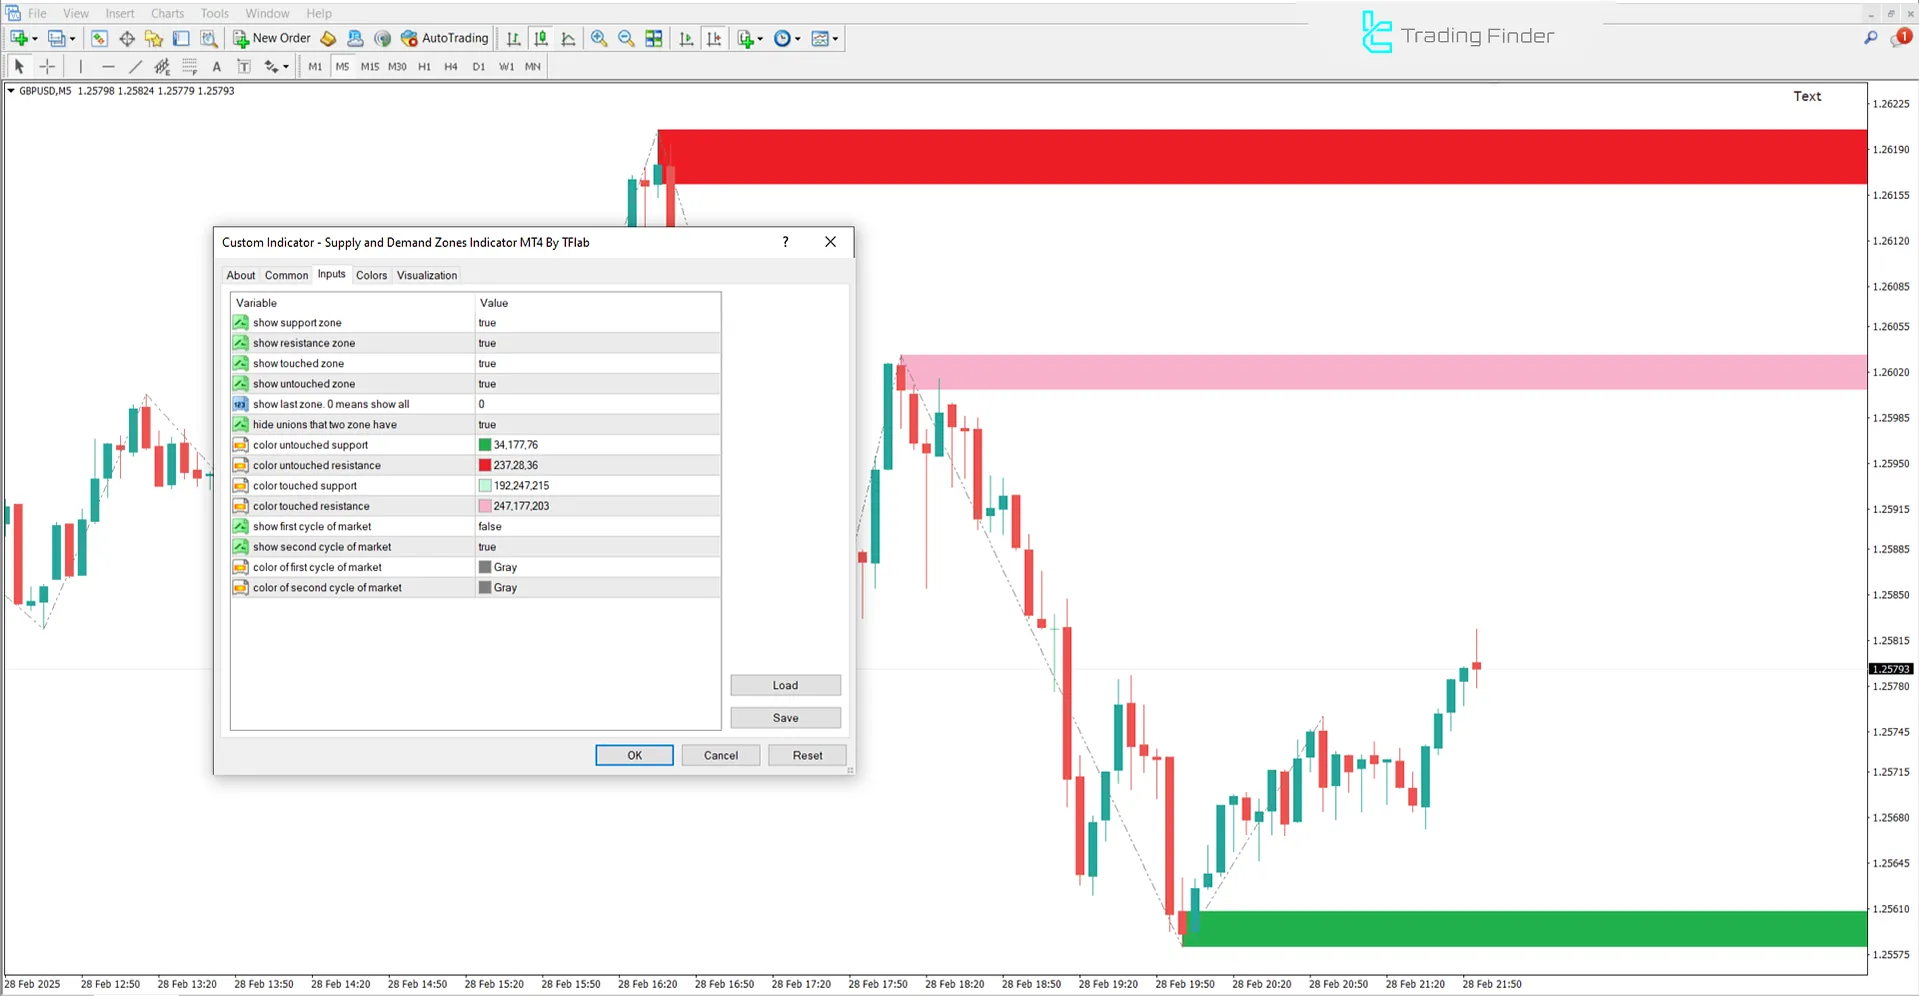
Indicator Settings
Image below presents the adjustable parameters of the Supply and Demand Zones indicator:

- Show support zone: Display support area
- Show resistance zone: Display resistance area
- The show touched zone: Display touched zones
- Show untouched zone: Display untouched zones
- Show last zone. 0 Means show all: Display all zones
- Hide unions that two zones have: Hide overlapping sections of two zones
- Color untouched support: Color of untouched support zone
- Color untouched resistance: Color of untouched resistance zone
- Color touched support: Color of touched support zone
- Show the first cycle of the market: Display the first market cycle
- Show the second cycle of the market: Display the second market cycle
- Color of the first cycle of the market: Color of the first market cycle
- Color of the second cycle of the market: Color of the second market cycle
Conclusion
The Supply and Demand Indicator in MetaTrader 4 is a powerful tool for identifying key support and resistance zones.
This MT4 upport and resistanceindicator identifies demand zones (potential buy areas) and supply zones (potential sell areas), recognizes critical reversal points, and determines appropriate entry and exit zones.
What is the appropriate timeframe for using this indicator?
This indicator is multi-timeframe and can be used across all timeframes.
Does this indicator provide entry and exit signals?
No, this indicator only determines potential reversal zones by marking supply and demand areas.