![Tick Chart Indicator for MetaTrader 4 Download - Free - [TradingFinder]](https://cdn.tradingfinder.com/image/184755/4-31-en-tick-on-chart-mt4-1.webp)
![Tick Chart Indicator for MetaTrader 4 Download - Free - [TradingFinder] 0](https://cdn.tradingfinder.com/image/184755/4-31-en-tick-on-chart-mt4-1.webp)
![Tick Chart Indicator for MetaTrader 4 Download - Free - [TradingFinder] 1](https://cdn.tradingfinder.com/image/184743/4-31-en-tick-on-chart-mt4-2.webp)
![Tick Chart Indicator for MetaTrader 4 Download - Free - [TradingFinder] 2](https://cdn.tradingfinder.com/image/184745/4-31-en-tick-on-chart-mt4-3.webp)
![Tick Chart Indicator for MetaTrader 4 Download - Free - [TradingFinder] 3](https://cdn.tradingfinder.com/image/184736/4-31-en-tick-on-chart-mt4-4.webp)
The Tick Chart Indicator in the MetaTrader 4 indicators accurately displays real-time price changes and is designed to identify short-term market fluctuations. Simply put, a "tick" refers to any slight change in price.
By analyzing the number of ticks within a specific period, you can assess the market's activity level and volatility intensity. The line visible in the oscillator shows only the price changes of the most recent candle and does not represent the overall trend fluctuations.
Indicator Specifications Table
This table briefly highlights the key points related to this indicator:
Indicator Categories: | Oscillators MT4 Indicators Volatility MT4 Indicators Trading Assist MT4 Indicators |
Platforms: | MetaTrader 4 Indicators |
Trading Skills: | Intermediate |
Indicator Types: | Leading MT4 Indicators |
Timeframe: | Multi-Timeframe MT4 Indicators |
Trading Style: | Intraday MT4 Indicators |
Trading Instruments: | Share Stocks MT4 Indicators Stock Market MT4 Indicators Cryptocurrency MT4 Indicators Forex MT4 Indicators |
Indicator Overview
In this MetaTrader 4 indicators, market direction is determined through the Moving Average line. Additionally, traders can adjust the oscillator's moving average display to linear or histogram mode to easily observe volume changes from low to high or vice versa.
Indicator in an Uptrend
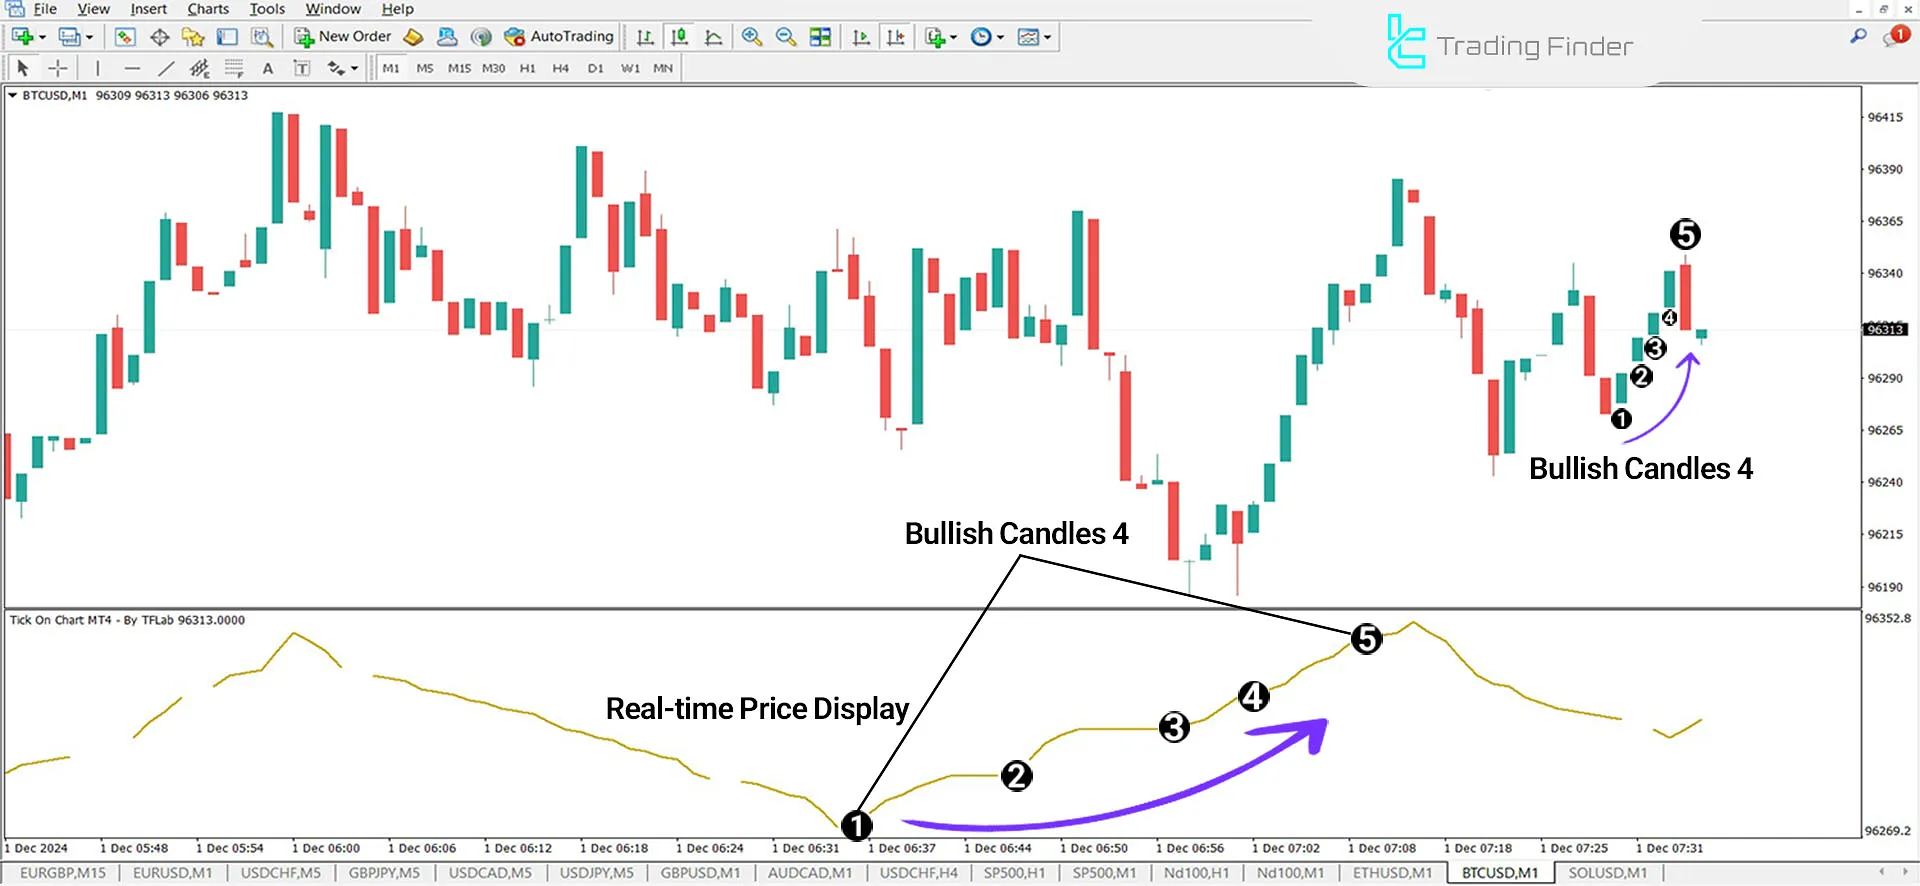
In the 1-minute chart of Bitcoin (BTC), the indicator displays real-time price changes and allows users to track prices closely in the latest candle.
In this chart,four consecutive bullish candles began to rise, and the indicator plotted the price changes to depict the uptrend.

Indicator in a Downtrend
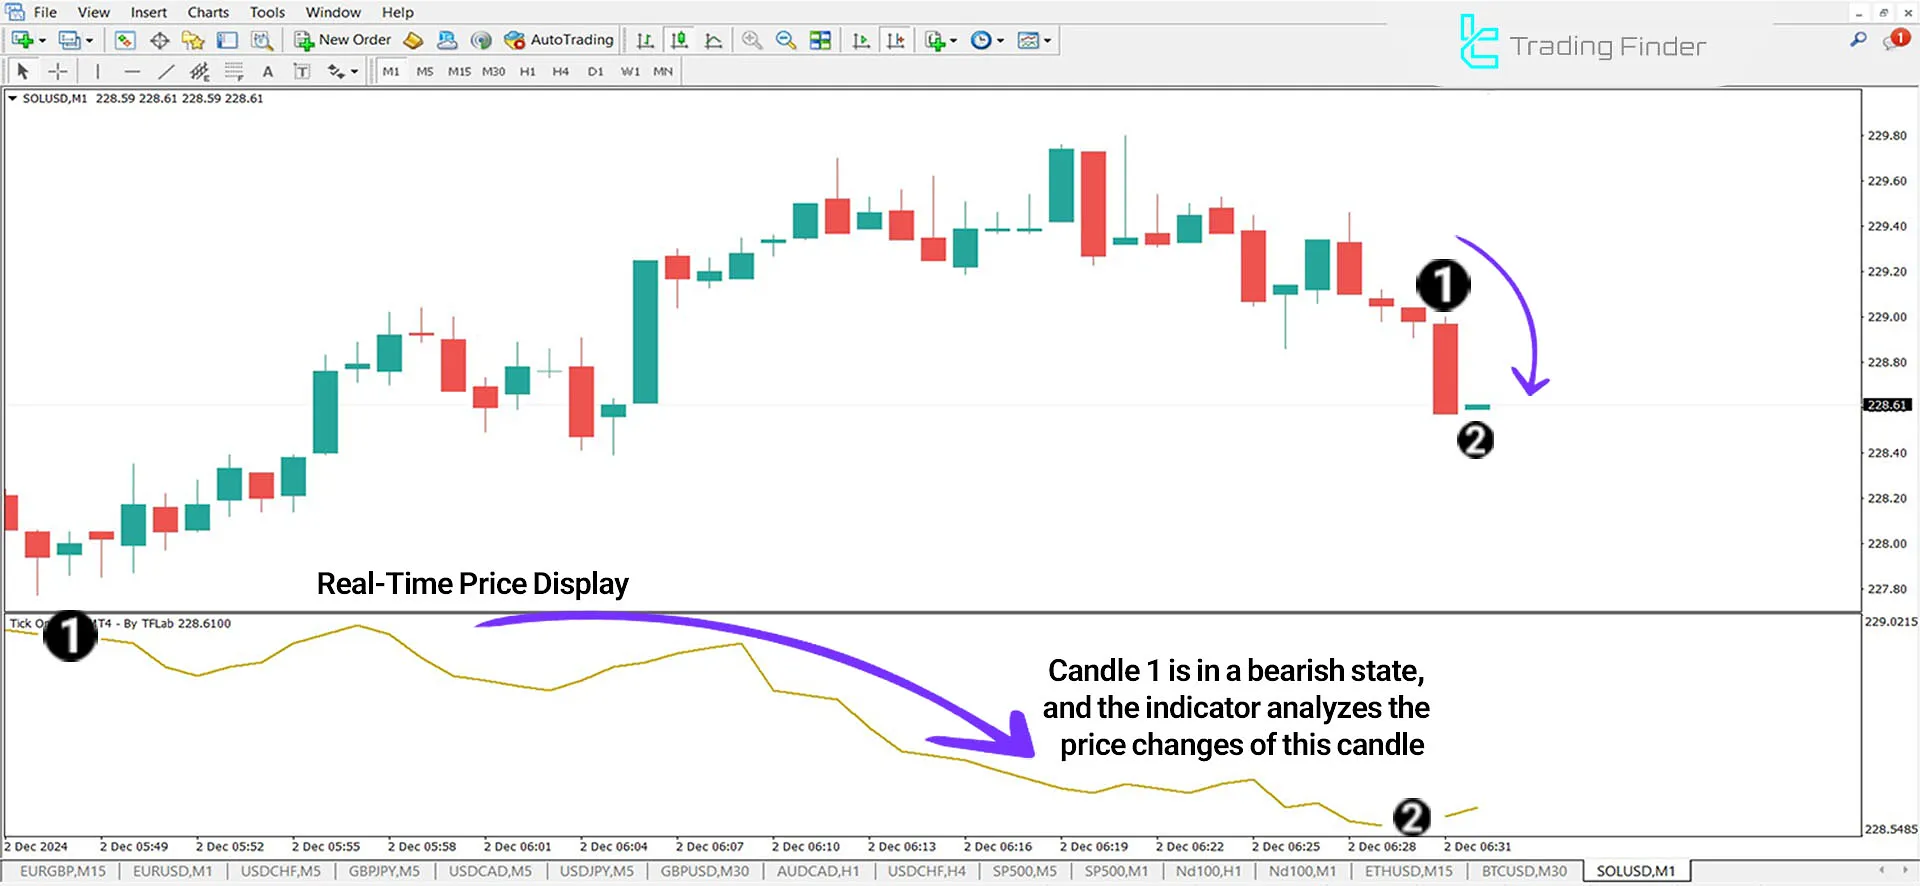
In the price chart of Solana (SOL), the oscillator precisely displays price changes in Candle "1".
Traders can use this oscillator to evaluate the intensity of the price trend and use it as confirmation forentering their trades.

Tick Chart Indicator Settings
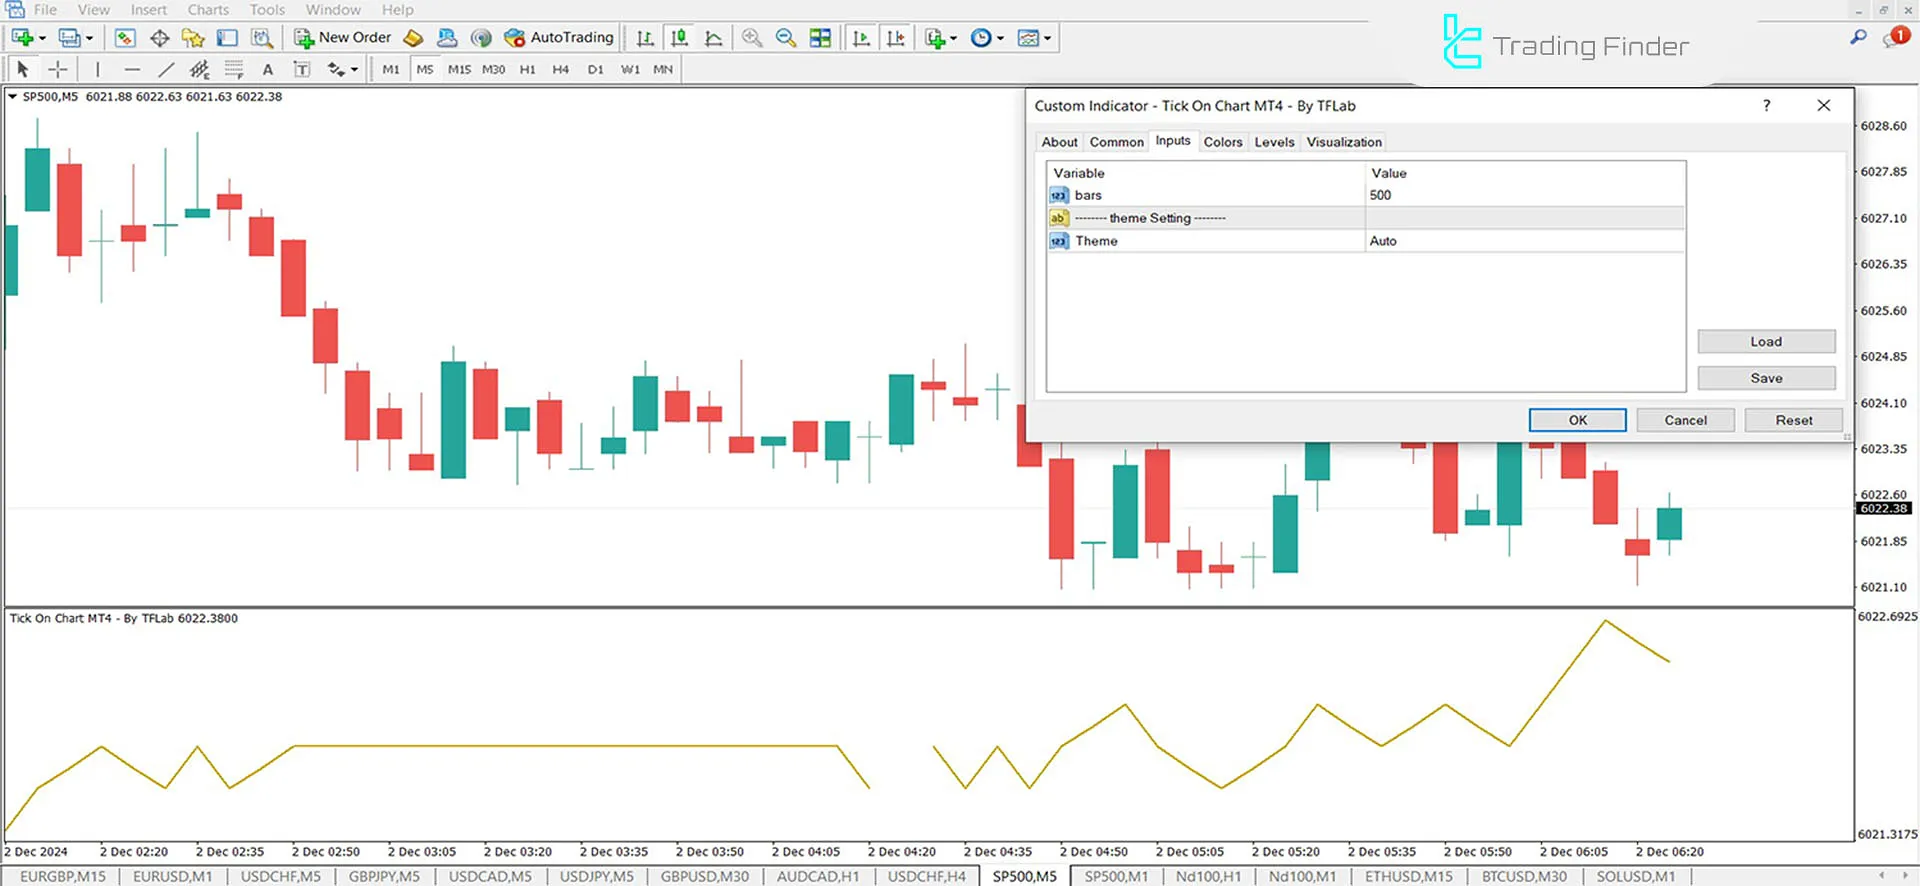
In the image below, you can view all the settings of this indicator:

- Bars: Calculates the number of candles to display in the oscillator (default is 500);
- Theme: Sets the chart background color.
Conclusion
The Tick Chart Indicator in MetaTrader 4 oscillators is ideal for traders interested in real-time market fluctuations and rapid price changes.
This feature helps traders use the indicator as aconfirmation tool to identify trends by observing continuous candle growth and significant price changes.
In conditions where the price increases significantly, traders can consider these changes as signals for the continuation or termination of the trend.
Tick Chart MT4 PDF
Tick Chart MT4 PDF
Click to download Tick Chart MT4 PDFWhat is the Tick Chart Indicator?
The Tick Chart Indicator is a tool that displays small price changes (ticks) in real-time and helps traders analyze short-term market fluctuations.
What does a tick mean in financial markets?
A tick refers to any change in price, even the smallest movement.


