![Time Segmented Volume Indicator for MT4 Download - Free - [TFlab]](https://cdn.tradingfinder.com/image/245206/4-48-en-time-segmented-volume-mt4-1.webp)
![Time Segmented Volume Indicator for MT4 Download - Free - [TFlab] 0](https://cdn.tradingfinder.com/image/245206/4-48-en-time-segmented-volume-mt4-1.webp)
![Time Segmented Volume Indicator for MT4 Download - Free - [TFlab] 1](https://cdn.tradingfinder.com/image/245205/4-48-en-time-segmented-volume-mt4-2.webp)
![Time Segmented Volume Indicator for MT4 Download - Free - [TFlab] 2](https://cdn.tradingfinder.com/image/245194/4-48-en-time-segmented-volume-mt4-3.webp)
![Time Segmented Volume Indicator for MT4 Download - Free - [TFlab] 3](https://cdn.tradingfinder.com/image/245227/4-48-en-time-segmented-volume-mt4-4.webp)
On July 22, 2025, in version 2, alert/notification and signal functionality was added to this indicator
The Time Segmented Volume (TSV) indicator, among the MetaTrader 4 indicators, is used to evaluate the inflow and outflow of liquidity for an asset over various timeframes.
The TSV indicator appears as an oscillator in the lower window of the chart, oscillating around the zero line. A rise in oscillator bars above the zero line indicates the formation of an uptrend and an increase in demand.
Conversely, a decline in the bars from above the zero line to below may signal the start of a downtrend and increased selling pressure.
Indicator Specifications Table
The following table summarizes the specifications of the indicator.
Indicator Categories: | Oscillators MT4 Indicators Volatility MT4 Indicators Trading Assist MT4 Indicators |
Platforms: | MetaTrader 4 Indicators |
Trading Skills: | Intermediate |
Indicator Types: | Reversal MT4 Indicators |
Timeframe: | Multi-Timeframe MT4 Indicators |
Trading Style: | Intraday MT4 Indicators |
Trading Instruments: | Stock Market MT4 Indicators Cryptocurrency MT4 Indicators Forex MT4 Indicators |
Overview of the Indicator
The Time Segmented Volume (TSV) indicator provides various signals to assess market trends. These signals include:
- Identifying Overbought and Oversold Conditions: Indicates excessive price movement in one direction, signaling a potential correction or trend reversal
- Divergence Between Price and Indicator: Occurs when price movement and the indicator trend in opposite directions, suggesting a possible trend change
Crossing Moving Average Lines of the Oscillator: Indicates the beginning or end of a new trend. The blue line represents the slow-moving average, while the orange line represents the fast-moving average
Indicator in an Uptrend
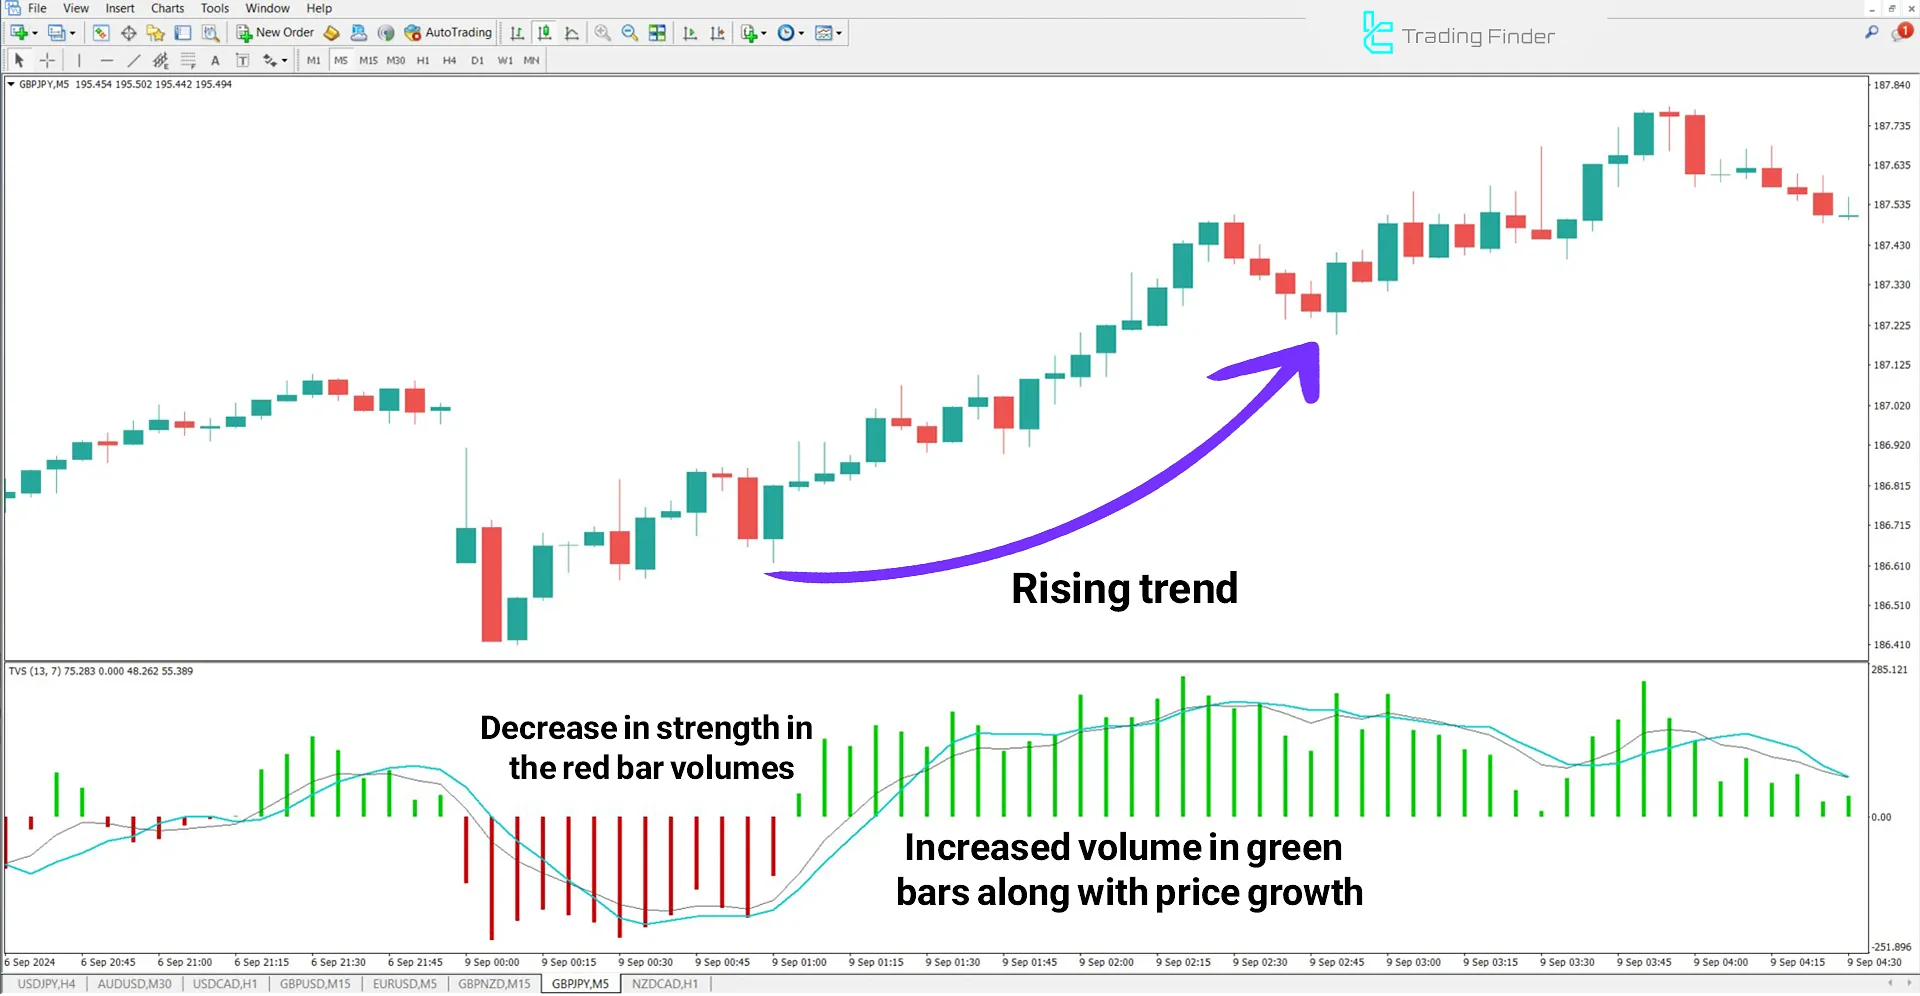
In an uptrend on the GBP/USD chart, a decrease in the strength of red histogram bars combined with an increase in the green bars’ volume suggests strengthening demand and the continuation of the uptrend.
Under these conditions, traders can identify suitable opportunities to enter Buy trades based on their personal strategy or by utilizing other Trading Assist Indicators for MT4.

Indicator in a Downtrend
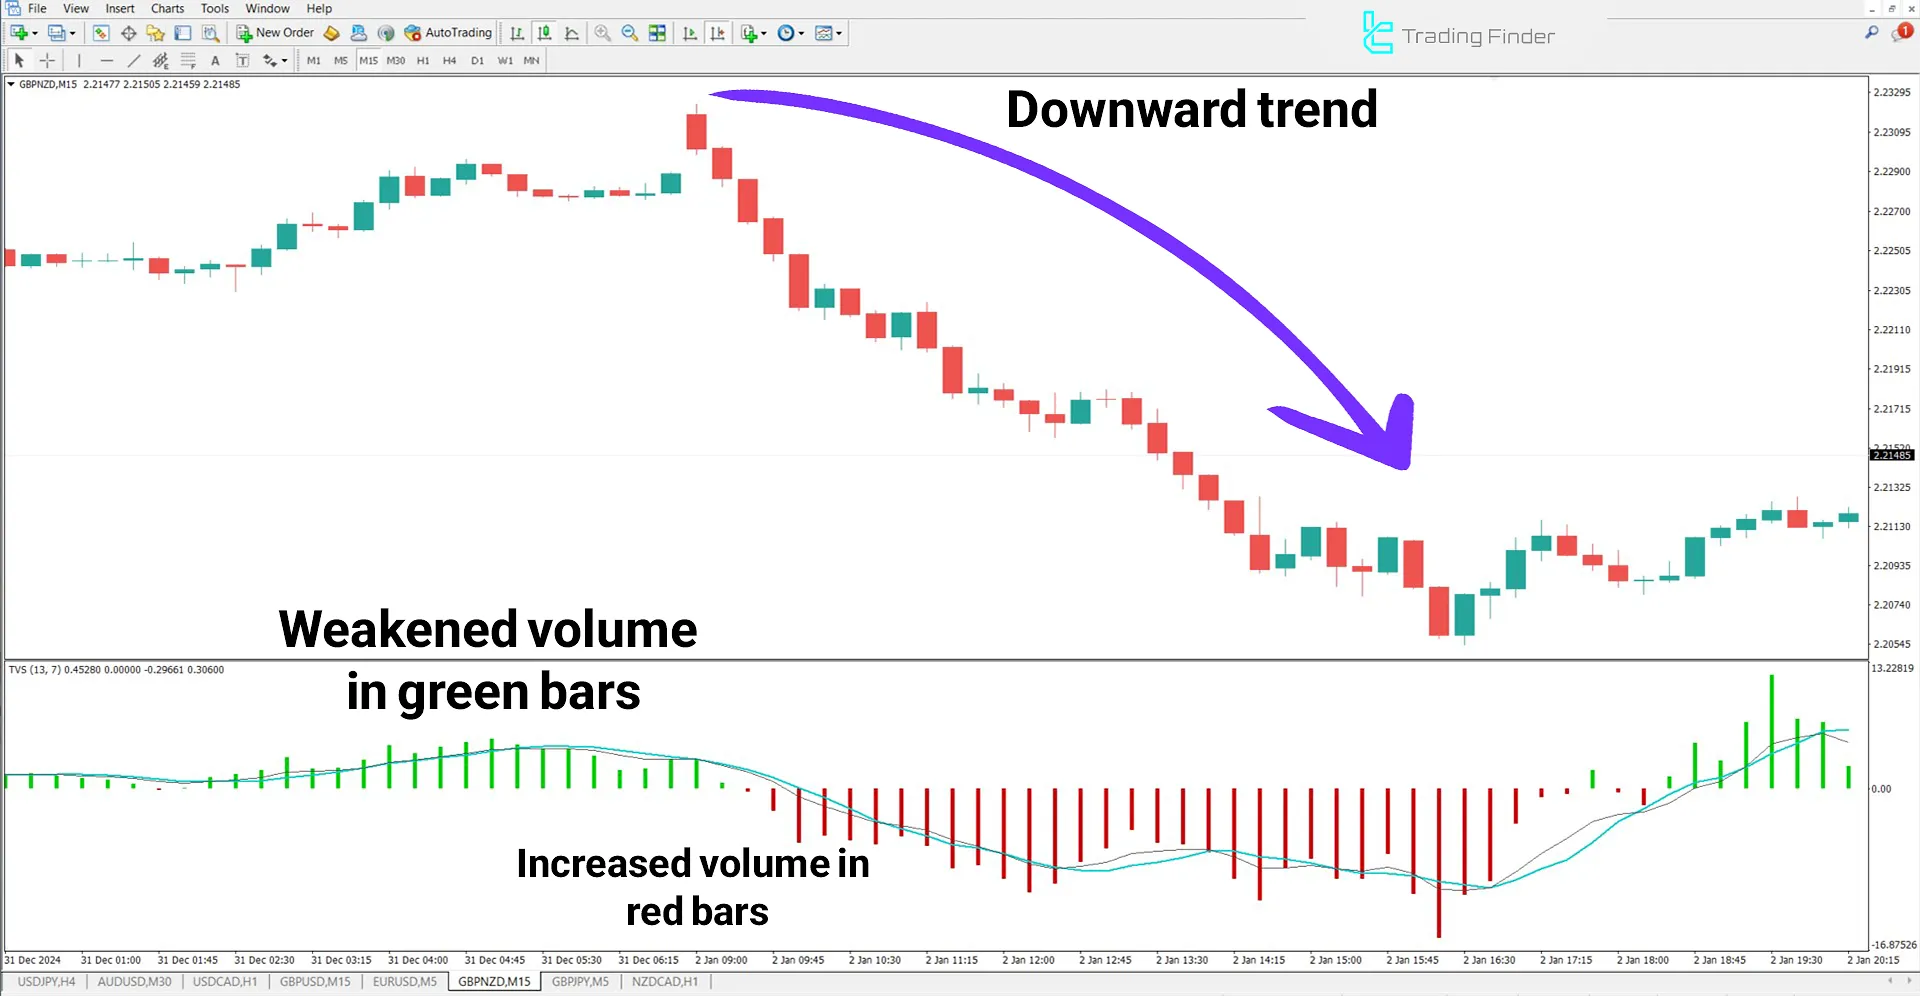
In a downtrend on the GBP/NZD chart, a decline in the green histogram bars’ volume and a gradual increase in the strength of red bars indicate rising selling pressure and the continuation of the downtrend.
Traders can identify appropriate opportunities to enter sell trades (Sell) based on their trading strategies.

Indicator Settings
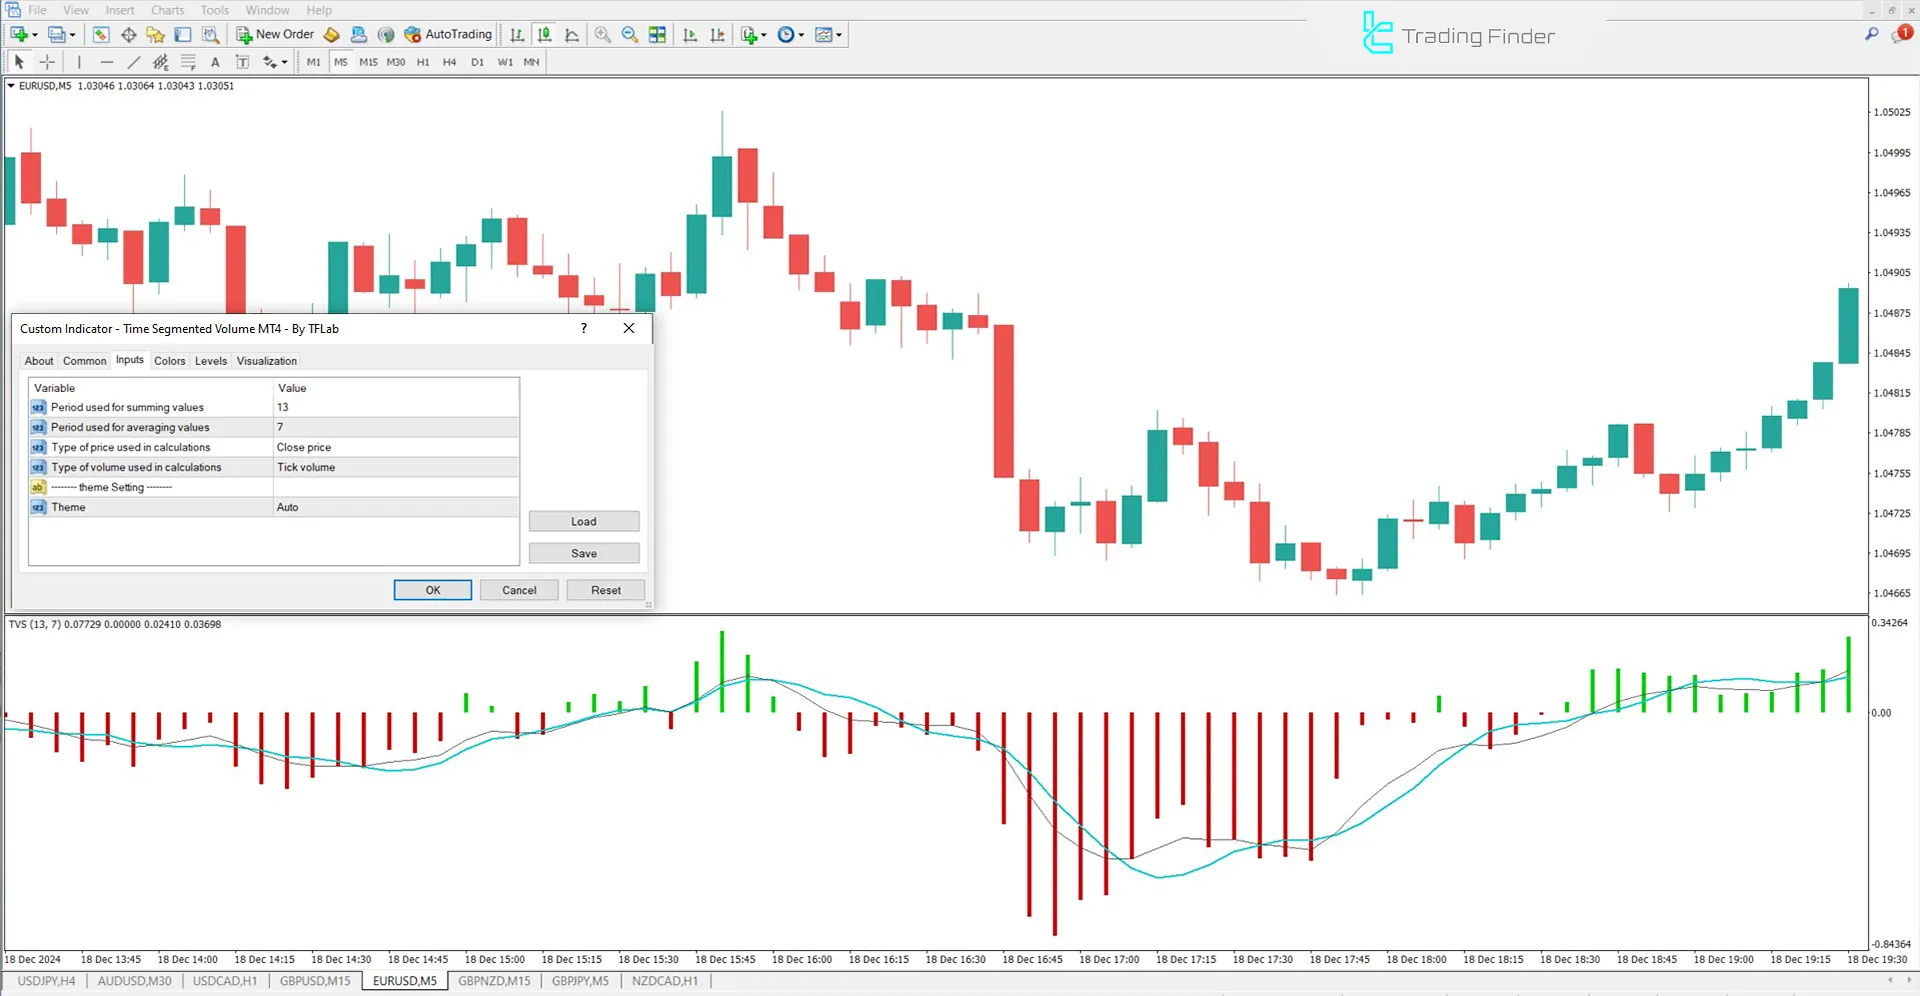
The settings of this indicator are shown in the image below:

- Period Used for Summing Values: The number of bars used for volume calculation
- Period Used for Averaging Values: The number of periods used for calculating the moving average
- Type of Price Used in Calculations: The type of price used in calculations
- Type of Volume Used in Calculations: The type of volume used in calculations
Conclusion
The Time Segmented Volume (TSV) indicator emphasizes the relationship between volume and price over time, determining the strength of price movements.
The crossing of the TSV line with its moving average is a signal for identifying uptrends or downtrends.
Larger bars on the indicator’s chart represent greater intensity of price movement in either direction, highlighting the importance of trading flow.
Time Segmented Volume MT4 PDF
Time Segmented Volume MT4 PDF
Click to download Time Segmented Volume MT4 PDFWhat is the Time Segmented Volume Indicator?
It is a tool for evaluating the inflow and outflow of liquidity to an asset over different timeframes.
Does the TSV Indicator show overbought and oversold conditions?
Yes, this indicator identifies overbought and oversold areas.


