![Vertex Mod 3.0 Oscillator for MT4 Download – Free – [TradingFinder]](https://cdn.tradingfinder.com/image/451582/13-155-en-vertex-mod-3-0-mt4-01.webp)
![Vertex Mod 3.0 Oscillator for MT4 Download – Free – [TradingFinder] 0](https://cdn.tradingfinder.com/image/451582/13-155-en-vertex-mod-3-0-mt4-01.webp)
![Vertex Mod 3.0 Oscillator for MT4 Download – Free – [TradingFinder] 1](https://cdn.tradingfinder.com/image/451581/13-155-en-vertex-mod-3-mt4-02.webp)
![Vertex Mod 3.0 Oscillator for MT4 Download – Free – [TradingFinder] 2](https://cdn.tradingfinder.com/image/451580/13-155-en-vertex-mod-03.webp)
![Vertex Mod 3.0 Oscillator for MT4 Download – Free – [TradingFinder] 3](https://cdn.tradingfinder.com/image/451586/13-155-en-vertex-mod-04.webp)
The Vertex Mod 3.0 Indicator is a versatile tool for identifying overbought and oversold zones, as well as potential trading opportunities. This indicator combines three widely used technical analysis tools Moving Averages, Bollinger Bands, and Momentum to provide trading signals.
Specifications Table of Vertex Mod 3.0 Oscillator
The following table outlines the specifications of the Vertex Mod 3.0 indicator.
Indicator Categories: | Oscillators MT4 Indicators Bands & Channels MT4 Indicators |
Platforms: | MetaTrader 4 Indicators |
Trading Skills: | Intermediate |
Indicator Types: | Overbought and Oversold MT4 Indicators Reversal MT4 Indicators |
Timeframe: | Multi-Timeframe MT4 Indicators |
Trading Style: | Day Trading MT4 Indicators Scalper MT4 Indicators Swing Trading MT4 Indicators |
Trading Instruments: | Stock Market MT4 Indicators Cryptocurrency MT4 Indicators Forex MT4 Indicators |
At a Glance: Vertex Mod 3.0 Indicator
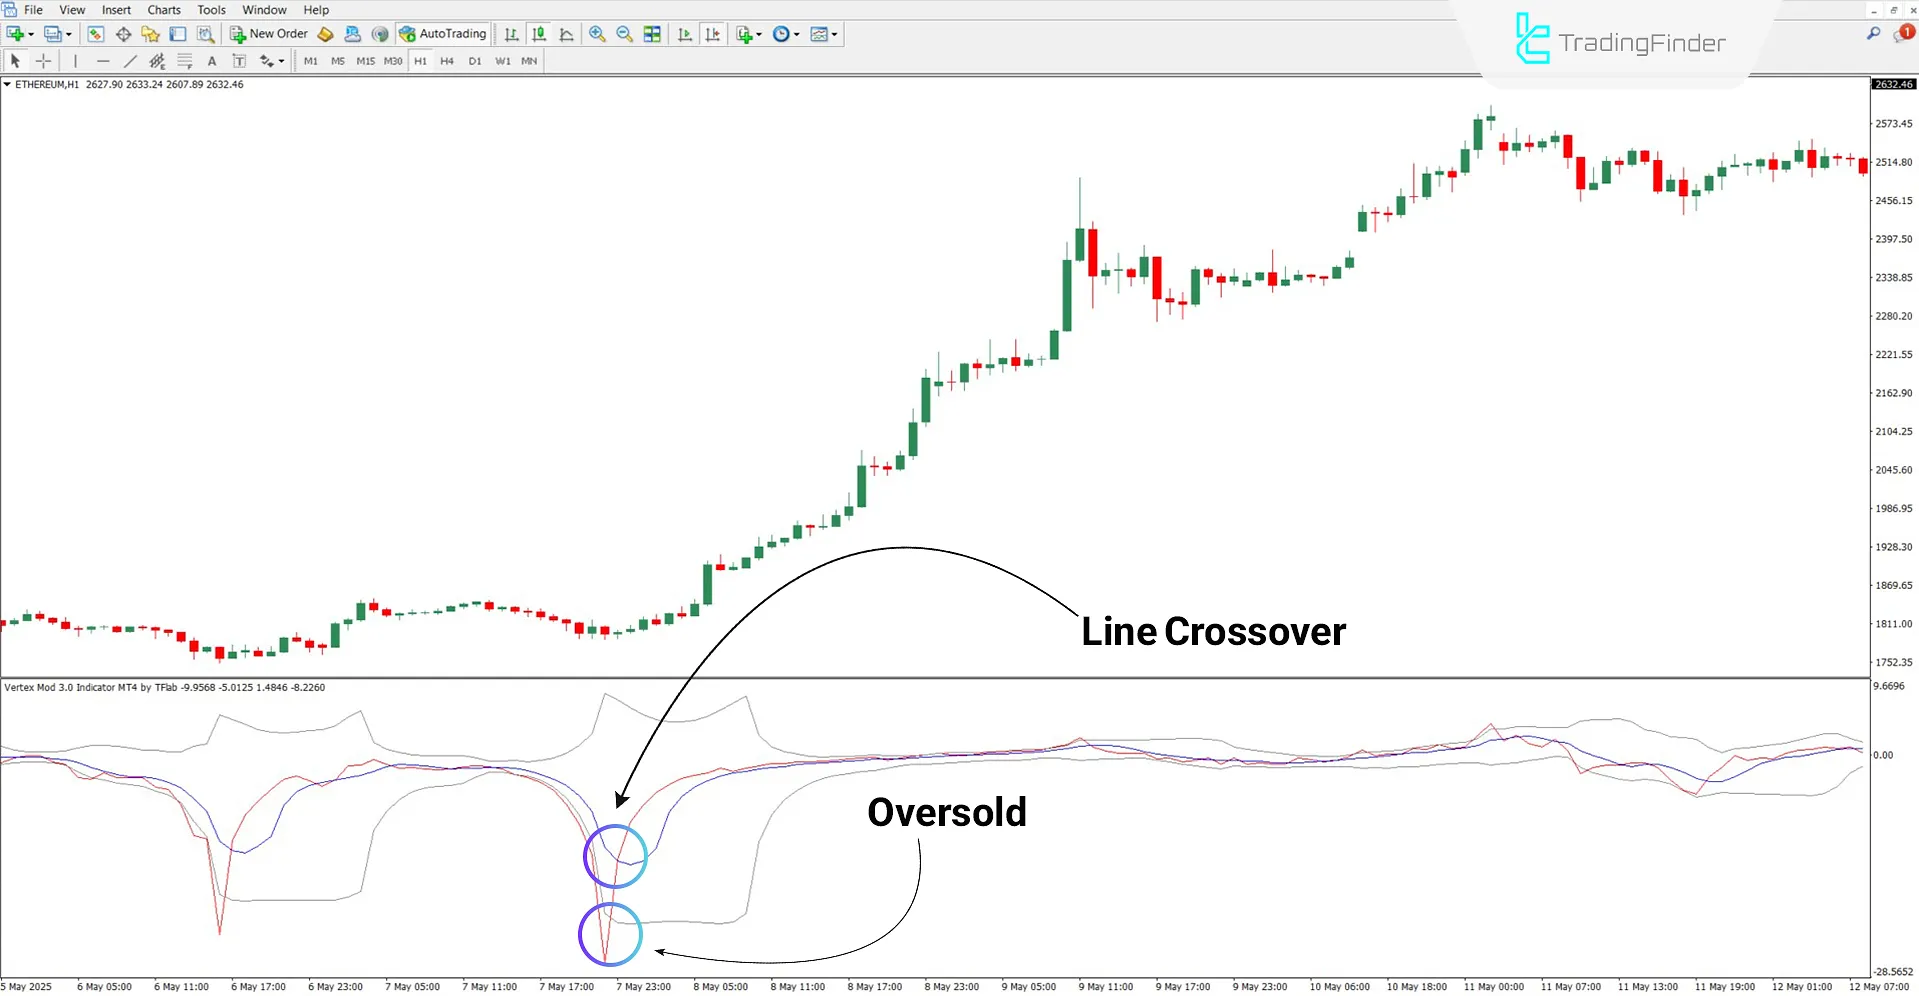
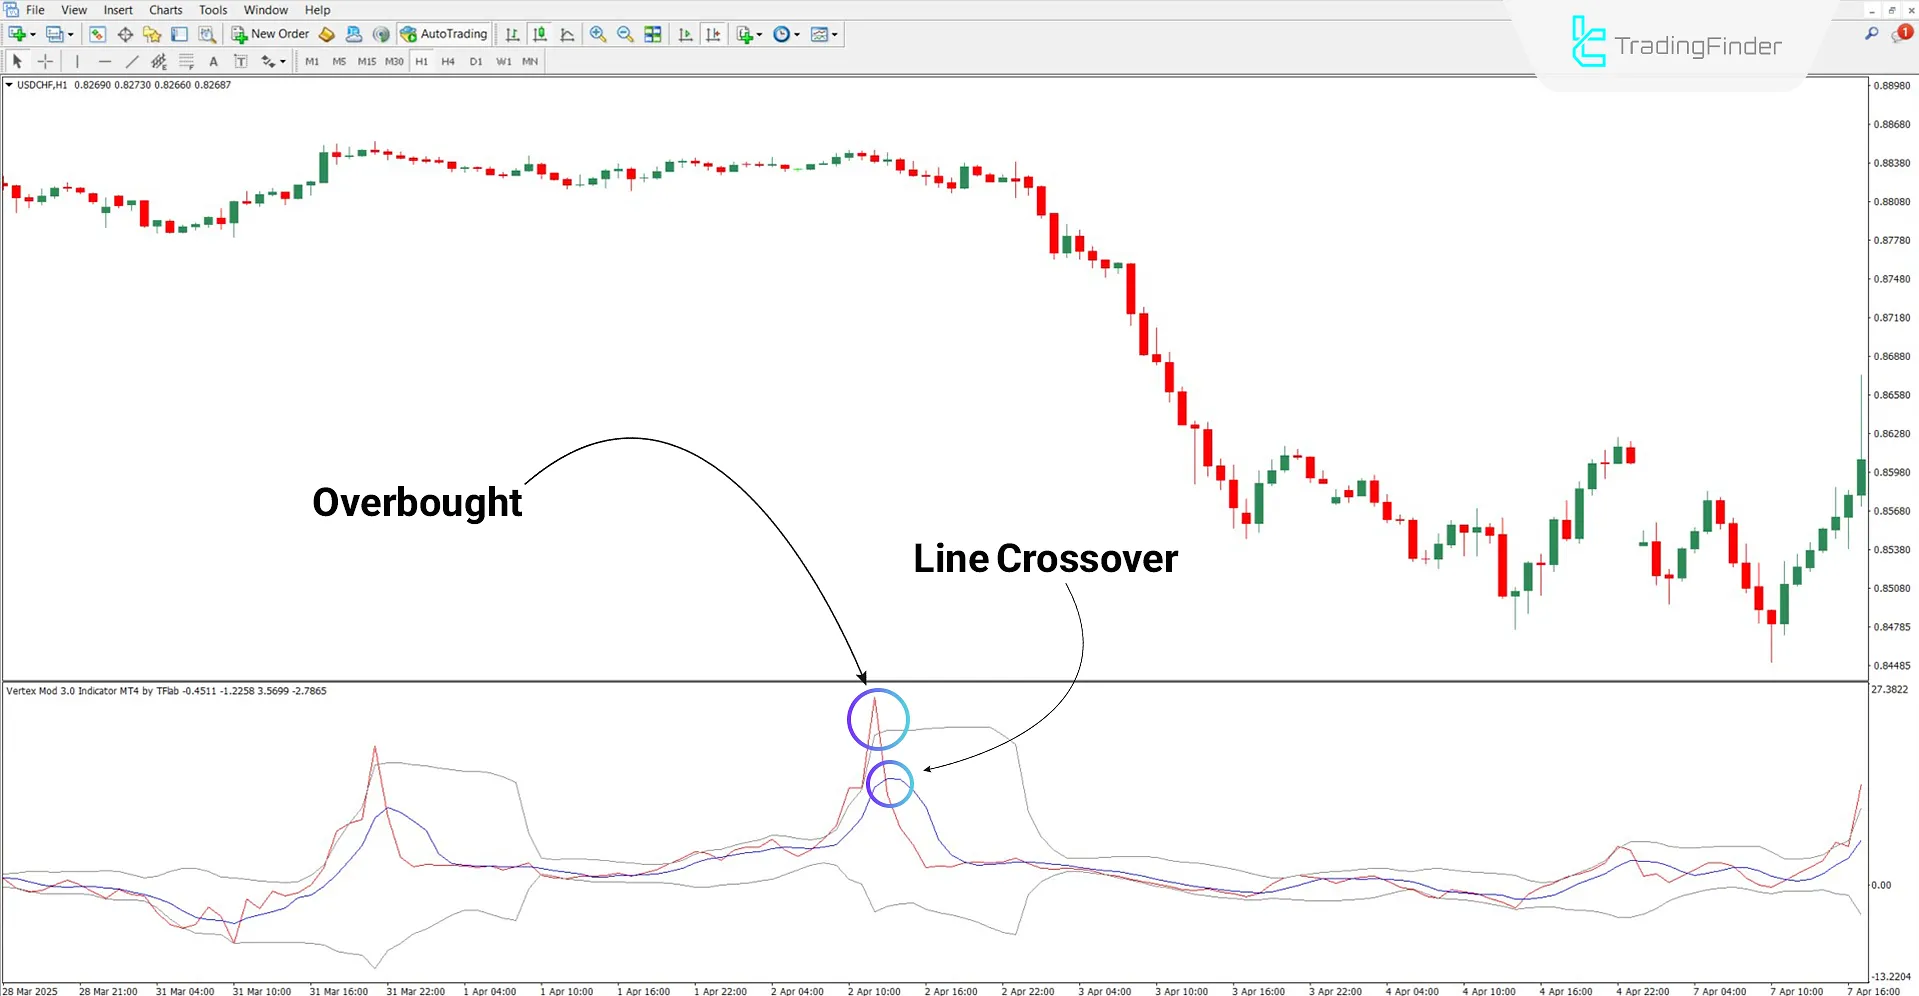
Overbought and oversold zones in the Vertex Mod 3.0 are identified based on the position of the red signal line relative to the Bollinger Bands. When the red line crosses above the upper band, it signals an overbought condition. When it drops below the lower band, it signals an oversold condition.
Uptrend
Based on the 1-hour ETH (Ethereum) chart, thered oscillating line has dipped below the lower Bollinger Band, indicating an oversold state. Moreover, the intersection of the red and blue lines is considered a favorable point for entering long positions.

Downtrend
According to the USD/CHF (U.S. Dollar/Swiss Franc) chart, the red line has reached the upper Bollinger Band, indicating an overbought condition. Additionally, when the red line crosses below the blue line, a downtrend is confirmed, serving as a signal to enter short positions.

Vertex Mod 3.0 Indicator Settings
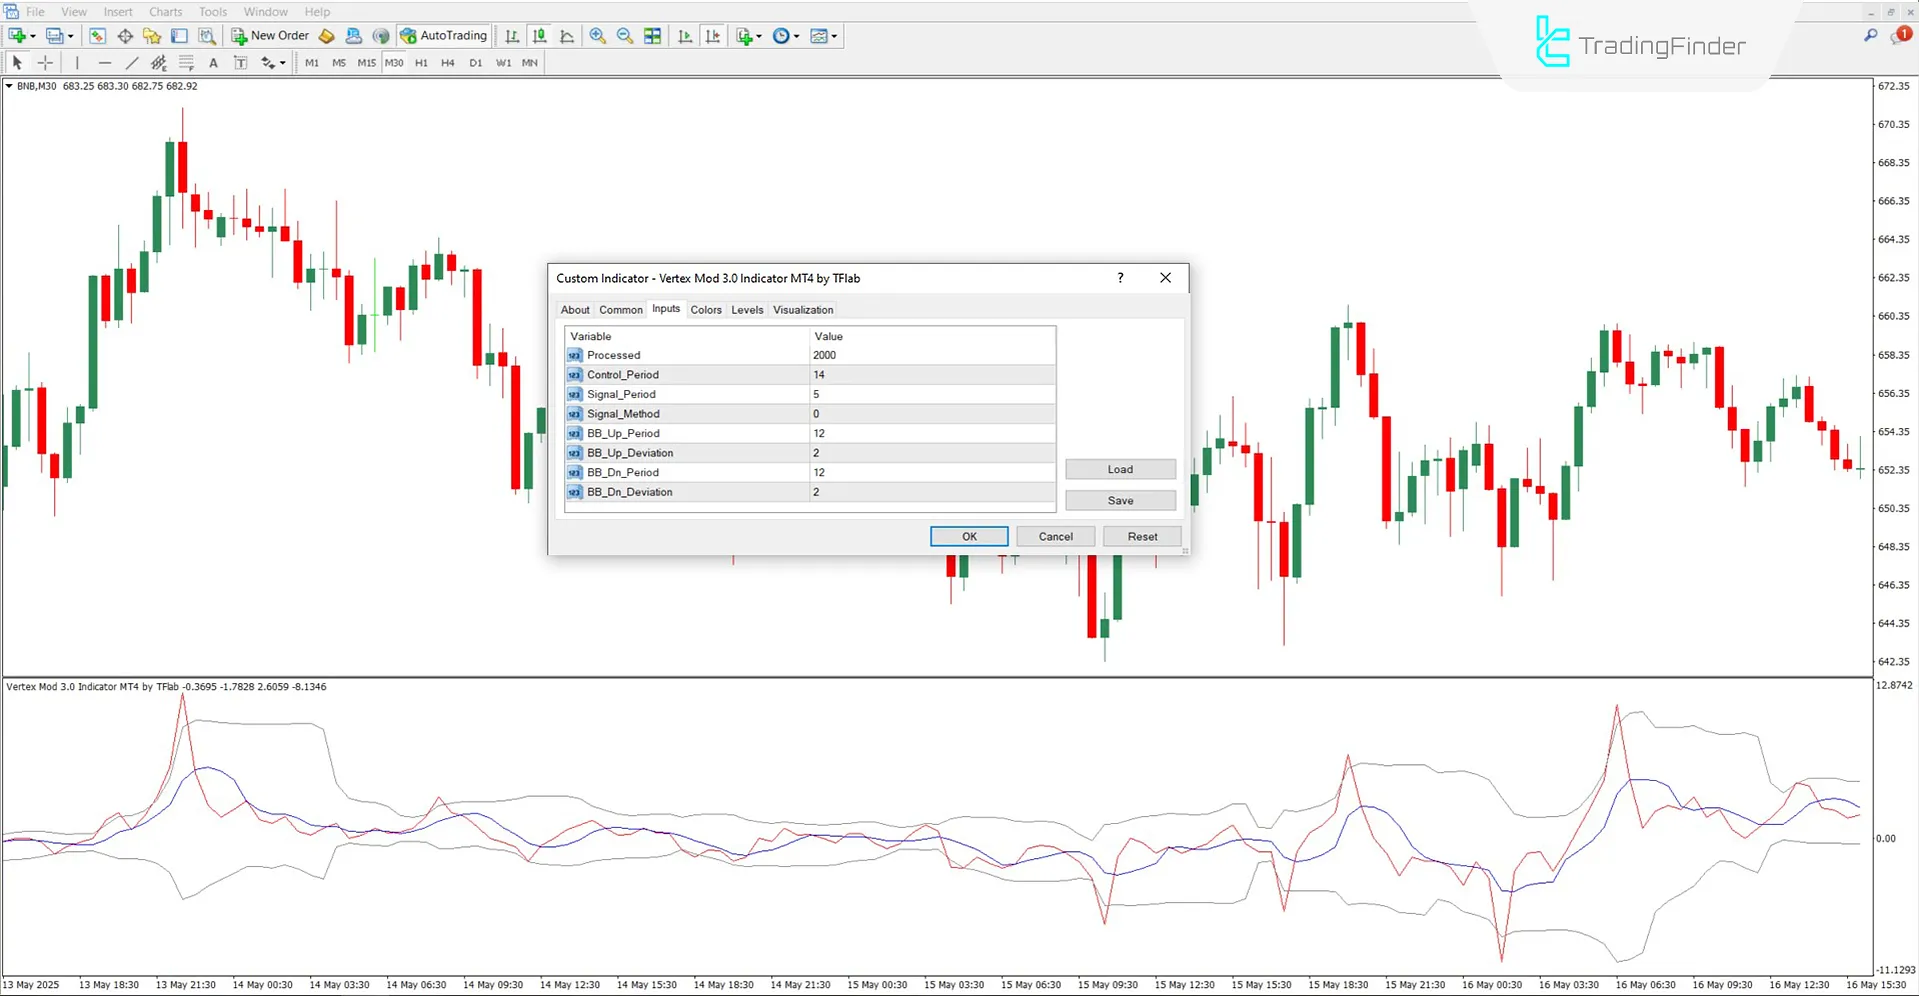
Below are the settings parameters of the Vertex Mod 3.0 Indicator:

- Processed: Number of candles used for analysis and processing
- Control_Period: Base analysis period to assess trend strength
- Signal_Period: Sensitivity of the red signal line to price fluctuations
- Signal_Method: Calculation method for the signal line
- BB_Up_Period: Number of candles used to calculate the upper Bollinger Band
- BB_Up_Deviation: Standard deviation for defining the upper band’s distance from the midline
- BB_Dn_Period: Number of candles used to calculate the lower Bollinger Band
- BB_Dn_Deviation: Standard deviation for defining the lower band’s range of fluctuation
Conclusion
The Vertex Mod 3.0 Oscillator , developed for MetaTrader 4, utilizes Moving Averages, Bollinger Bands, and Momentum to provide clear insights into price reversals, trend directions, and overbought/oversold zones.
This trading tool displays three distinct lines (a red signal line, a blue moving average line, and gray Bollinger Bands), enabling fast and accurate market condition analysis. It is fully operational across all timeframes with no limitations.
Vertex Mod 3.0 Oscillator MT4 PDF
Vertex Mod 3.0 Oscillator MT4 PDF
Click to download Vertex Mod 3.0 Oscillator MT4 PDFHow is a sell signal generated?
When the red line returns from the overbought area and crosses below the blue line.
Can the Vertex Mod 3.0 Indicator be used in commodity markets?
Yes, this tool can be used across all markets, including commodities.


