![Zerolag Moving Average for MetaTrader 4 Download - Free - [TFlab]](https://cdn.tradingfinder.com/image/185565/4-34-en-zerolag-moving-average-mt4-1.webp)
![Zerolag Moving Average for MetaTrader 4 Download - Free - [TFlab] 0](https://cdn.tradingfinder.com/image/185565/4-34-en-zerolag-moving-average-mt4-1.webp)
![Zerolag Moving Average for MetaTrader 4 Download - Free - [TFlab] 1](https://cdn.tradingfinder.com/image/185532/4-34-en-zerolag-moving-average-mt4-2.webp)
![Zerolag Moving Average for MetaTrader 4 Download - Free - [TFlab] 2](https://cdn.tradingfinder.com/image/185541/4-34-en-zerolag-moving-average-mt4-3.webp)
![Zerolag Moving Average for MetaTrader 4 Download - Free - [TFlab] 3](https://cdn.tradingfinder.com/image/185536/4-34-en-zerolag-moving-average-mt4-4.webp)
The Zerolag Moving Average Indicator uses a period of 27 and, unlike other moving average indicators, does not delay in providing signals.
This MT4 trading assist indicator displays bullish or bearish signals as price moves in the market. A candle breaking this line and crossing above it is considered a Buy signal, while crossing below it is regarded as a Sell signal.
Note: One of the features of this indicator is the ability to send various alerts via alarm and email, along with the name of the trading symbol.
Zerolag Moving Average Indicator Table
This table provides a concise summary of the details of this indicator:
Indicator Categories: | Signal & Forecast MT4 Indicators Volatility MT4 Indicators Trading Assist MT4 Indicators |
Platforms: | MetaTrader 4 Indicators |
Trading Skills: | Elementary |
Indicator Types: | Reversal MT4 Indicators |
Timeframe: | Multi-Timeframe MT4 Indicators |
Trading Style: | Intraday MT4 Indicators Scalper MT4 Indicators |
Trading Instruments: | Share Stocks MT4 Indicators Indices Market MT4 Indicators Commodity Market MT4 Indicators Stock Market MT4 Indicators Cryptocurrency MT4 Indicators Forex MT4 Indicators |
Indicator at a Glance
This indicator includes a moving average that tracks price movements. It analyzes price changes and fluctuations, displaying them clearly on the chart. A color change of the line to blue indicates a bullish trend signal, while a change to red signifies a bearish trend signal. If this line is broken by strong candlesticks, the likelihood of a trend reversal increases.
Bullish Trend Conditions
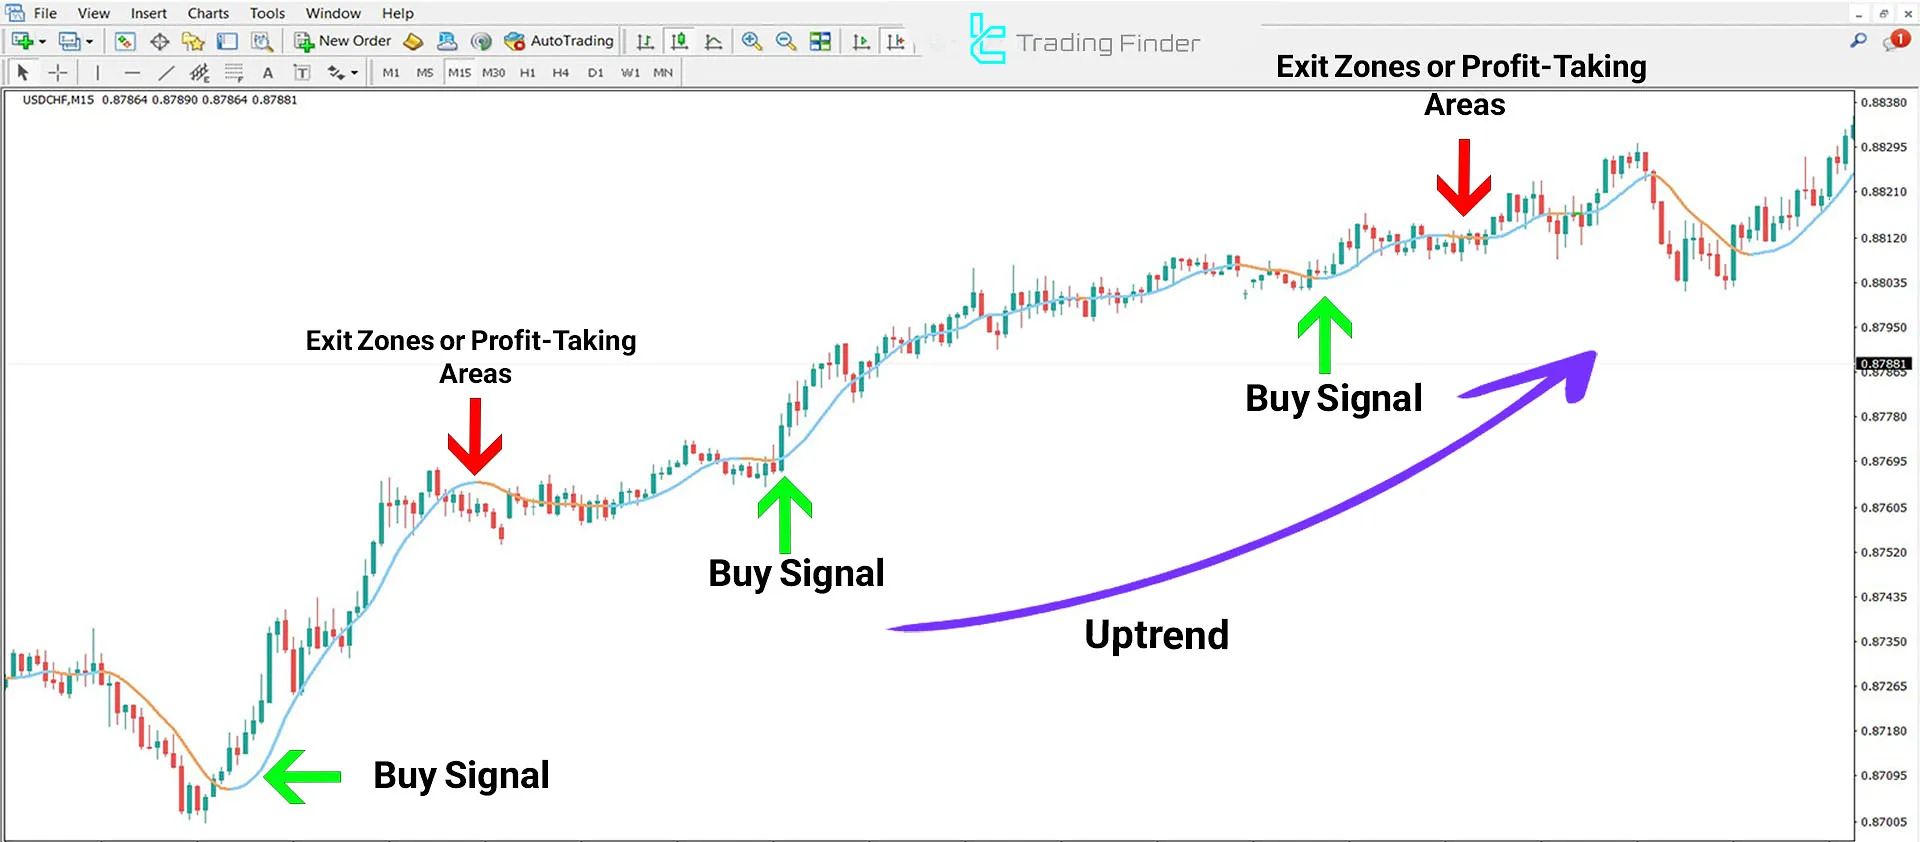
On the price chart of the USD/CHF currency pair in the 15-minute time frame, a change in the moving average line's color from orange to blue signals a trend reversal. This change leads to a price increase in this currency pair.
In this situation, the blue zone of the moving average line is considered a Buy entry signal.

Bearish Trend Conditions
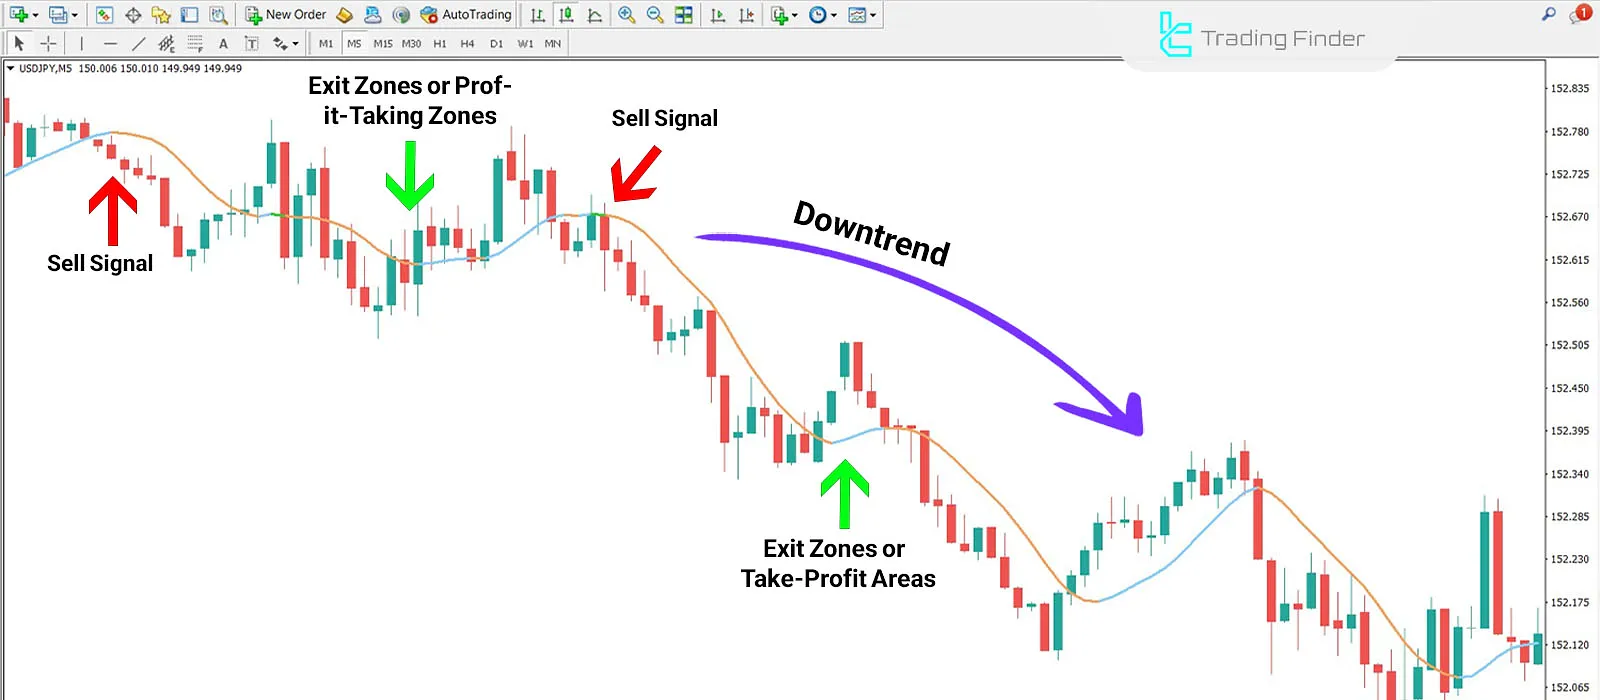
Based on the chart image below, the USD/JPY currency pair is analyzed in the 5-minute time frame. A change in the moving average line's color from blue to orange indicates a price trend reversal, followed by a bearish trend.
In such cases, the red zone of the moving average line is considered a Sell entry signal.

Zerolag Moving Average Indicator Settings
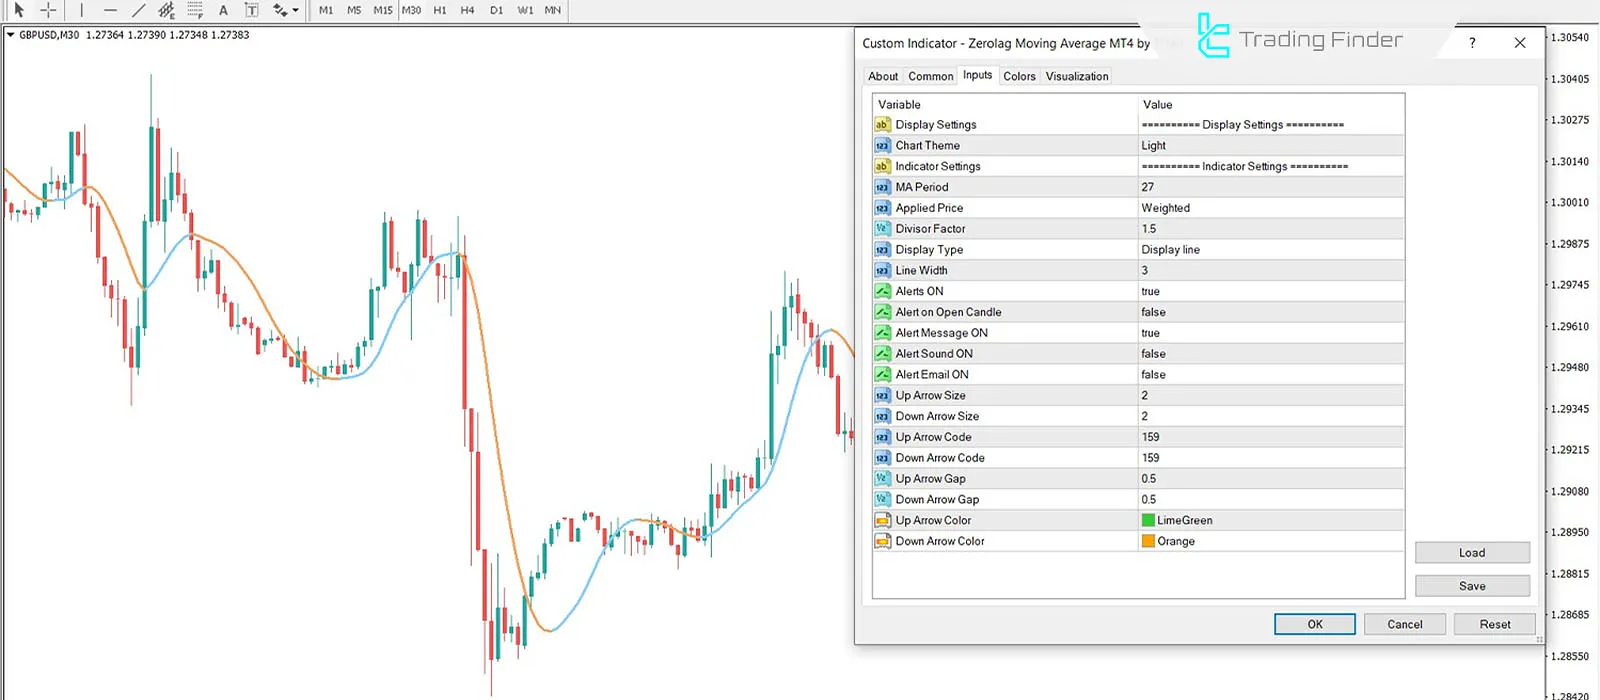
In the image below, you can view the comprehensive settings of this indicator:

- Chart Theme: Indicator theme;
- MA Period: Moving average period;
- Applied Price: Base calculation price (Weighted);
- Divisor Factor: Reaction coefficient (1.5);
- Display Type: Display as lines with dots;
- Line Width: Line thickness (5);
- Alerts On: Enable alerts (true);
- Alerts On Open Candle: Alert at candle start;
- Alerts Message On: Enable message alerts;
- Alerts Sound On: Enable sound alerts;
- Alerts Email On: Enable email alerts;
- Up Arrow Size: Upper arrow thickness;
- Down Arrow Size: Lower arrow thickness;
- Up Arrow Code: Upper arrow type;
- Down Arrow Code: Lower arrow type;
- Up Arrow Gap: Upper arrow spacing;
- Down Arrow Gap: Lower arrow spacing;
- Up Arrow Color: Upper arrow color;
- Down Arrow Color: Lower arrow color.
Conclusion
This MetaTrader 4 Signal & Forecast indicator, with its simple and practical design, clearly displays trend reversal alerts. Traders can use these alerts as Buy and Sell signals. Accordingly, after the Moving Average line is broken upward or downward, and its color changes, an entry or exit signal is generated.
Zerolag Moving Average Meta MT4 PDF
Zerolag Moving Average Meta MT4 PDF
Click to download Zerolag Moving Average Meta MT4 PDFCan the settings of this indicator be adjusted according to the strategy?
Yes, every trader can customize the settings according to their strategy for better visual representation.
What is the best time period to use with this indicator?
The 27-period setting is suitable for this indicator. However, it can be adjusted to achieve better results depending on the chart being traded.


