![Chande Momentum Indicator in MT5 Download - Free - [TFlab]](https://cdn.tradingfinder.com/image/152566/4-24-en-chande-momentum-mt5-1.webp)
![Chande Momentum Indicator in MT5 Download - Free - [TFlab] 0](https://cdn.tradingfinder.com/image/152566/4-24-en-chande-momentum-mt5-1.webp)
![Chande Momentum Indicator in MT5 Download - Free - [TFlab] 1](https://cdn.tradingfinder.com/image/152559/4-24-en-chande-momentum-mt5-2.webp)
![Chande Momentum Indicator in MT5 Download - Free - [TFlab] 2](https://cdn.tradingfinder.com/image/152560/4-24-en-chande-momentum-mt5-3.webp)
![Chande Momentum Indicator in MT5 Download - Free - [TFlab] 3](https://cdn.tradingfinder.com/image/152561/4-24-en-chande-momentum-mt5-4.webp)
The Chande Momentum Oscillator indicator is one of the practical tools in MetaTrader 5 indicators that oscillates between +100 and -100, helping traders identify overbought and oversold conditions.
When the oscillator approaches +100, it signals an overbought condition, indicating a potential price reversal or correction.
Conversely, a drop near -100 represents an oversold condition, which may present a buying opportunity and potential price growth.
Indicator Table
Indicator Categories: | Oscillators MT5 Indicators Currency Strength MT5 Indicators Trading Assist MT5 Indicators |
Platforms: | MetaTrader 5 Indicators |
Trading Skills: | Intermediate |
Indicator Types: | Reversal MT5 Indicators |
Timeframe: | Multi-Timeframe MT5 Indicators |
Trading Style: | Intraday MT5 Indicators |
Trading Instruments: | Forex MT5 Indicators Crypto MT5 Indicators Stock MT5 Indicators Forward MT5 Indicators Share Stock MT5 Indicators |
Overview of the Indicator
Unlike RSI or MACD, the Chande Momentum Oscillator analyzes price changes over specific periods rather than averaging prices. This unique approach provides traders with a clear view of price trends' speed and intensity, aiding in timely decision-making. As such, this indicator is a powerful tool for early detection of trends and changes.
Indicator in an Uptrend
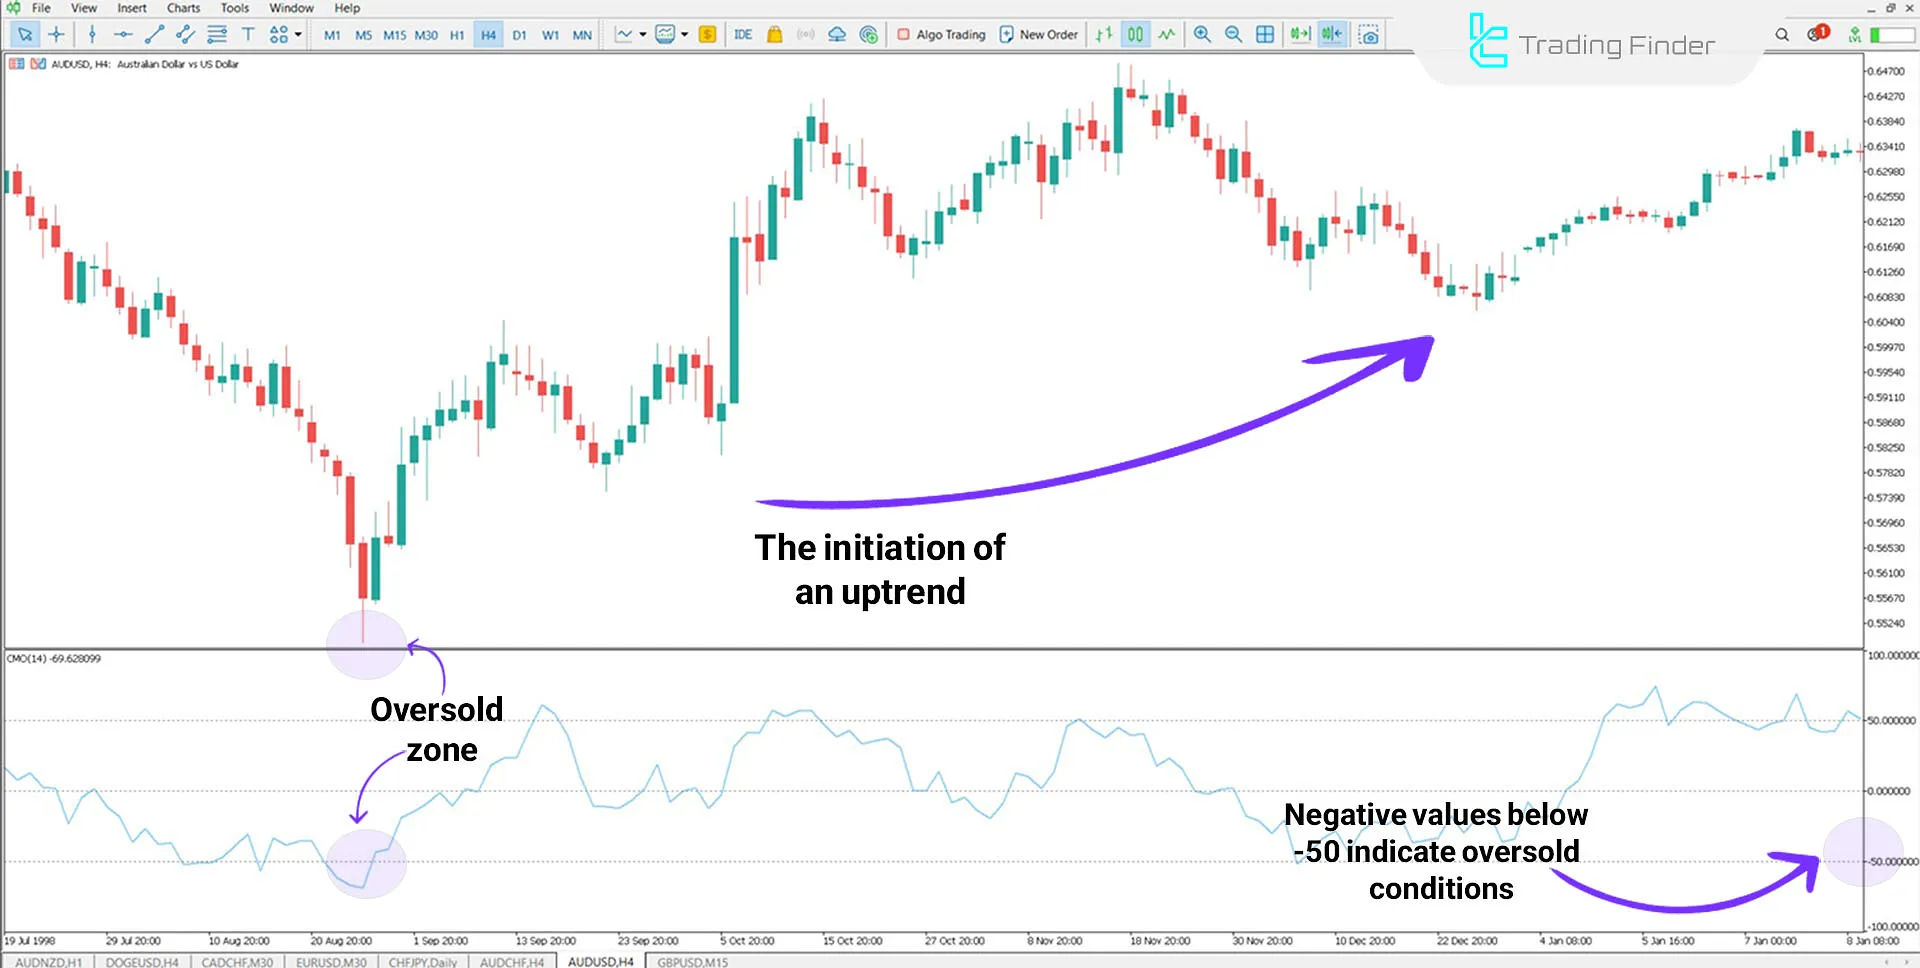
In the AUD/USD currency pair chart on a 4-hour timeframe, the price approaches the oversold zone following a downward movement.
This scenario indicates reduced seller strength and increased buyer interest in entering the market. In such cases, the Chande Momentum Oscillator fluctuates between -50 and -100, signaling a potential price reversal to the upside.

Indicator in a Downtrend
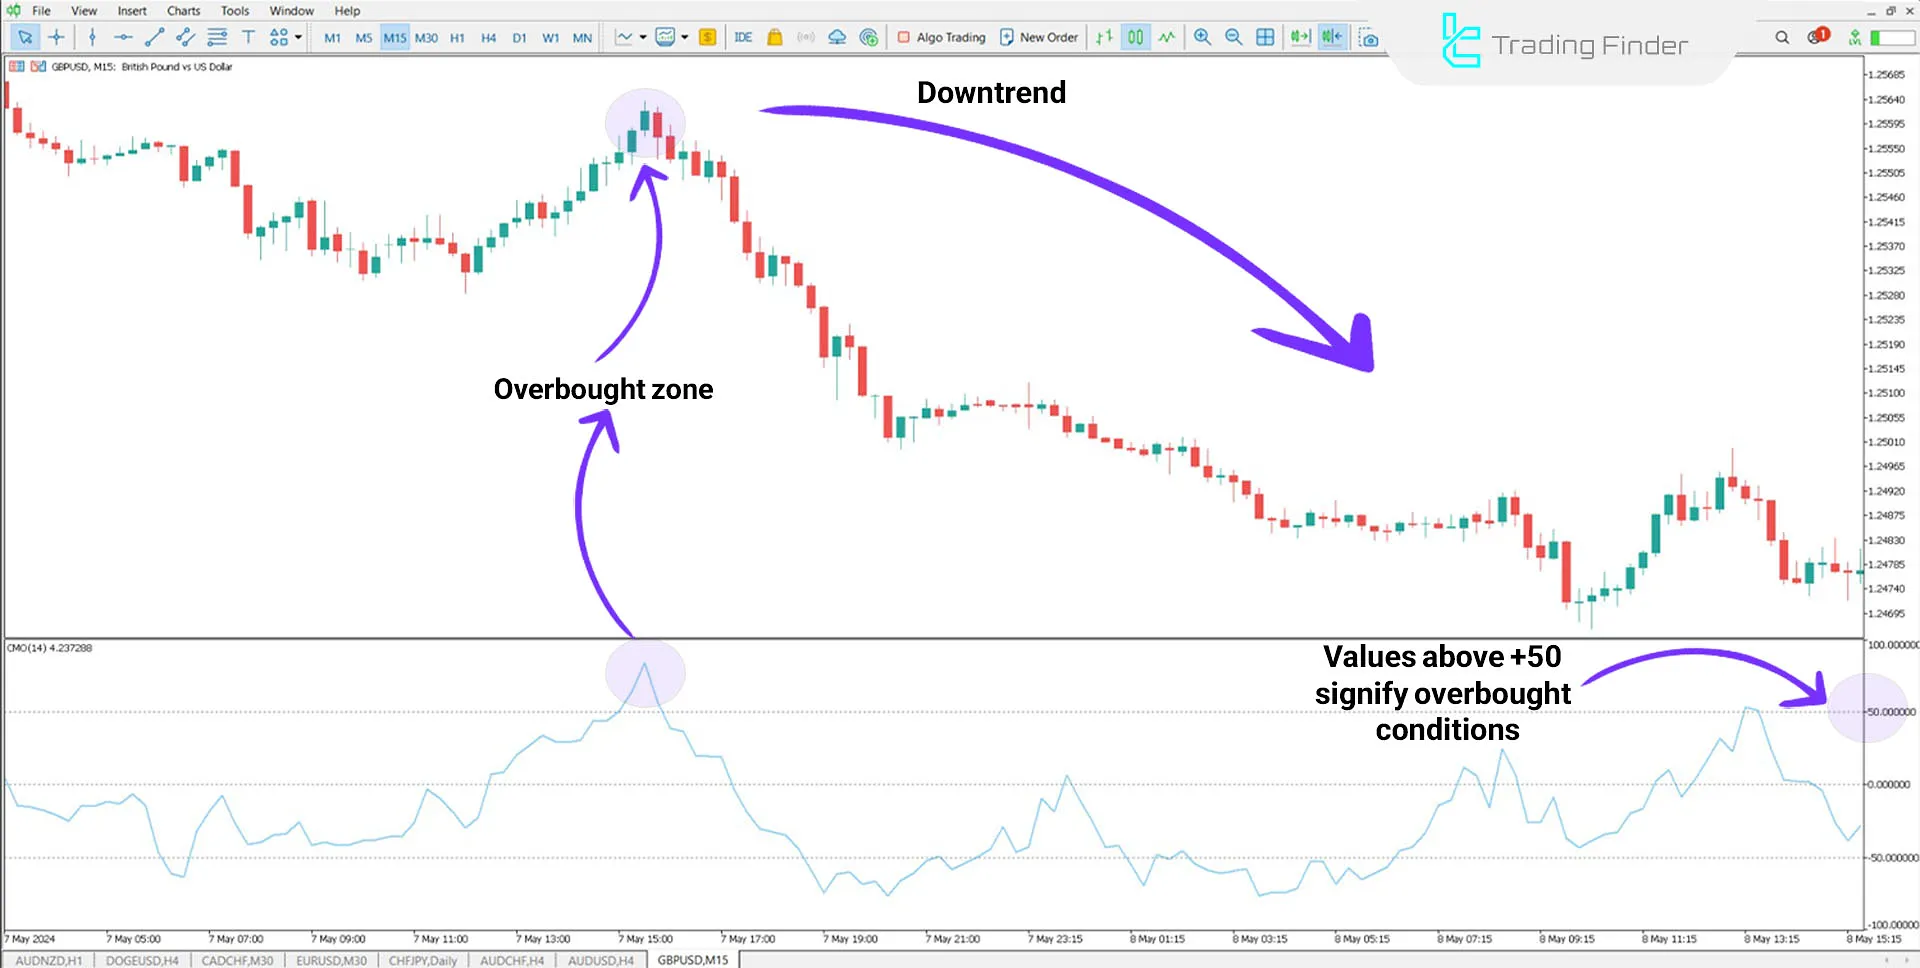
In a downtrend, such as the GBP/USD currency pair, the Chande Momentum Oscillator reaches the higher range, indicating the overbought zone.
This suggests weakened buyer strength, increasing the likelihood of a price reversal to the downside. Traders can use this indicator alongside their strategies and confirmations to enter Sell trades effectively.

Indicator Settings

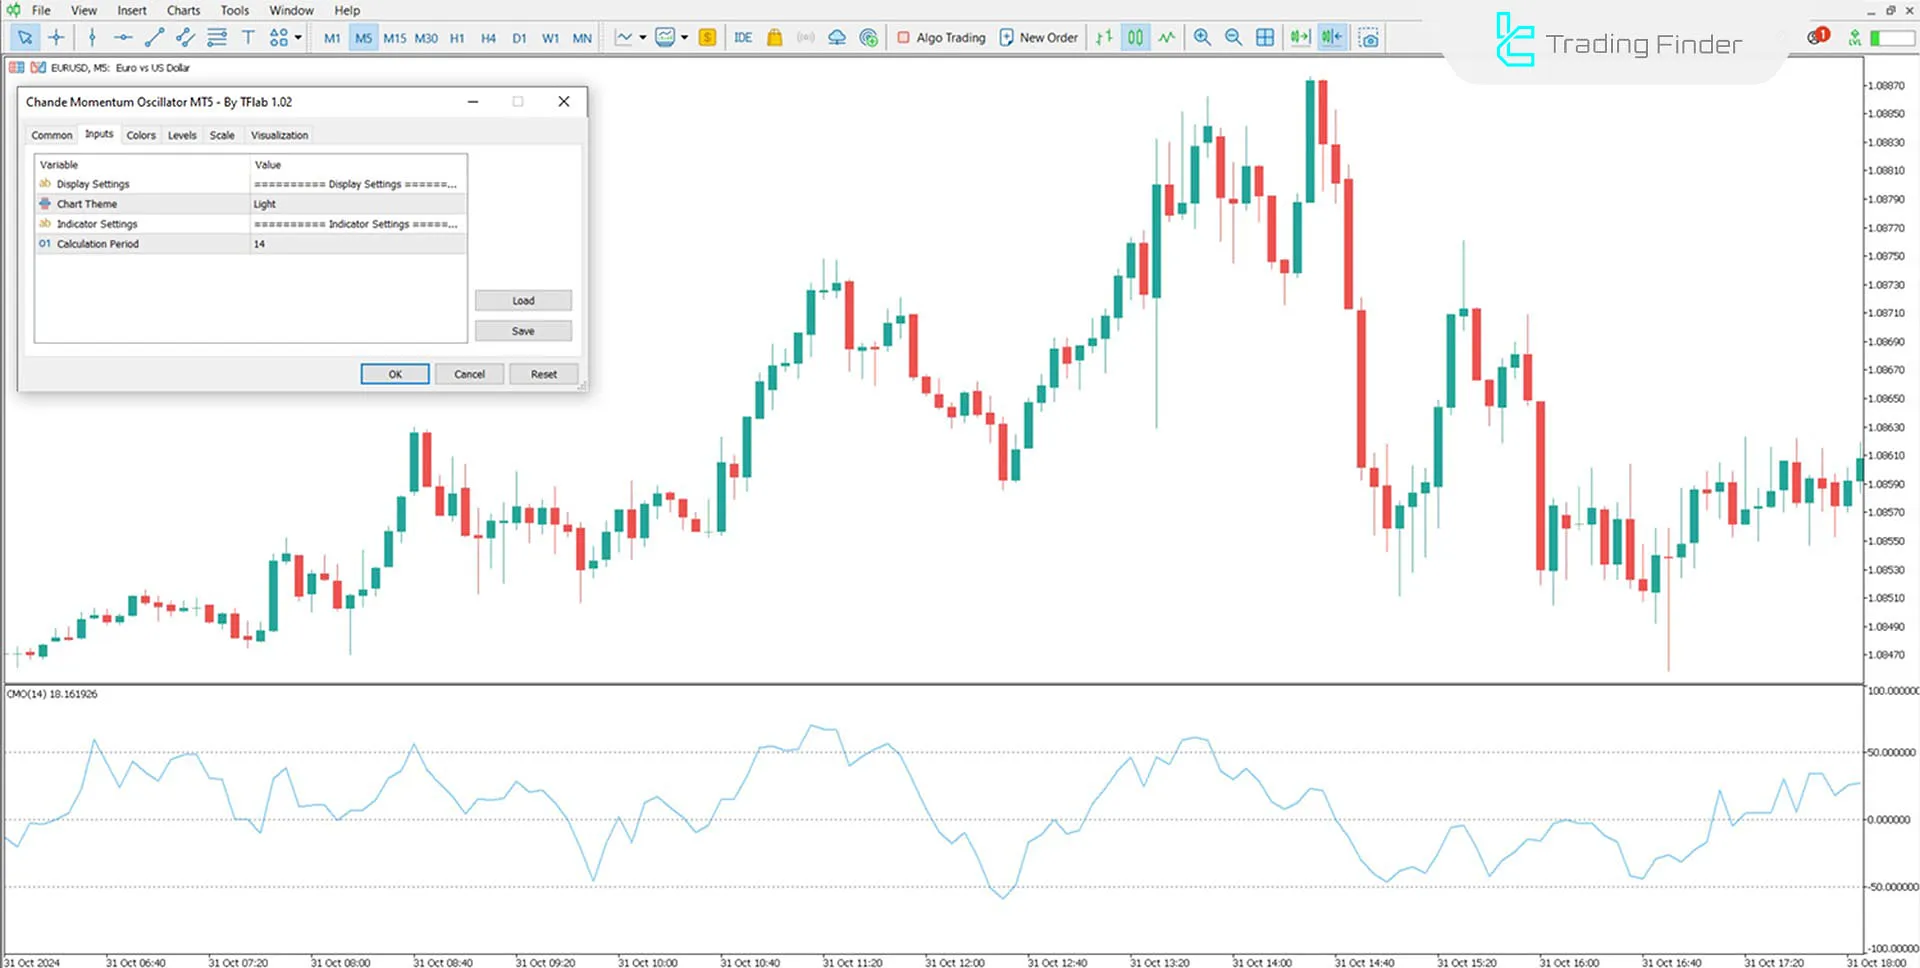
- Chart Theme :Background settings for the indicator;
- Period: The number of candlesticks used in calculations (default: 14).
Conclusion
The Chande Momentum Oscillator indicator analyzes price changes over specific time periods and performs differently compared to indicators RSI and MACD.
This indicator can be used across various timeframes, including daily and hourly timeframes, making it suitable for day trading.
Chande Momentum MT5 PDF
Chande Momentum MT5 PDF
Click to download Chande Momentum MT5 PDFCan this indicator be used for all financial markets?
Yes, it is suitable for various markets, including forex, cryptocurrencies, and stocks, and supports technical analysis across these markets
Is the Chande Momentum Oscillator sufficient for decision-making on its own?
No, combining it with other technical tools like RSI, MACD, or support and resistance lines can help identify more precise and reliable signals.


