![Classic Crab Harmonic Pattern Indicator for MetaTrader 5 Download – Free – [TFlab]](https://cdn.tradingfinder.com/image/325564/4-77-en-classic-crab-harmonic-pattern-mt5-1.webp)
![Classic Crab Harmonic Pattern Indicator for MetaTrader 5 Download – Free – [TFlab] 0](https://cdn.tradingfinder.com/image/325564/4-77-en-classic-crab-harmonic-pattern-mt5-1.webp)
![Classic Crab Harmonic Pattern Indicator for MetaTrader 5 Download – Free – [TFlab] 1](https://cdn.tradingfinder.com/image/325563/4-77-en-classic-crab-harmonic-pattern-mt5-2.webp)
![Classic Crab Harmonic Pattern Indicator for MetaTrader 5 Download – Free – [TFlab] 2](https://cdn.tradingfinder.com/image/325561/4-77-en-classic-crab-harmonic-pattern-mt5-3.webp)
![Classic Crab Harmonic Pattern Indicator for MetaTrader 5 Download – Free – [TFlab] 3](https://cdn.tradingfinder.com/image/325562/4-77-en-classic-crab-harmonic-pattern-mt5-4.webp)
On July 1, 2025, in version 2, alert/notification and signal functionality was added to this indicator
The Classic Crab Harmonic Pattern is one of the most widely used patterns in technical analysis that was introduced by Scott Carney in 2000.
Using Fibonacci ratios, this pattern identifies price reversal zones and is popular among traders due to its favorable risk-to-reward ratio.
The Classic Crab Harmonic Pattern Indicator for MetaTrader 5 is designed to automatically detect this pattern on price charts.
This MT5 classic chart pattern indicator identifies the key points X, A, B, C, and D, displaying bullish patterns in pink and bearish patterns in blue.
Classic Crab Harmonic Pattern Indicator Table
The following table summarizes the features of the Classic Crab Harmonic Pattern Indicator:
Indicator Categories: | Support & Resistance MT5 Indicators Chart & Classic MT5 Indicators Harmonic MT5 Indicators |
Platforms: | MetaTrader 5 Indicators |
Trading Skills: | Intermediate |
Indicator Types: | Reversal MT5 Indicators |
Timeframe: | Multi-Timeframe MT5 Indicators |
Trading Style: | Day Trading MT5 Indicators |
Trading Instruments: | Forex MT5 Indicators Crypto MT5 Indicators Stock MT5 Indicators Indices MT5 Indicators Forward MT5 Indicators Share Stock MT5 Indicators |
Indicator at a Glance
In this MT5 Harmonic Pattern Indicator, Fibonacci ratios are used as the key factor for identifying Price Reversal Zones (PRZ):
- AB wave: Retracement between 38.2% to 61.8% of XA
- BC wave: Retracement at either 38.2% or 88.6% of AB
- CD wave: If BC retraces 38.2%, the CD wave extends to 224% of it
- CD wave relative to XA: It should form 161.8% of XA, which makes point D the potential Price Reversal Zone (PRZ)
Indicator in an Uptrend
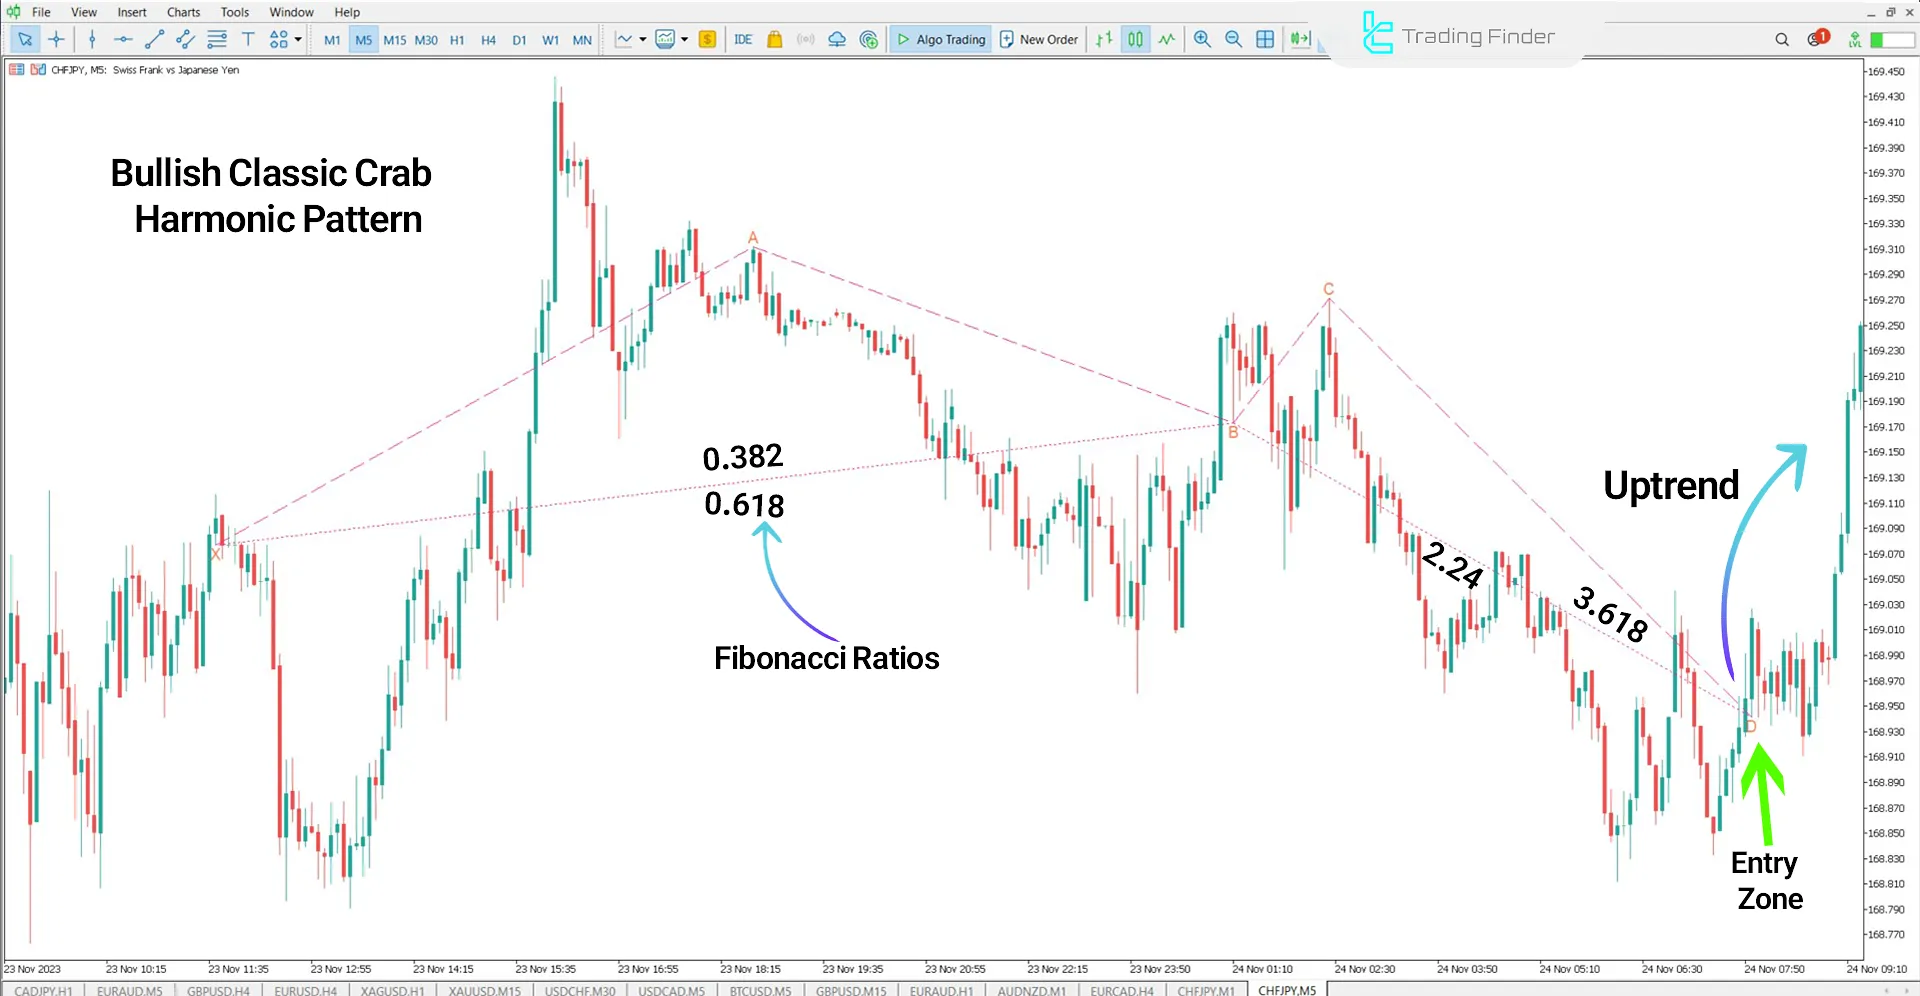
In the CHF/JPY price chart, the Classic Crab Harmonic Pattern Indicator automatically identifies the Price Reversal Zone (PRZ) and displays it on the chart.
At point D, the price trend turns upward, confirming a price reversal from this level.

Indicator in a Downtrend
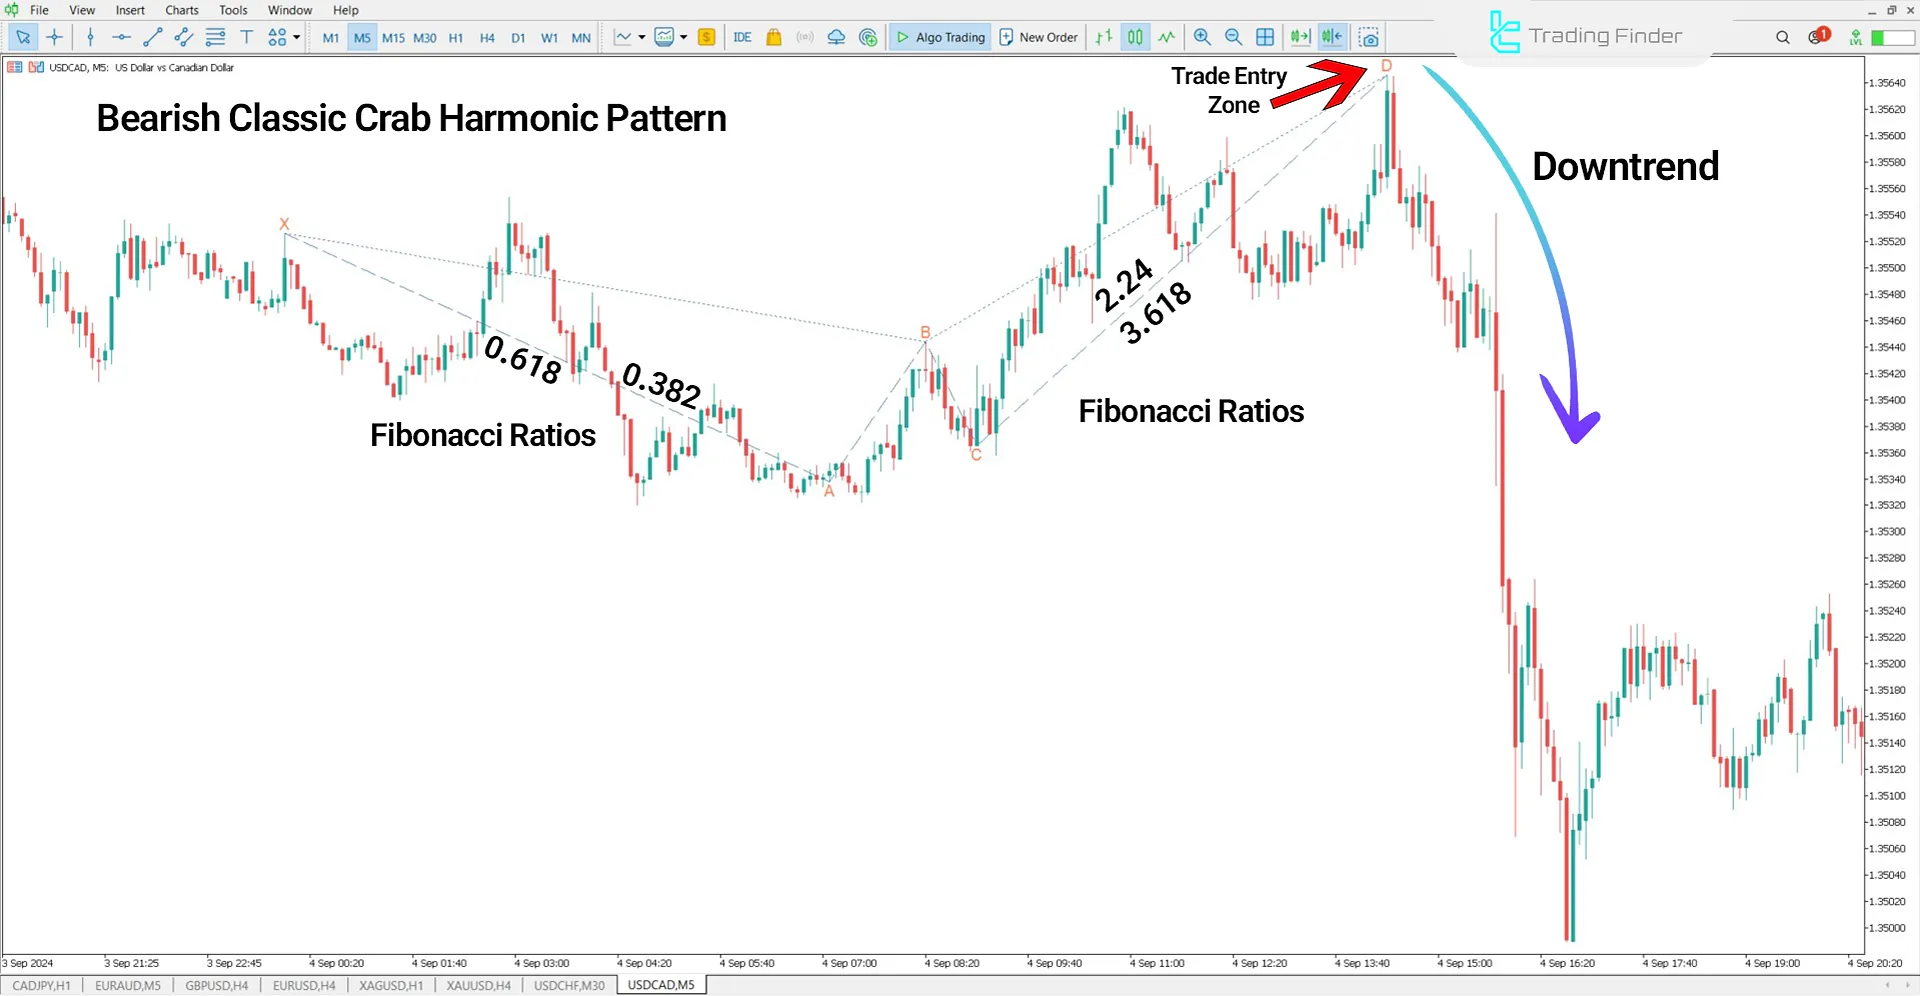
In the USD/CAD 5-minute chart, the indicator identifies an upward Crab pattern.
Traders can enter a buy position after receiving confirmation of the reversal at point D, placing a stop-loss before the PRZ area.

Classic Crab Harmonic Pattern Indicator Settings
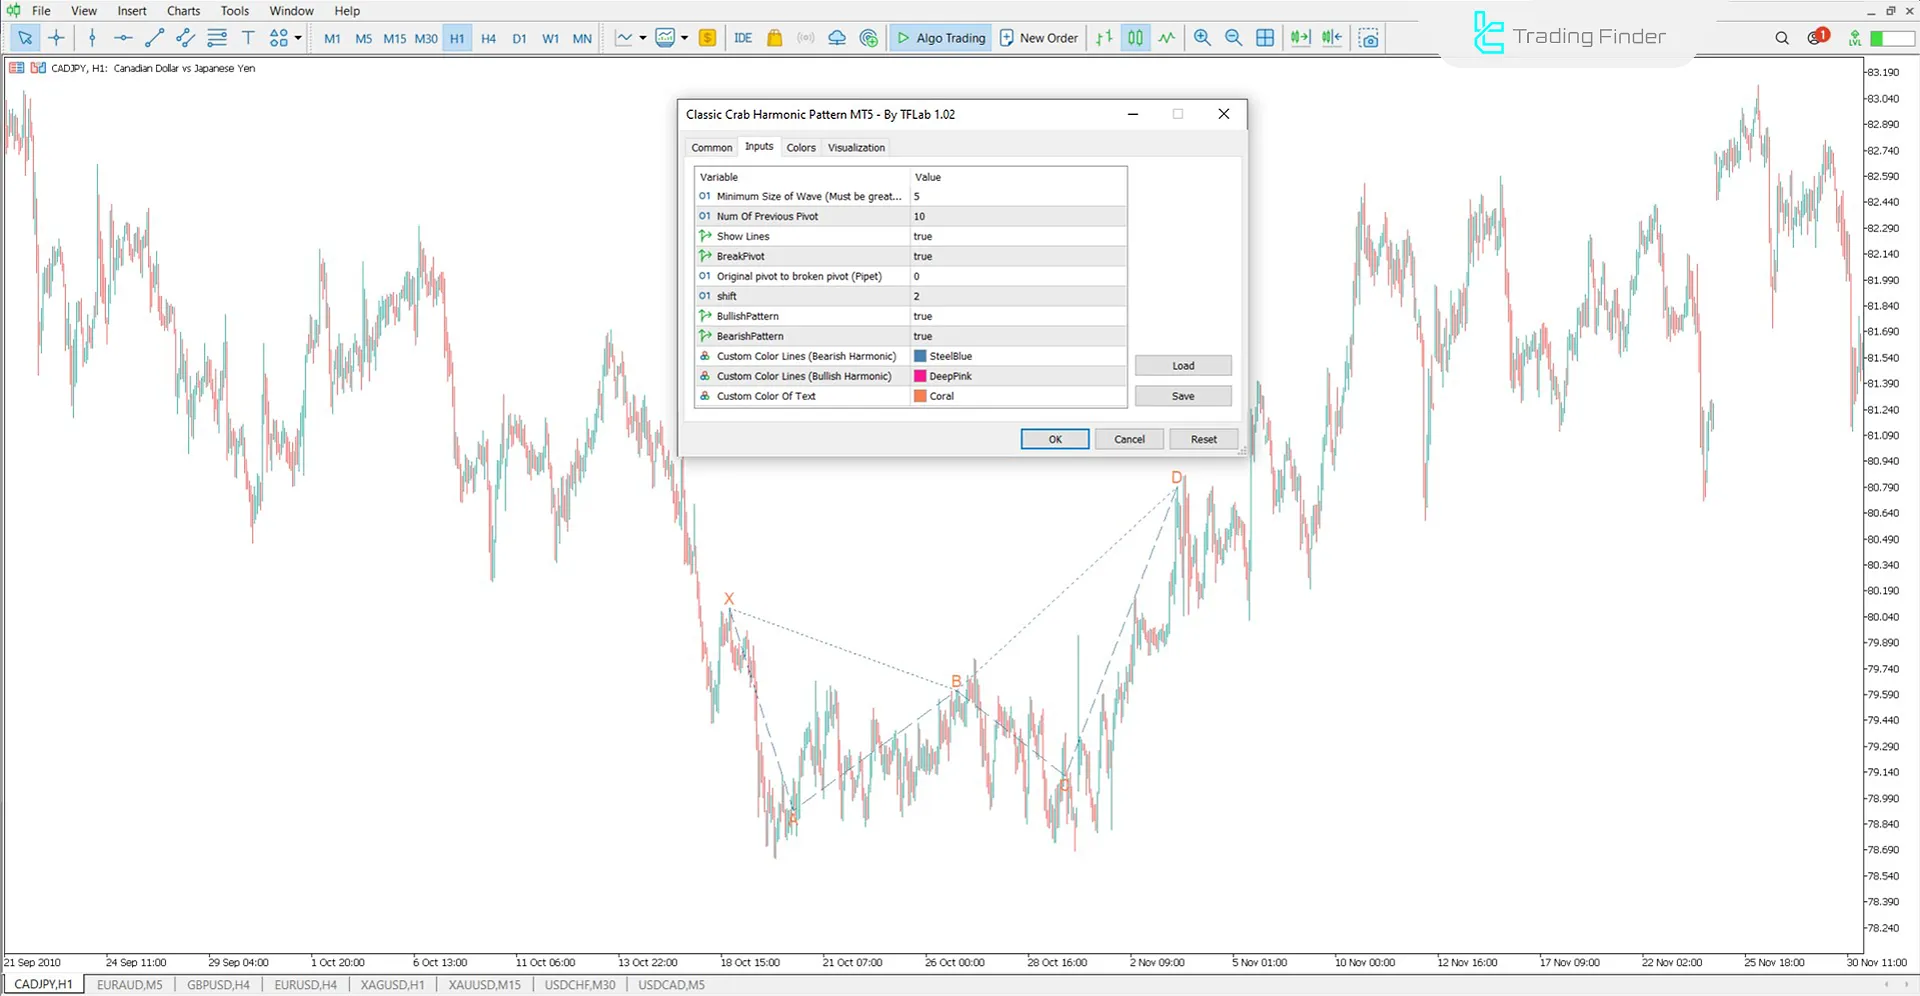
The settings for the Classic Crab Harmonic Pattern Indicator are shown below:

- Minimum Length of Wave (candle): Minimum wave length in terms of the number of candles
- Num Of Previous Candle: Number of previous candles for analysis
- Show Lines: Display or hide the pattern lines
- BreakPivot: Check for pivot break
- Original Pivot to Broken Pivot (Pipet): Distance between the original pivot and the broken pivot in pips
- Shift: Amount of data shift on the chart
- BullishPattern: Identifying bullish harmonic patterns
- BearishPattern: Identifying bearish harmonic patterns
- Style Of Line: Set the style of the lines on the chart
- Width Of Line: Set the thickness of the displayed lines
- Custom Color Lines (Bearish Harmonic): Change the color of bearish pattern lines
- Custom Color Lines (Bullish Harmonic): Customize the color of bullish pattern lines
- Custom Color Of Text: Set the color of displayed text
Conclusion
Using the Classic Crab Harmonic Pattern indicator, traders can automatically detect the Crab Harmonic Pattern on price charts of Forex currency pairs and other financial markets.
The Crab pattern has both bullish and bearish structures that form based on the price direction on the chart. In the bullish pattern, after reaching point D, the price is likely to increase, while in the bearish pattern, a decrease in price can be expected from point D.
Classic Crab Harmonic Pattern MT5 PDF
Classic Crab Harmonic Pattern MT5 PDF
Click to download Classic Crab Harmonic Pattern MT5 PDFIn which markets can this indicator be used?
This indicator can be used in Forex, stock markets, cryptocurrency markets, and other financial markets.
Is this indicator enough by itself for trading?
No, it is recommended to use this indicator in conjunction with candlestick patterns, moving averages, RSI, or MACD for enhanced accuracy in analysis.


