![MA Cross Indicator for MetaTrader 5 – Free Download [TradingFinder]](https://cdn.tradingfinder.com/image/467697/2-108-en-ma-cross-mt5-1.webp)
![MA Cross Indicator for MetaTrader 5 – Free Download [TradingFinder] 0](https://cdn.tradingfinder.com/image/467697/2-108-en-ma-cross-mt5-1.webp)
![MA Cross Indicator for MetaTrader 5 – Free Download [TradingFinder] 1](https://cdn.tradingfinder.com/image/467685/2-108-en-ma-cross-mt5-2.webp)
![MA Cross Indicator for MetaTrader 5 – Free Download [TradingFinder] 2](https://cdn.tradingfinder.com/image/467699/2-108-en-ma-cross-mt5-3.webp)
![MA Cross Indicator for MetaTrader 5 – Free Download [TradingFinder] 3](https://cdn.tradingfinder.com/image/467690/2-108-en-ma-cross-mt5-4.webp)
On aug 4, 2025, in version 2, alert/notification and signal functionality was added to this indicator
The MA Cross Indicator operates as a linear oscillator, based on the crossover of two moving averages with different periods. In addition to showing the prevailing market trend direction, this indicator is highly effective at identifying trend reversal points.
The crossover between these two lines is considered a key signal for entering or exiting trades.
MA Cross Indicator Table
The specifications of the MA Cross Indicator are summarized in the table below.
Indicator Categories: | Oscillators MT5 Indicators Currency Strength MT5 Indicators Momentum Indicators in MT5 |
Platforms: | MetaTrader 5 Indicators |
Trading Skills: | Elementary |
Indicator Types: | Reversal MT5 Indicators |
Timeframe: | Multi-Timeframe MT5 Indicators |
Trading Style: | Intraday MT5 Indicators |
Trading Instruments: | Forex MT5 Indicators Crypto MT5 Indicators Stock MT5 Indicators |
MA Cross Indicator Overview
The MA Cross indicator visualizes the overall market trend as a blue linear oscillator, oscillating around a zero axis.
This blue line shifts position based on the relative placement of the fast and slow moving averages; when it crosses above or below zero, it signals the start of an uptrend or downtrend, respectively.
Thus, the MA Cross oscillator accurately reflects both trend direction and potential reversal points. This tool is based on two simple moving averages:
- Fast SMA: calculated from the last four candles;
- Slow SMA: calculated from the previous 14 candles.
Indicator in an Uptrend
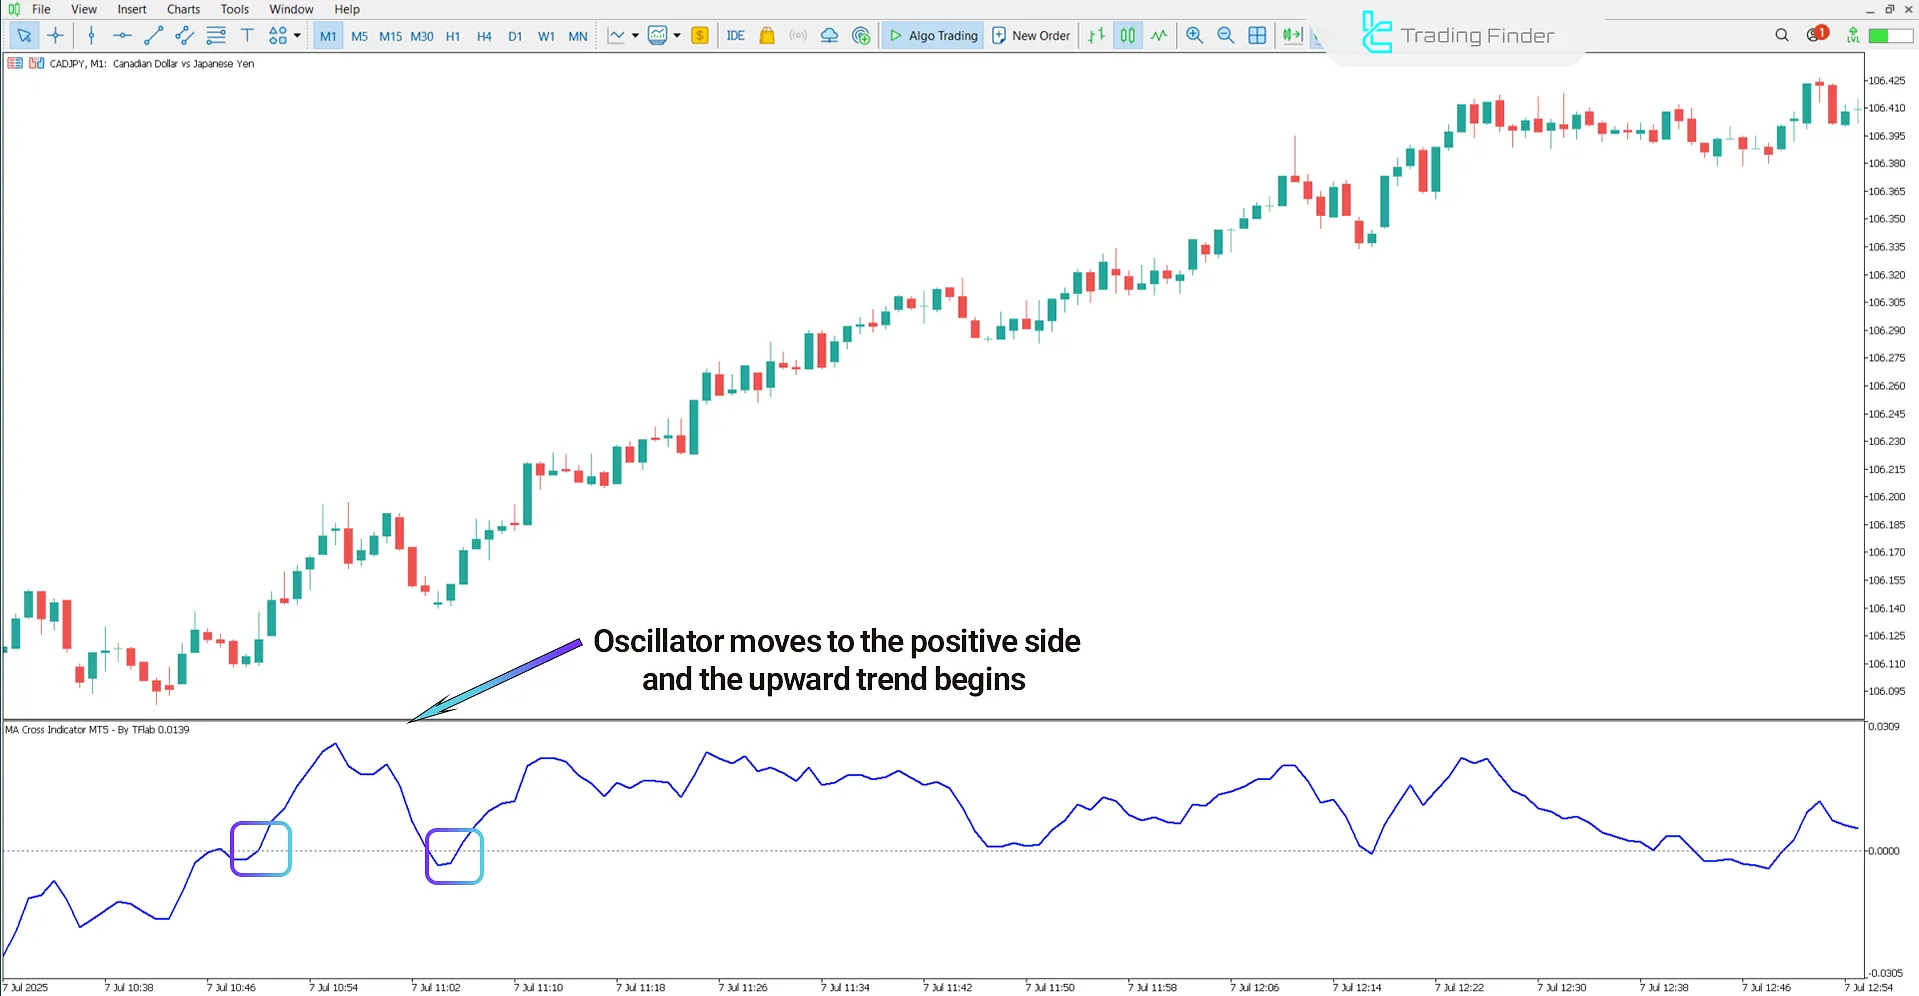
The following chart displays the CAD/JPY currency pair on a 1-minute timeframe. When the 4-period fast-moving average crosses above the 14-period slow-moving average, the blue oscillator line rises above the zero axis.
This bullish crossover is interpreted as the beginning of an uptrend, indicating increased buying power and a buy entry zone.

Indicator in a Downtrend
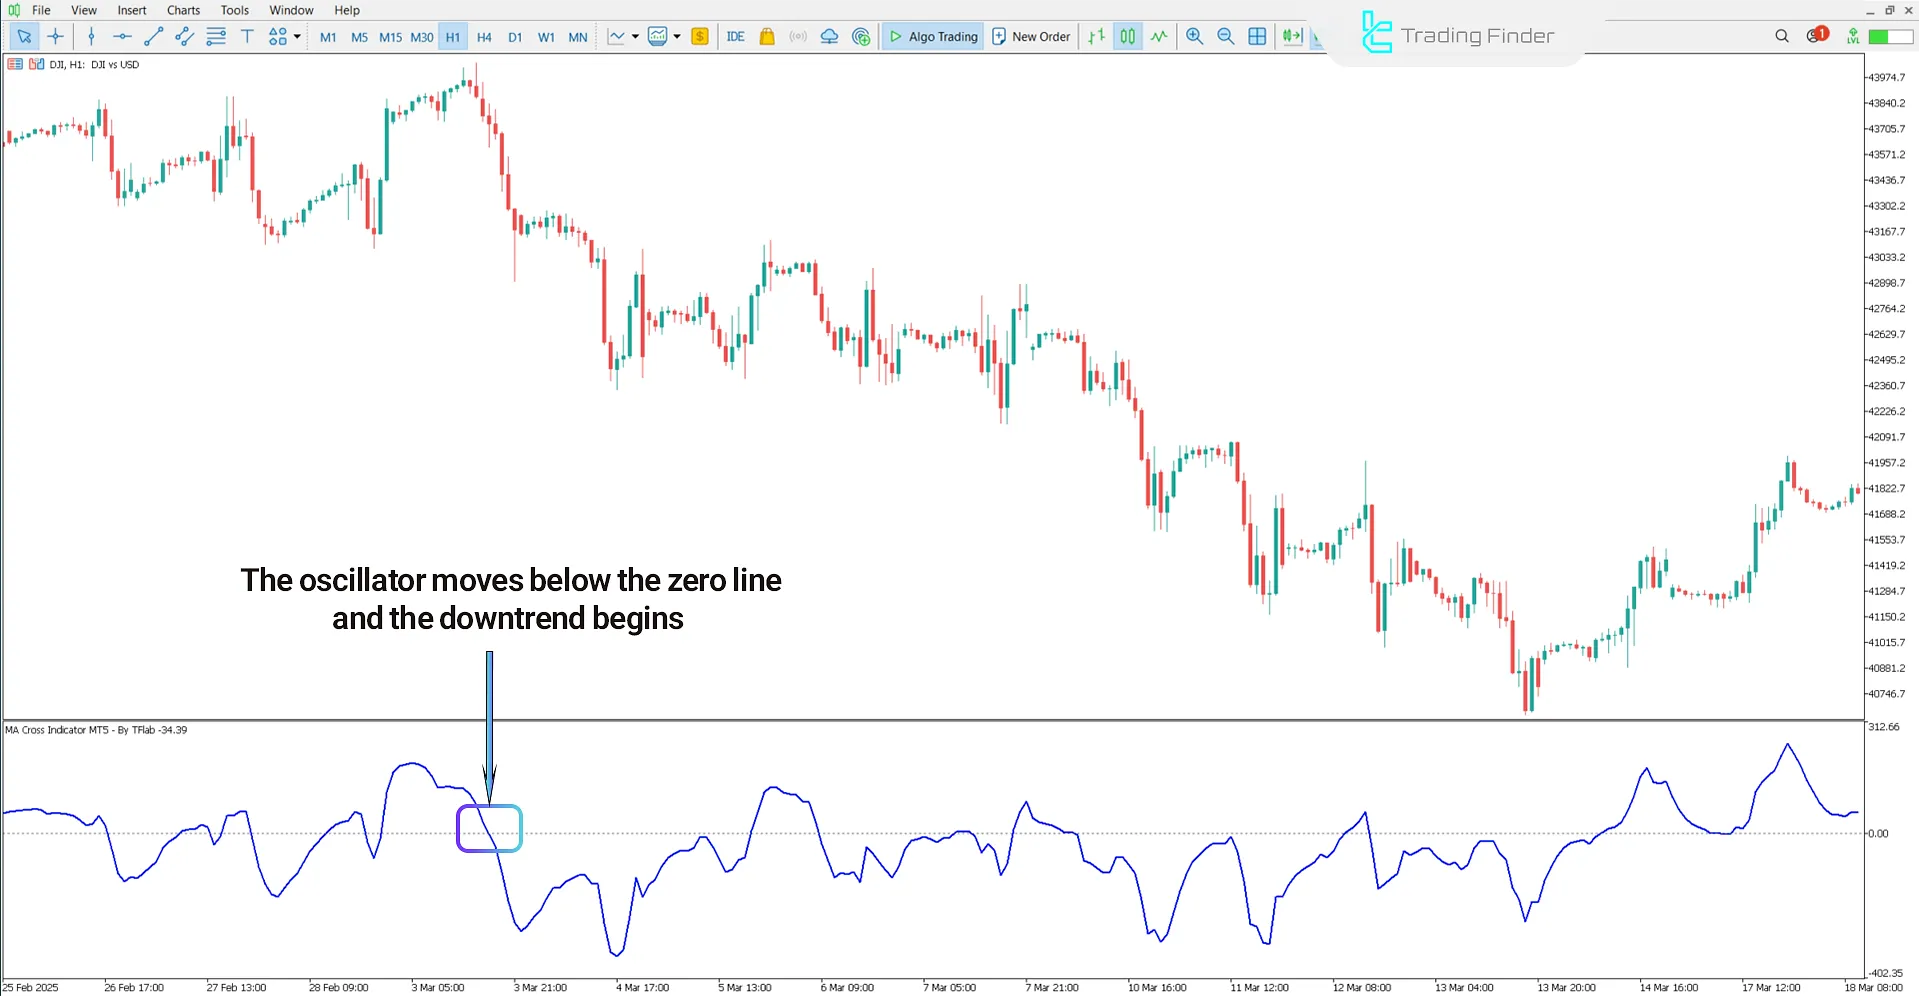
The following image shows the Dow Jones Index (DJI) on a 1-hour timeframe. When the 4-period fast-moving average crosses below the 14-period slow-moving average, this crossover indicates the start of a bearish trend and identifies a sell entry zone.

MA Cross Indicator Settings
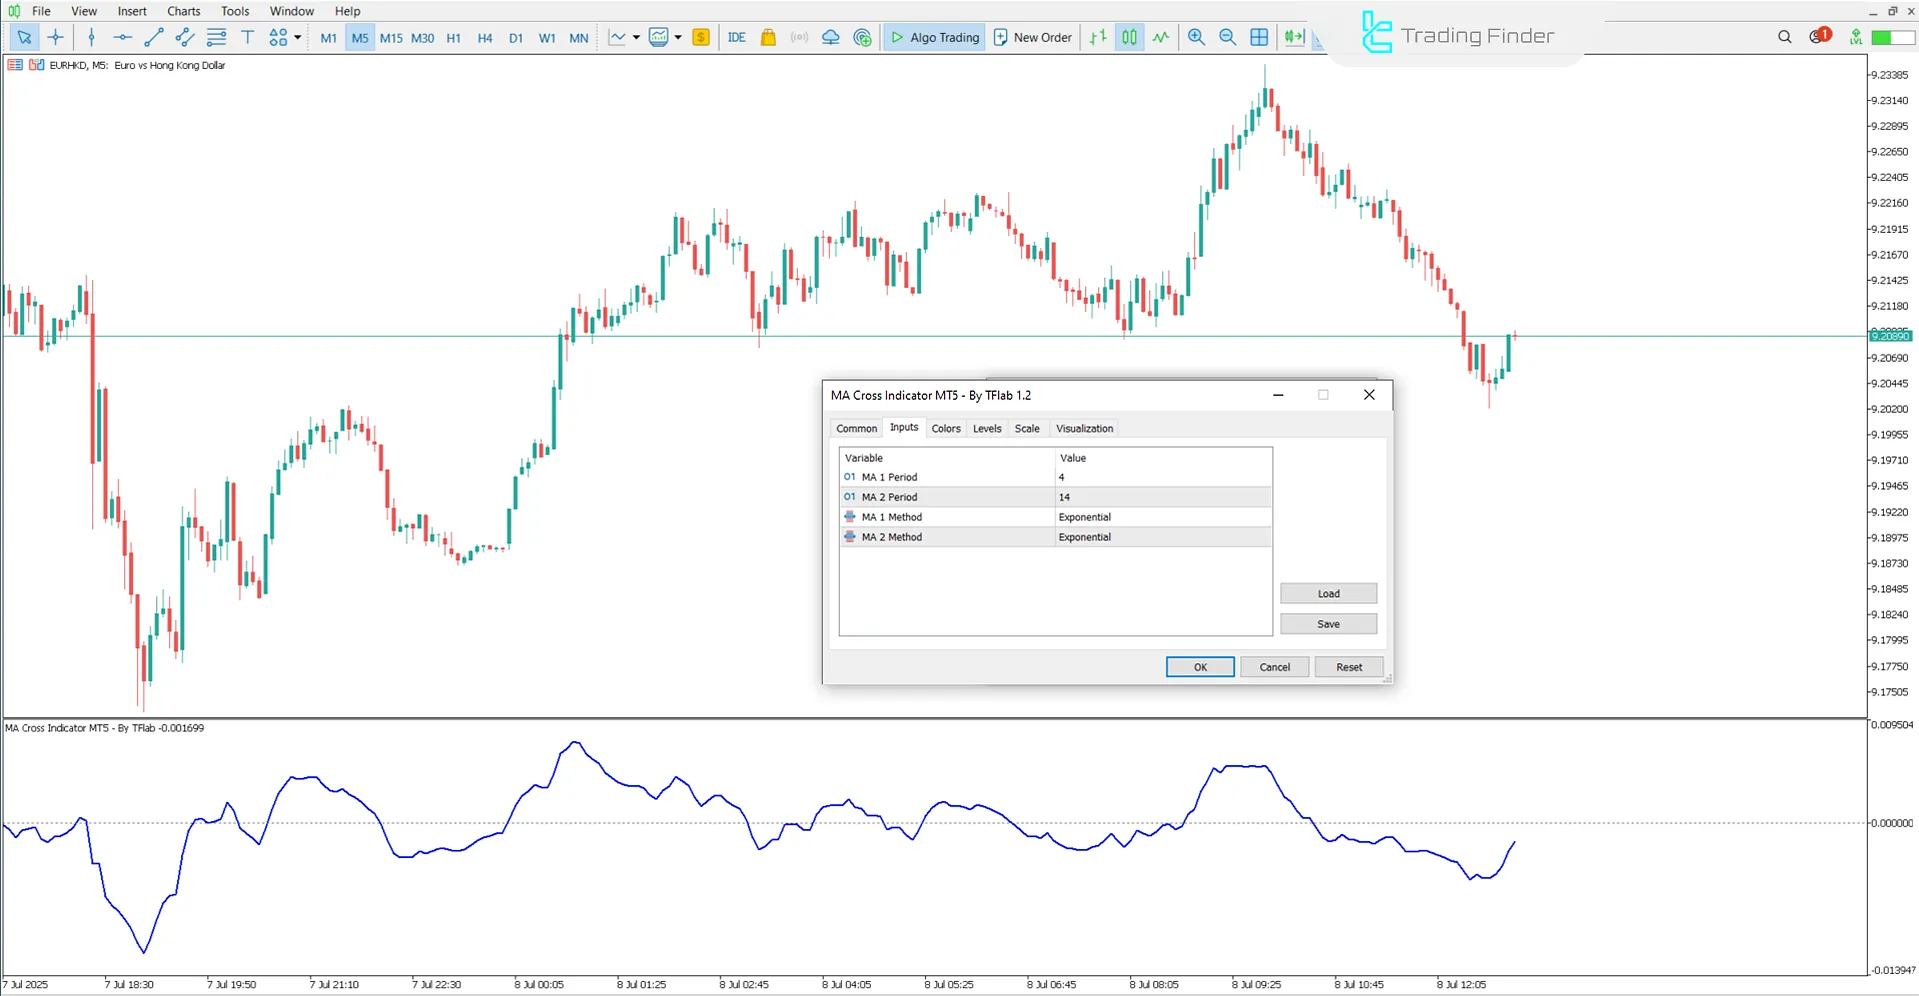
The image below shows the settings panel of the MA Cross oscillator:

- MA 1 Period: Period of the first moving average;
- MA 2 Period: Period of the second moving average;
- MA 1 Method: Calculation method of the first moving average;
- MA 2 Method: Calculation method of the second moving average.
Conclusion
TheMA Cross Indicator is a trend-based technical tool built on the crossover of twosimple moving averages with periods of 4 and 14 candles. Its output is presented as a linear oscillator that oscillates around the zero axis.
MA Cross MT5 PDF
MA Cross MT5 PDF
Click to download MA Cross MT5 PDFWhat is the MA Cross Indicator, and how does it work?
This is a technical trading tool based on the crossover of two simple moving averages, designed with different time frames and operating as a linear oscillator centered on zero.
What condition triggers a bearish signal in the MA Cross Indicator?
A bearish signal is generated when the fast-moving average crosses below the slow-moving average, and the oscillator drops below zero, indicating the start of a downward trend.


