![Download MMR Indicator [a Combination of 4 Indicators: MACD, EMA, LWMA, and RSI] MT5](https://cdn.tradingfinder.com/image/453788/2-101-en-mmr-mt5-1.webp)
![Download MMR Indicator [a Combination of 4 Indicators: MACD, EMA, LWMA, and RSI] MT5 0](https://cdn.tradingfinder.com/image/453788/2-101-en-mmr-mt5-1.webp)
![Download MMR Indicator [a Combination of 4 Indicators: MACD, EMA, LWMA, and RSI] MT5 1](https://cdn.tradingfinder.com/image/453789/2-101-en-mmr-mt5-2.webp)
![Download MMR Indicator [a Combination of 4 Indicators: MACD, EMA, LWMA, and RSI] MT5 2](https://cdn.tradingfinder.com/image/453791/2-101-en-mmr-mt5-3.webp)
![Download MMR Indicator [a Combination of 4 Indicators: MACD, EMA, LWMA, and RSI] MT5 3](https://cdn.tradingfinder.com/image/453795/2-101-en-mmr-mt5-4.webp)
The MMR Indicator on the MetaTrader 5 platform consists of four primary technical analysis tools: MACD, Exponential Moving Average (EMA), Linear Weighted MovingAverage (LWMA), and the Relative Strength Index (RSI).
The indicator's output is shown as a histogram, where green and red bars highlight potential trade entry points based on the prevailing market trend direction.
MMR Indicator Table
The general specifications of the MMR Combined Indicator are presented in the table below.
Indicator Categories: | Oscillators MT5 Indicators Currency Strength MT5 Indicators Momentum Indicators in MT5 MACD Indicators for MetaTrader 5 |
Platforms: | MetaTrader 5 Indicators |
Trading Skills: | Intermediate |
Indicator Types: | Reversal MT5 Indicators |
Timeframe: | Multi-Timeframe MT5 Indicators |
Trading Style: | Intraday MT5 Indicators |
Trading Instruments: | Forex MT5 Indicators Crypto MT5 Indicators Stock MT5 Indicators |
Indicator Overview
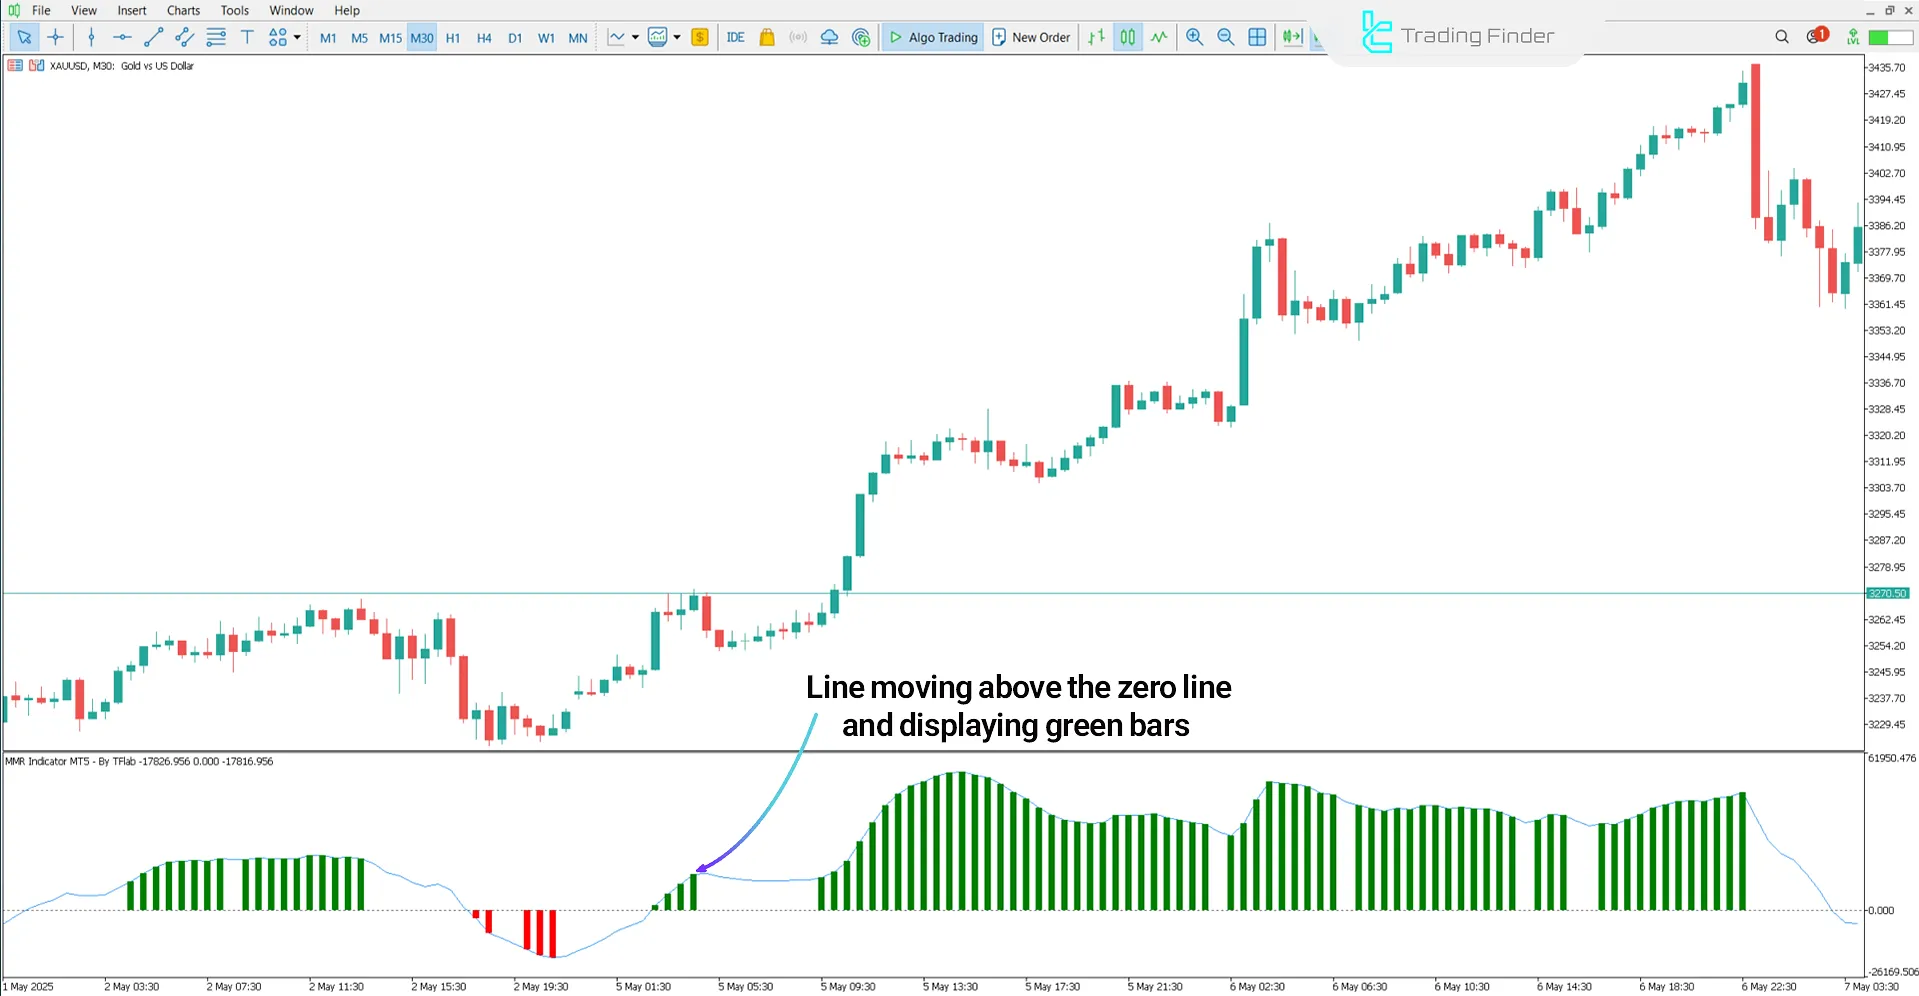
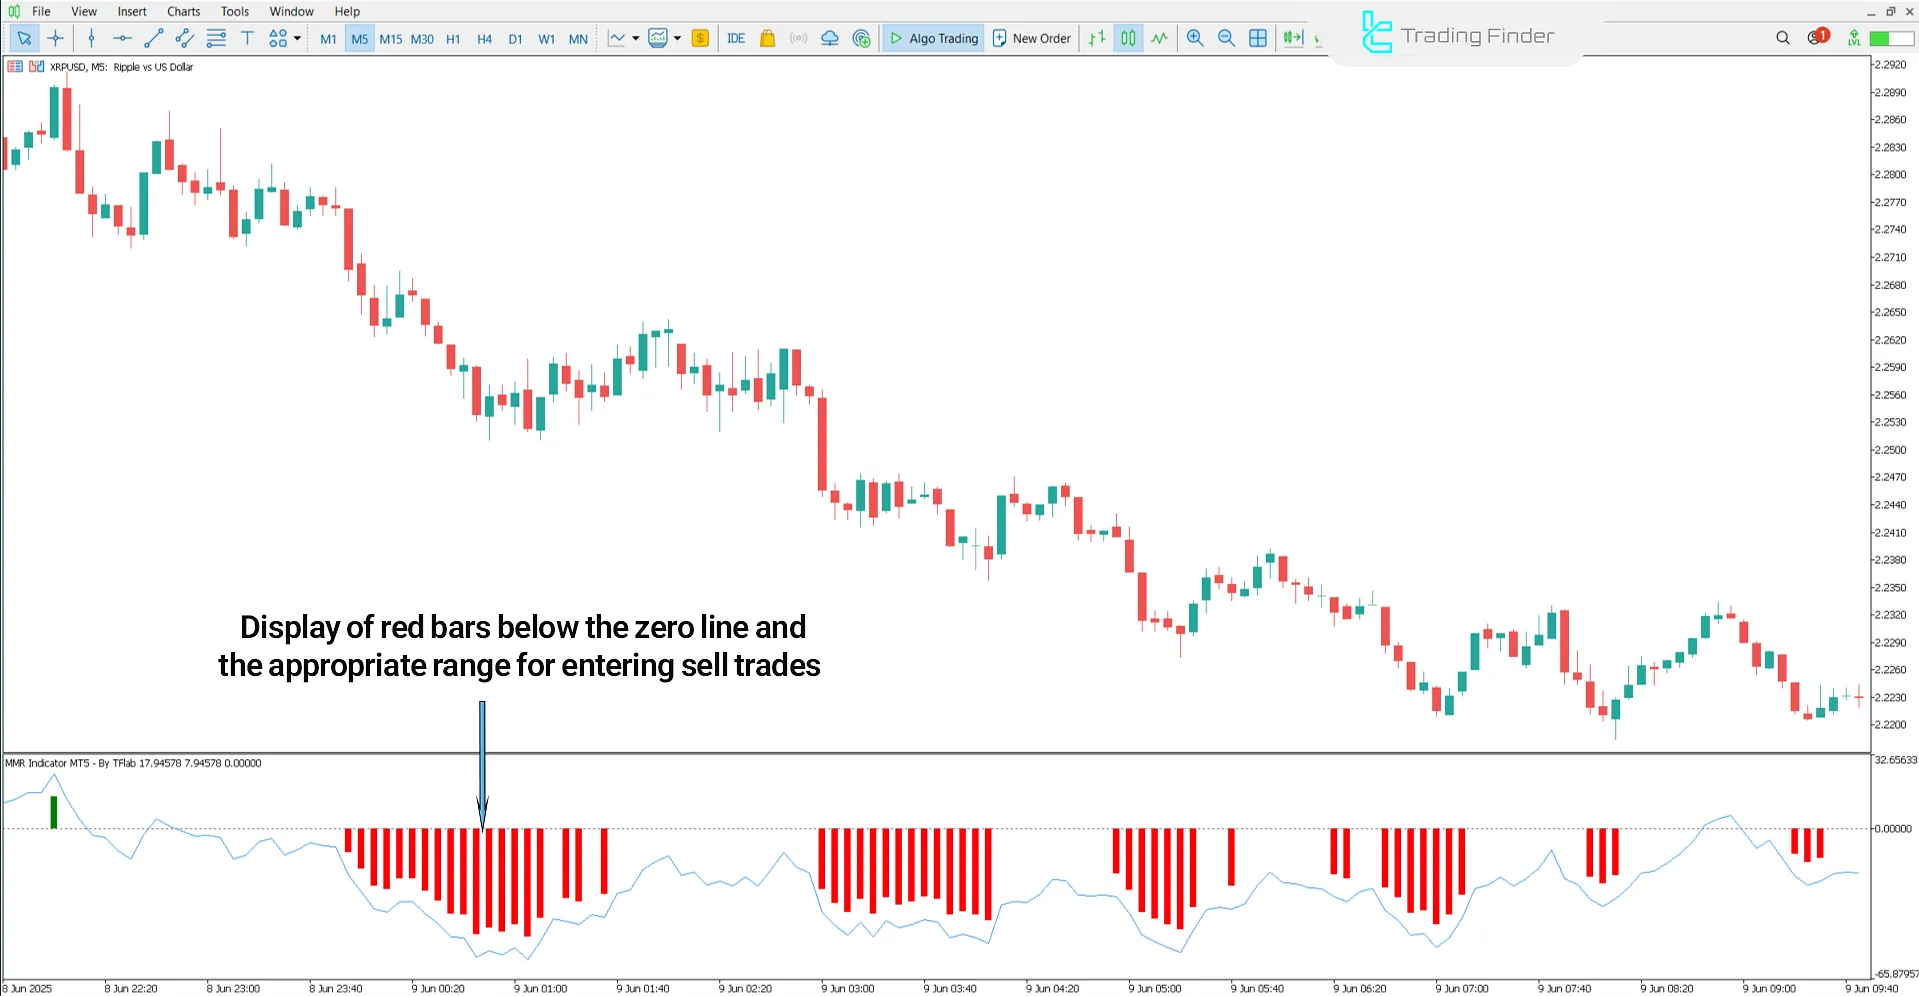
In MetaTrader 5, the MMR Indicator displays green bars above the zero axis, indicating a bullish market condition, and red bars below zero, showing selling pressure and a bearish trend.
These bars are constructed by averaging the output of the four core indicators to identify both trend strength and direction.
Uptrend Conditions
The following chart shows Gold (XAU/USD) in a 30-minute timeframe. In this oscillator, the RSI exiting the oversold zone signals a decrease in selling pressure and a possible market reversal.
Simultaneously, the appearance of a green bar in the positive region of the MMR histogram, along with a bullish candlestick, creates a potential buy entry opportunity.

Downtrend Conditions
The image below displays Ripple (XRP/USD) in a 5-minute timeframe. The RSI exiting the overbought zone indicates weakening buying power and the potential beginning of a corrective phase.
At the same time, when the price falls below the EMA or LWMA, accompanied by negative MMR histogram values, it signals a trend reversal and highlights a potential sell entry zone.

MMR Indicator Settings
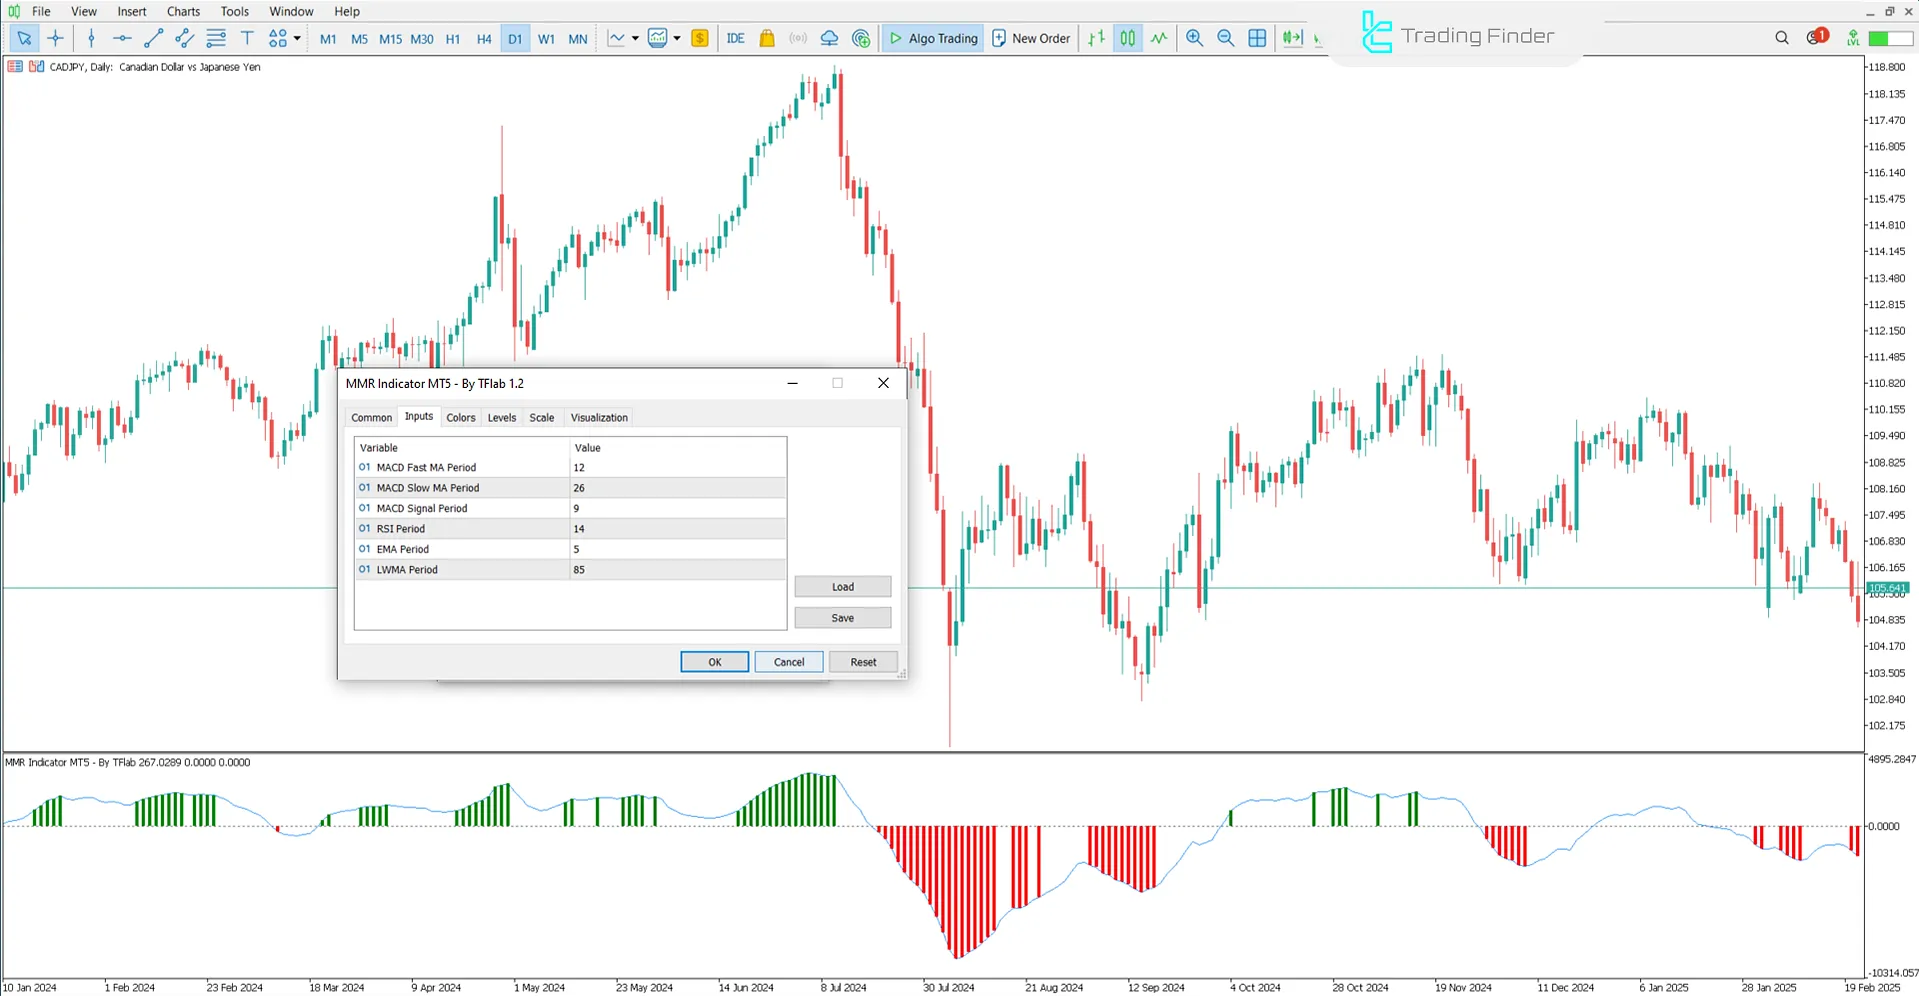
The following image shows the settings panel of the MMR oscillator in trading:

- MACD Fast MA Period: Fast Moving Average period in MACD;
- MACD Slow MA Period: Slow Moving Average period in MACD;
- MACD Signal Period: Signal line calculation period in MACD;
- RSI Period: Standard RSI period;
- EMA Period: Exponential Moving Average period;
- LWMA Period: Linear Weighted Moving Average period.
Conclusion
The MMR Combined Indicator, by integrating four technical analysis, serves as an effective tool for trend analysis and momentum evaluation.
With its colored histogram bars in green and red, the oscillator identifies price direction as well as potential trade entry and exit zones.
MMR A Combination of 4 Indicators MACD MT5 PDF
MMR A Combination of 4 Indicators MACD MT5 PDF
Click to download MMR A Combination of 4 Indicators MACD MT5 PDFCan the MMR Indicator settings be customized?
Yes, the internal parameters of all four integrated indicators are adjustable.
Why are both EMA and LWMA used simultaneously in the MMR Indicator?
Because EMA reacts more quickly to price changes, LWMA, with its different weighting, provides a smoother analysis of market fluctuations.


