![Tick Volume Oscillator for MetaTrader 5 Download – Free – [TFlab]](https://cdn.tradingfinder.com/image/334200/4-59-en-tick-volume-oscillator-mt5-1.webp)
![Tick Volume Oscillator for MetaTrader 5 Download – Free – [TFlab] 0](https://cdn.tradingfinder.com/image/334200/4-59-en-tick-volume-oscillator-mt5-1.webp)
![Tick Volume Oscillator for MetaTrader 5 Download – Free – [TFlab] 1](https://cdn.tradingfinder.com/image/334188/4-59-en-tick-volume-oscillator-mt5-2.webp)
![Tick Volume Oscillator for MetaTrader 5 Download – Free – [TFlab] 2](https://cdn.tradingfinder.com/image/334201/4-59-en-tick-volume-oscillator-mt5-3.webp)
![Tick Volume Oscillator for MetaTrader 5 Download – Free – [TFlab] 3](https://cdn.tradingfinder.com/image/334199/4-59-en-tick-volume-oscillator-mt5-4.webp)
The Tick Volume Oscillator (Tick Volume Oscillator) utilizes the Exponential Moving Average (EMA) to simulate volume fluctuations.
This MetaTrader 5 indicator turns green when the Exponential Moving Average (EMA) line moves above the zero level, signaling the beginning of an uptrend. Conversely, when the line moves below zero, it turns red, indicating a downtrend.
Tick Volume Oscillator Specifications
This indicator is useful in technical analysis, and its features are summarized in the table below:
Indicator Categories: | Oscillators MT5 Indicators Volatility MT5 Indicators Trading Assist MT5 Indicators |
Platforms: | MetaTrader 5 Indicators |
Trading Skills: | Intermediate |
Indicator Types: | Leading MT5 Indicators |
Timeframe: | Multi-Timeframe MT5 Indicators |
Trading Style: | Intraday MT5 Indicators |
Trading Instruments: | Forex MT5 Indicators Crypto MT5 Indicators Stock MT5 Indicators Forward MT5 Indicators Share Stock MT5 Indicators |
Indicator Overview
The Tick Volume Oscillator (Tick Volume Oscillator) is one of the most effective tools among MetaTrader 5 oscillators.
This indicator displays volume fluctuations using different averaging methods such as SMA, EMA, and SMMA.
Traders can customize the indicator settings based on their strategy, adjusting the moving average type and selecting histogram mode for better visualization.
Indicator in a Bullish Trend
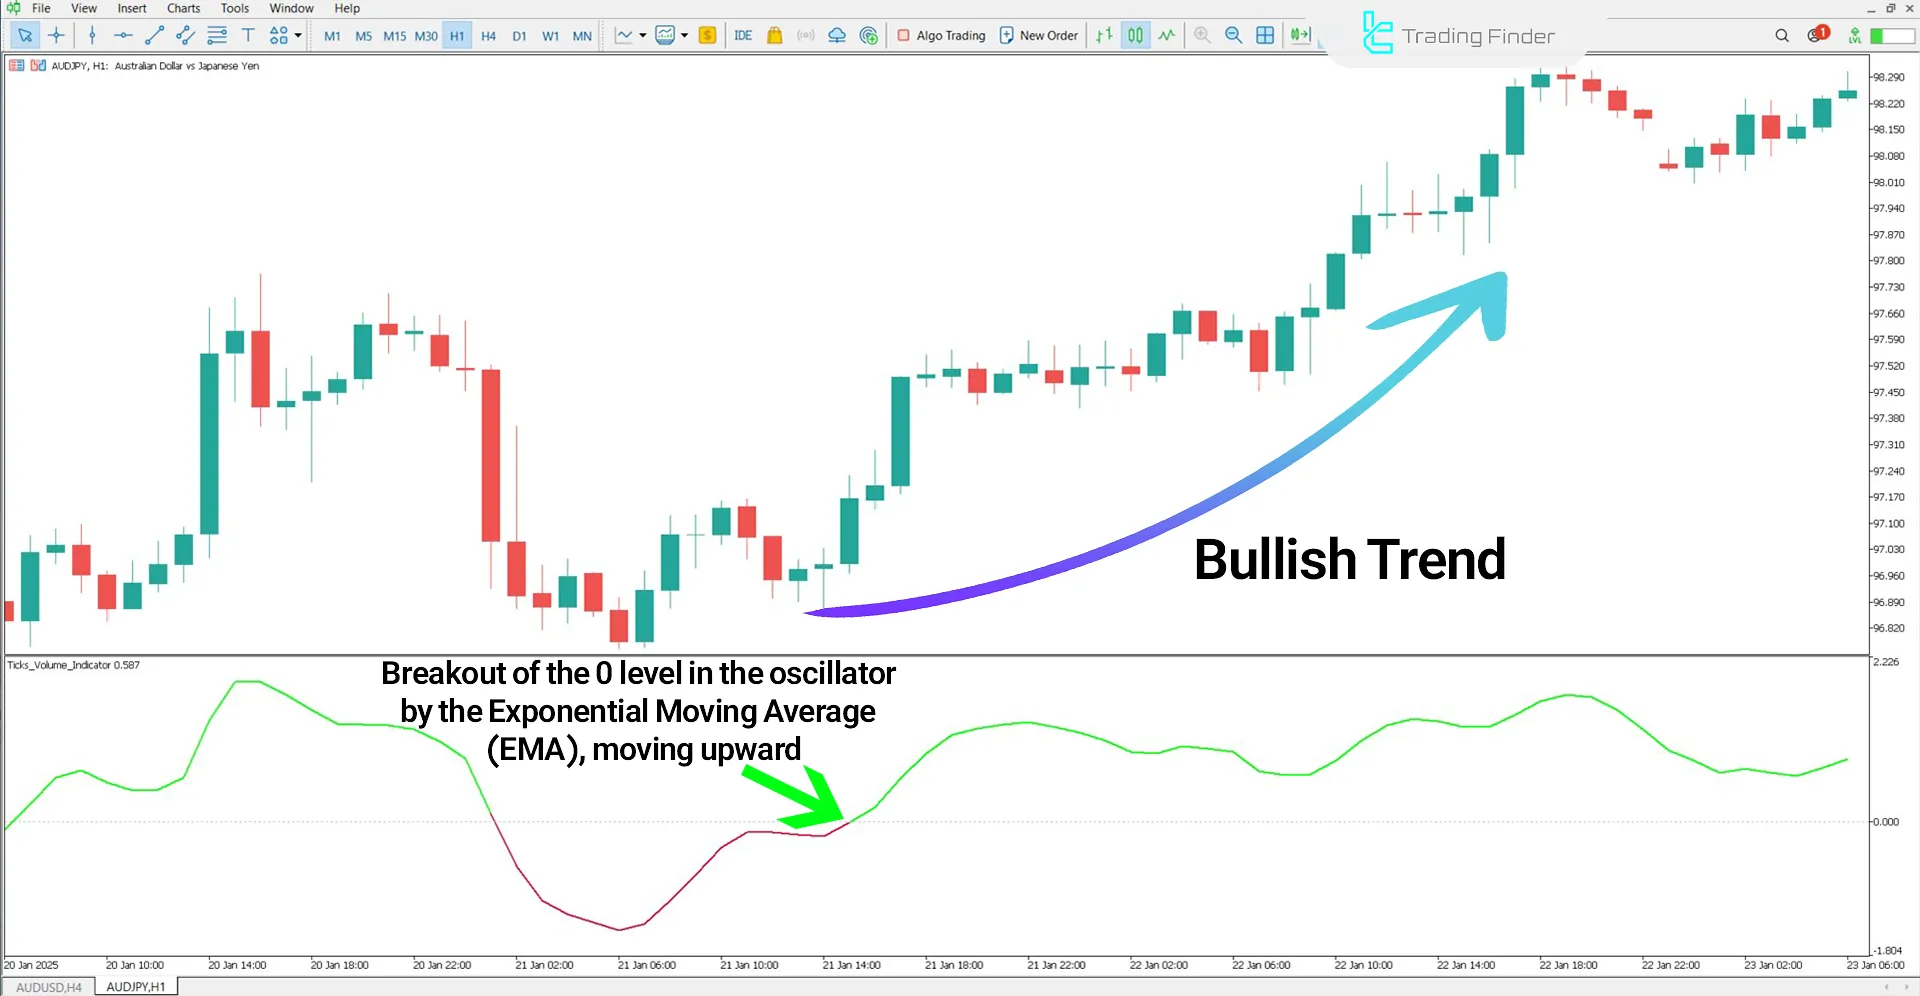
In an uptrend, after breaking the zero level, the moving average line of the oscillator turns green, marking the beginning of a bullish trend.
Traders entering the market in these areas can exit their positions if the Exponential Moving Average (EMA) approaches the zero level again.

Indicator in a Bearish Trend
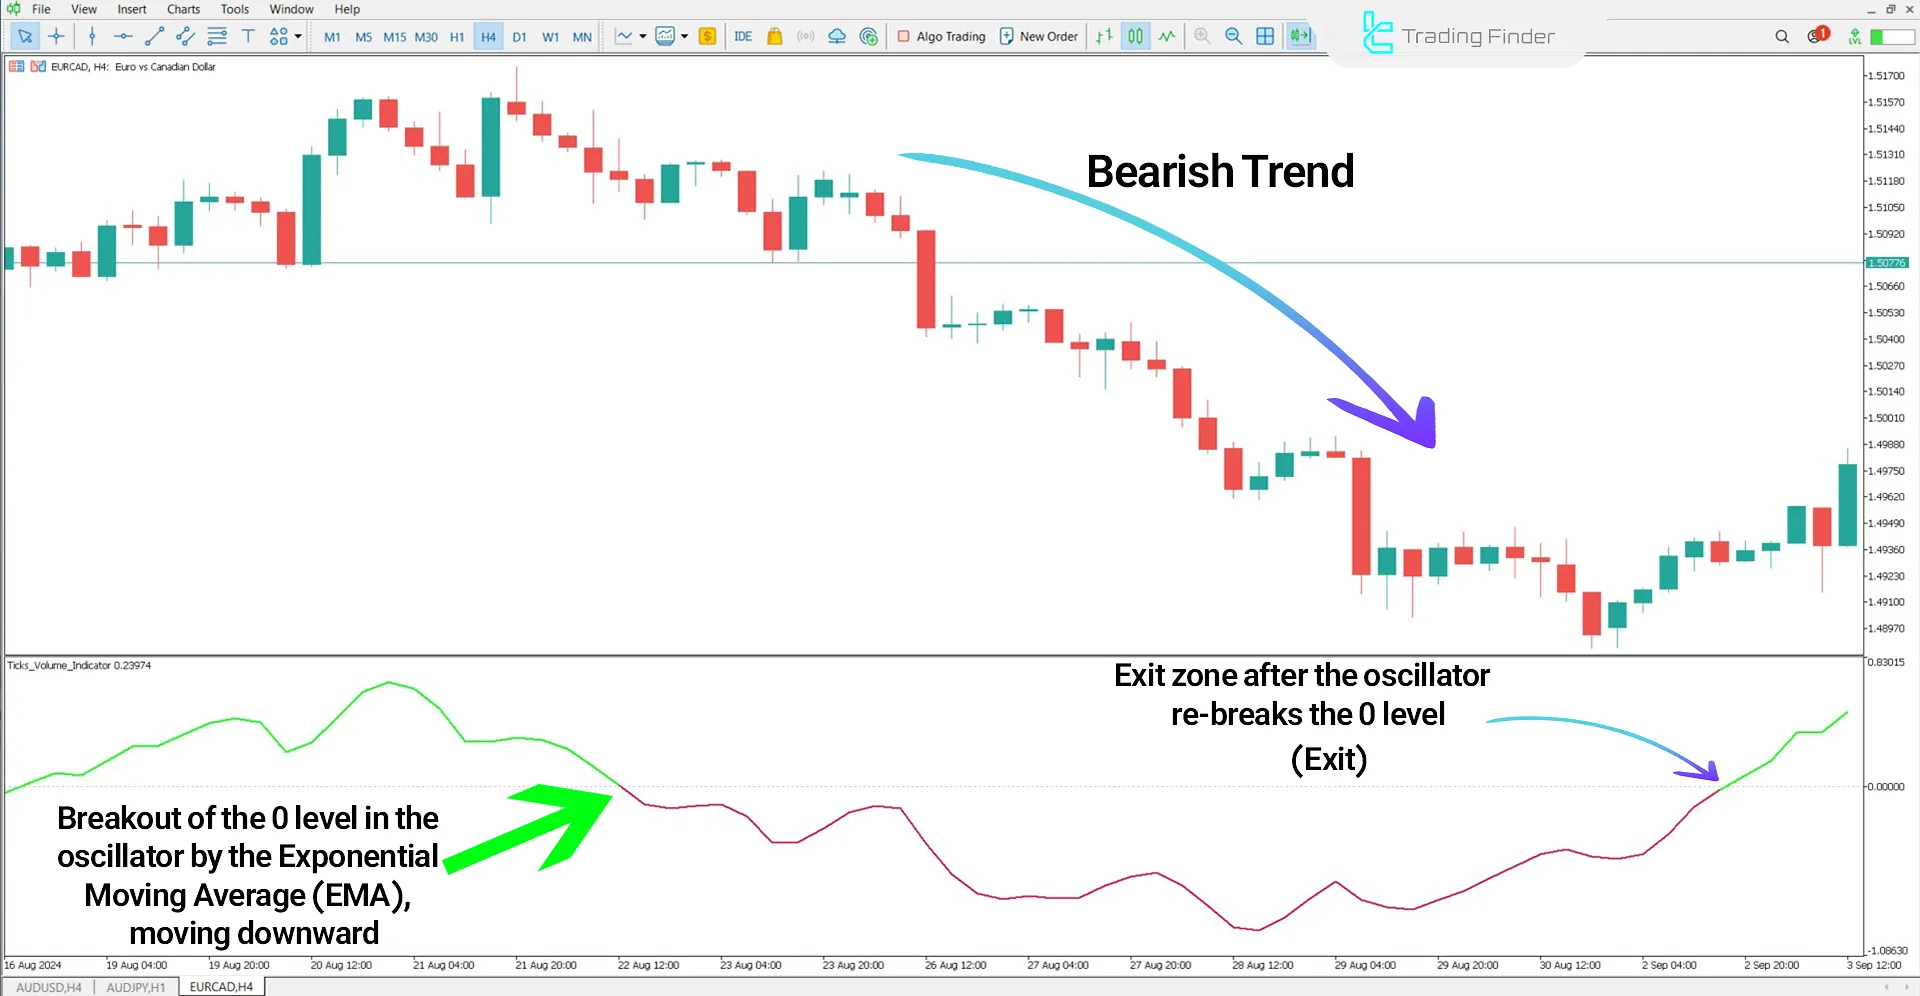
In the EUR/CAD price chart, when the moving average line turns red, the price enters a bearish phase, and this area is considered a sell signal.
Traders can exit their trades and secure profits once they observe the indicator line reversing and changing color.

Tick Volume Oscillator Settings
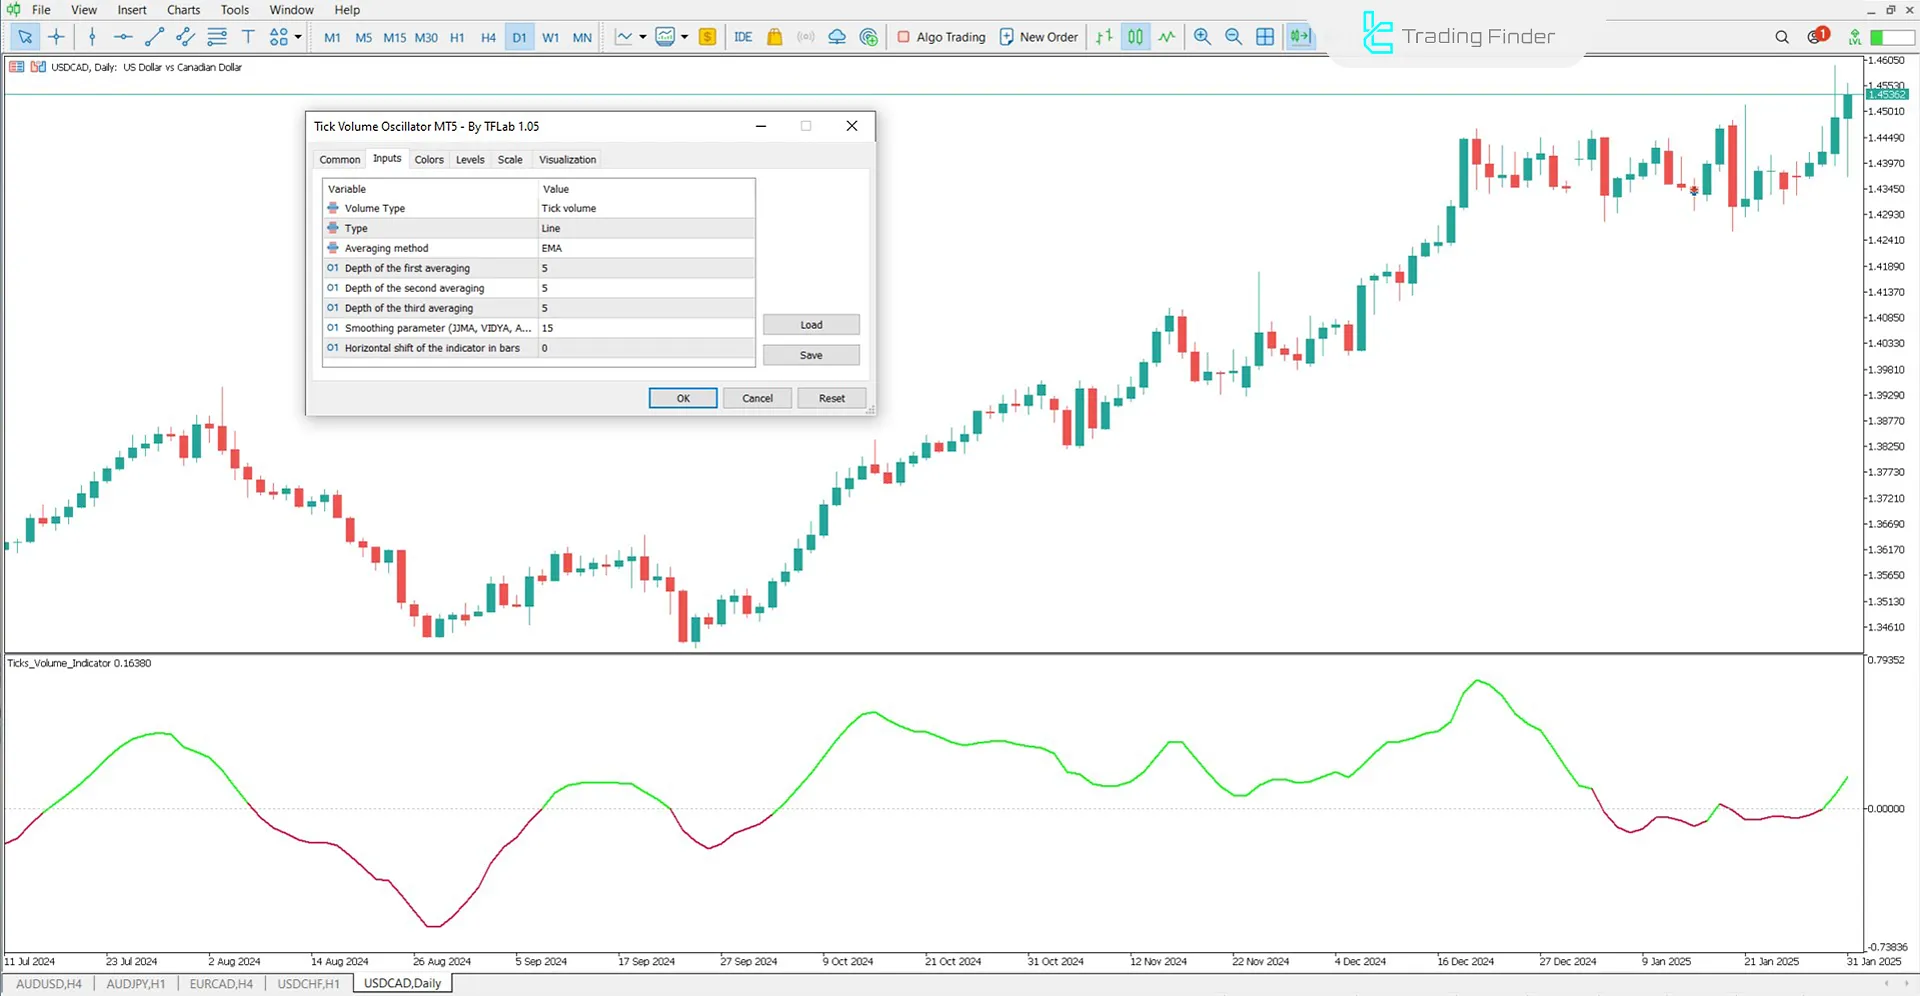
The image below displays the detailed settings panel for the Tick Volume Oscillator in MetaTrader 5:

- Volume: Trading volume over a specified period
- Type: Data type
- Averaging method: Moving average calculation method
- Depth of the first averaging: Depth of the first averaging stage
- Depth of the second averaging: Depth of the second averaging stage
- Depth of the third averaging: Depth of the third averaging stage
- Smoothing parameter: Smoothing parameter
- Horizontal shift of the indicator in bars: Horizontal shift of the indicator on the chart
Conclusion
The Tick Volume Oscillator utilizes the Exponential Moving Average (EMA) to display dynamic volume fluctuations.
It analyzes volume changes per candlestick or price bar and smooths volatility using the EMA, making volume trends clearer and easier to interpret.
This method of analysis can be applied across various markets such as Forex, cryptocurrencies, stock trading, and commodities.
Tick Volume Oscillator MT5 PDF
Tick Volume Oscillator MT5 PDF
Click to download Tick Volume Oscillator MT5 PDFWhich markets is the Tick Volume Oscillator suitable for?
This indicator is applicable in Forex, cryptocurrency, and stock markets and works across all timeframes.
When should the Tick Volume Oscillator be used to exit a buy trade?
When the moving average line approaches the zero level, it is considered the optimal time to exit the trade.


