


TradingView
MetaTrader4
MetaTrader5
![Trend Slope Delta Movement TFLAB Indicator in NinjaTrader 8 - [TradingFinder]](https://cdn.tradingfinder.com/image/724505/183-en-trend-slope-delta-movement-1.webp)
![Trend Slope Delta Movement TFLAB Indicator in NinjaTrader 8 - [TradingFinder] 1](https://cdn.tradingfinder.com/image/724535/183-en-trend-slope-delta-movement-2.webp)
![Trend Slope Delta Movement TFLAB Indicator in NinjaTrader 8 - [TradingFinder] 2](https://cdn.tradingfinder.com/image/724525/183-en-trend-slope-delta-movement-3.webp)
![Trend Slope Delta Movement TFLAB Indicator in NinjaTrader 8 - [TradingFinder] 3](https://cdn.tradingfinder.com/image/724515/183-en-trend-slope-delta-movement-4.webp)
The Slope and Trend Indicator for NinjaTrader 8 Using Delta (Trend Slope Delta Movement), as one of the advanced order flow analysis tools on the NinjaTrader platform, evaluates the structural movement of price based on the interaction between trading volume, trend slope, and volume delta changes.
This indicator combines volume profile, volume delta, price movement path, and volume-weighted average to present a multi-layered view of the behavior of major market participants and displays price movement across short-term and mid-term timeframes.
Trend Slope Delta Movement Indicator Table
The general specifications of the Trend Slope Delta Movement indicator are presented in the table below:
Category | Signal and Forecast - Trading Tool - Volume Trading |
Platform | NinjaTrader |
Skill Level | Advanced |
Indicator Type | Continuation - Reversal |
Timeframe | Multi Timeframe |
Trading Style | Intraday Trading |
Trading Market | All Markets |
Trend Slope Delta Movement Indicator at a Glance
The Trend Slope Delta Movement indicator processes trading data in several independent modules and then displays the final output as an integrated structure on the chart.
- First Layer, Volume Distribution Analysis: In this section, the indicator identifies the Value Area through the volume profile, determines liquidity concentration, and extracts the Point of Control (POC);
Note: This layer specifies at which levels market volume has stabilized and at what stage liquidity is transferring to higher or lower levels.
- Second Layer, Volume Delta Analysis: In this module, the difference between aggressive buy and sell orders is calculated;
Note: In addition to the raw delta value, the indicator also examines its behavior during corrections, delta divergences, and changes in volume momentum.
- Third Layer: In this layer, the analysis of price movement angle, structuring of movement legs, evaluation of key market points, assessment of trend stability, and detection of movement weakness are conducted.
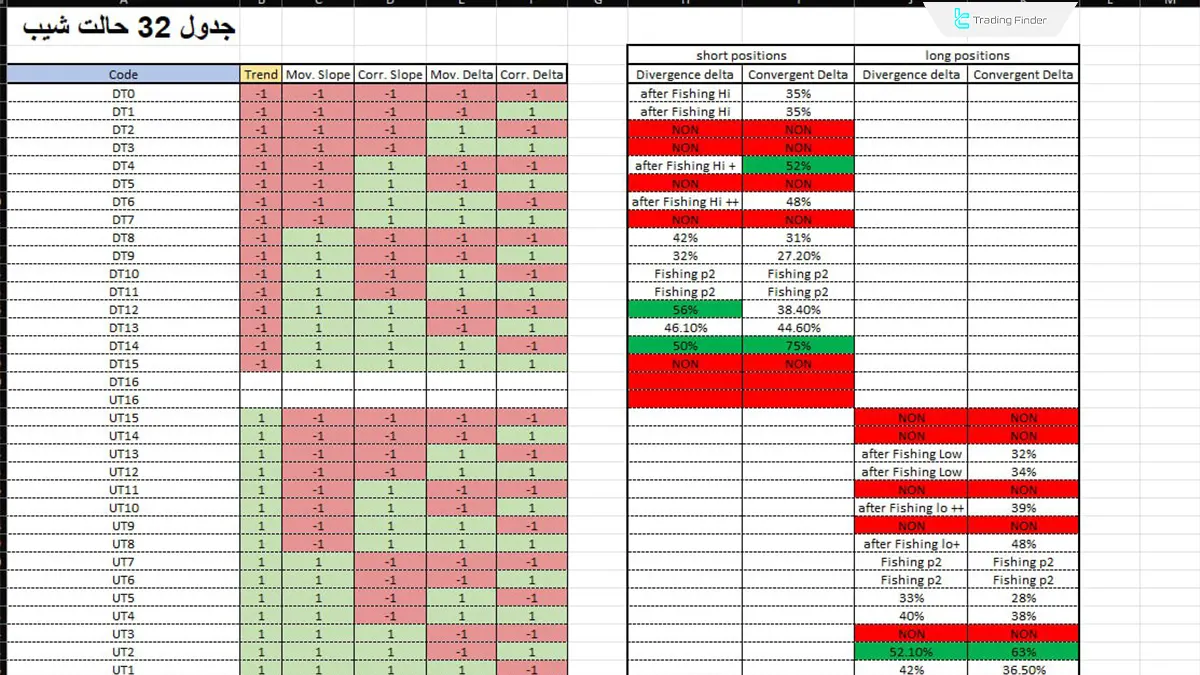
Review of the 32-State Table of the NinjaTrader 8 Slope and Trend Indicator Using Delta
The table below represents the result of the structural combination of five key variables and the statistical analysis of past market data:
Bearish Trend States
Code | Trend | Mov.Slope | Corr.Slope | Mov.Delta | Corr.Delta | Interpretation |
DT0 | -1 | -1 | -1 | -1 | -1 | Full alignment of trend, slope, and delta to the downside |
DT1 | -1 | -1 | -1 | -1 | +1 | Downward movement with supportive corrective delta; continuation likely after a pullback |
DT2 | -1 | -1 | -1 | +1 | -1 | Divergence within the move; buying pressure emerging in a bearish path; potential weakening of sellers |
DT3 | -1 | -1 | -1 | +1 | +1 | Delta fully opposed to trend; warning of phase shift or deep correction |
DT4 | -1 | -1 | +1 | -1 | -1 | Correction with positive slope but negative delta; weak corrective structure |
DT5 | -1 | -1 | +1 | -1 | +1 | Positive corrective slope with buy absorption; potential continuation of the downtrend |
DT6 | -1 | -1 | +1 | +1 | -1 | Combined divergence; unstable structural conditions |
DT7 | -1 | -1 | +1 | +1 | +1 | Strong correction with positive delta; increased probability of deeper retracement |
DT8 | -1 | +1 | -1 | -1 | -1 | Positive movement slope within a bearish trend; early sign of structural weakening |
DT9 | -1 | +1 | -1 | -1 | +1 | Imbalanced structure; volume-based neutralizing correction |
DT10 | -1 | +1 | -1 | +1 | -1 | Contradictory movement; buying pressure against the prevailing downtrend |
DT11 | -1 | +1 | -1 | +1 | +1 | Full divergence; elevated probability of trend breakdown |
DT12 | -1 | +1 | +1 | -1 | -1 | Positive corrective and movement slope; bearish trend under pressure |
DT13 | -1 | +1 | +1 | -1 | +1 | Weak bearish structure; requires additional confirmation |
DT14 | -1 | +1 | +1 | +1 | -1 | Delta opposed to correction; market in an indecisive phase |
Bullish Trend States
Code | Trend | Mov.Slope | Corr.Slope | Mov.Delta | Corr.Delta | Interpretation |
UT0 | +1 | +1 | +1 | +1 | +1 | Full convergence; strongest continuation scenario for bullish trend |
UT1 | +1 | +1 | +1 | +1 | -1 | Correction with negative delta; controlled pullback likely |
UT2 | +1 | +1 | +1 | -1 | +1 | Divergence within the move; temporary weakening of buyers |
UT3 | +1 | +1 | +1 | -1 | -1 | Fully negative delta; warning of bullish trend deterioration |
UT4 | +1 | +1 | -1 | +1 | +1 | Healthy correction with negative slope; bullish continuation probable |
UT5 | +1 | +1 | -1 | +1 | -1 | Negative corrective delta; sell absorption during pullback |
UT6 | +1 | +1 | -1 | -1 | +1 | Combined divergence; uncertain structural conditions |
UT7 | +1 | +1 | -1 | -1 | -1 | Destructive correction; possible structural transition |
UT8 | +1 | -1 | +1 | +1 | +1 | Negative movement slope within an uptrend; early weakness signal |
UT9 | +1 | -1 | +1 | +1 | -1 | Market entering a deeper corrective phase |
UT10 | +1 | -1 | +1 | -1 | +1 | Delta opposing price movement; active divergence |
UT11 | +1 | -1 | +1 | -1 | -1 | Significant structural weakness in the uptrend |
UT12 | +1 | -1 | -1 | +1 | +1 | Structure transitioning toward a phase shift |
UT13 | +1 | -1 | -1 | +1 | -1 | Multi-layer divergence; caution required |
UT14 | +1 | -1 | -1 | -1 | +1 | Selling pressure within bullish structure; potential breakdown risk |
UT15 | +1 | -1 | -1 | -1 | -1 | Full bearish convergence inside an uptrend; strong warning signal |
The 32 Slope-State Table (DT & UT) serves as the interpretative key to the visual performance matrix shown in the image. The percentages, color coding, and “NON” labels displayed on the right side of the image represent the empirical outcomes of the structural conditions classified in this table.
Each code (DT0 or UT7) defines a specific market condition derived from the interaction between trend direction, movement slope, corrective slope, and movement/correction deltas. Through this framework, the internal market structure is systematically categorized into 32 distinct and identifiable scenarios.
Bullish Scenario
The bullish scenario in the NinjaTrader 8 Slope and Trend Indicator Using Delta gains operational validity when price stabilizes above the trading value area and a new volume profile forms at higher levels. This volume shift indicates liquidity concentration toward higher prices and an active institutional accumulation phase.
This structural behavior shows that the market has entered an accelerated phase and that the bullish movement is not merely a temporary fluctuation.
In the next stage, the Volume Delta during short-term corrections must remain within the positive or controlled neutral range. This condition confirms the absorption of sell orders and the continuation of demand pressure, preventing structural breakdown.
Finally, price must register consecutive higher lows, and each new correction must halt at a level higher than the previous low; consequently, this pattern indicates sustained buyer control and continuation of the bullish trend.
When stabilization above the value area, persistent positive slope, supportive delta, and the structure of higher lows activate simultaneously, the Trend Slope Delta Movement indicator confirms a valid bullish scenario.
Bearish Scenario
The bearish scenario in the Trend Slope Delta Movement indicator forms when price gradually stabilizes below trading value areas and trading volume concentration shifts to lower ranges.
This shift indicates that the market has entered a liquidity distribution phase and that the previous bullish structure has lost its effectiveness.
Subsequently, the price movement path develops a downward deviation, and trend slope analysis records a continuous negative angle; moreover, consecutive candle closes below this path confirm seller dominance in the short-term and mid-term structure.
Simultaneously, the Volume Delta during limited market pullbacks loses the ability to enter the positive range and consistently remains in the negative zone. This behavior demonstrates weak demand, rapid absorption of buy orders, and prevents the formation of a sustainable reversal.
Ultimately, by registering consecutive lower lows and halting corrections at lower levels, the market confirms the "Lower Low" pattern.
When volume shifts to lower levels, persistent negative slope, weakened delta, and the structure of lower lows activate simultaneously, the Trend Slope Delta Movement indicator displays a sell entry signal.
Trend Slope Delta Movement Indicator Settings
The image below displays the settings panel of the Trend Slope Delta Movement on the NinjaTrader platform:
- Anchor Setting: Configuration of reference points for drawing volume and trend structure;
- Anchor Area Drawing: Control of displaying reference areas for volume and price analysis;
- Anchor Line Drawing: Activation of structural lines connecting key points;
- Anchor Report: Display of analytical report for market reference points;
- VP Setting: Volume Profile settings;
- VP Bar: Number of candles used in volume profile calculations;
- VP Width: Adjustment of the graphical width of the volume profile area;
- VP Area Drawing: Control of drawing the value area and volume ranges;
- VP Mode: Selection of the Volume Profile calculation mode (Volume Profile Mode);
- VP Color Mode: Configuration of the volume color model;
- High Value Color: Color of high transaction density areas;
- High Value Opacity: Adjustment of transparency for high-volume areas;
- Low Value Color: Color of low transaction density areas;
- Low Value Opacity: Adjustment of transparency for low-volume areas;
- Positive Delta Color: Display color of positive delta (buying pressure);
- Positive Delta Opacity: Adjustment of positive delta transparency;
- Negative Delta Color: Display color of negative delta (selling pressure);
- Negative Delta Opacity: Adjustment of negative delta transparency;
- Zero Delta Color: Color of order balance status;
- Zero Delta Opacity: Adjustment of neutral delta transparency;
- ATS Color: Color of the structural analysis system;
- ATS Opacity: Adjustment of transparency for the adaptive trend analysis system;
- VP Line Drawing: Activation of volume profile reference lines;
- Text Drawing: Control of displaying textual data on the chart;
- Menu: Indicator function menu settings;
- Data Series: Selection of price and volume data source;
- Setup: Structural configuration of indicator performance;
- Visual: Visual and graphical display settings.
Conclusion
The Trend Slope Delta Movement TFLAB Indicator NinjaTrader 8 provides an order flow-based analytical framework that evaluates price behavior in direct relation to volume and delta.
By integrating Volume Profile, Volume Delta, Price Path, and Trend Slope Analysis, this indicator reveals the true market structure without lag.
Furthermore, the primary focus of this tool is on identifying liquidity shifts, transitions between accumulation and distribution phases, and real-time detection of buyer or seller dominance.
As a result, the convergence of volume, delta, and trend structure data enables the differentiation of valid movements from low-quality fluctuations.
Trend Slope Delta Movement TFLAB Indicator in NinjaTrader 8 PDF
Trend Slope Delta Movement TFLAB Indicator in NinjaTrader 8 PDF
Click to download Trend Slope Delta Movement TFLAB Indicator in NinjaTrader 8 PDFOn what basis is the NinjaTrader 8 Slope and Trend Indicator Using Delta designed?
This indicator is designed based on order flow analysis, volume delta, volume profile, and trend slope, and it evaluates price behavior in direct relation to liquidity.
What is the application of trend slope analysis in the NinjaTrader 8 Slope and Trend Indicator Using Delta?
In this indicator, trend slope analysis calculates the angle of price movement and assesses the stability or weakness of the market’s movement structure.


