The 5-0 Harmonic Pattern indicator is a classic chart pattern indicator used to identify potential trend reversals. This pattern, thanks to its unique combination of Fibonacci ratios and price behaviors, provides a deep understanding of market structure.
In the TradingView platform, this harmonic pattern comprises five key points (A-B-C-D-X), with specific Fibonacci ratios connecting them.

Traders consider the 5-0 pattern a reversal pattern, as it often forms at the end of a strong trend.
Indicator Specifications
Indicator Categories: | Harmonic Tradingview Indicators Candle Sticks Tradingview Indicators Chart & Classic Tradingview indicators |
Platforms: | Trading View Indicators |
Trading Skills: | Intermediate |
Indicator Types: | Reversal Tradingview Indicators |
Timeframe: | Multi-Timeframe Tradingview Indicators |
Trading Style: | Intraday Tradingview Indicators |
Trading Instruments: | TradingView Indicators in the Forex Market Cryptocurrency Tradingview Indicators Commodity Tradingview Indicators Forward Tradingview Indicators Share Stocks Tradingview Indicators |
Overview of the Harmonic Pattern Indicator
From point X to A, the initial price movement is identified. From point A to B, a significant price correction usually occurs.
Another corrective move happens between points B and C, and finally, from C to D, the last segment of the pattern forms. The 5-0 Indicator automatically plots these points on the chart.
Bullish 5-0 Harmonic Pattern
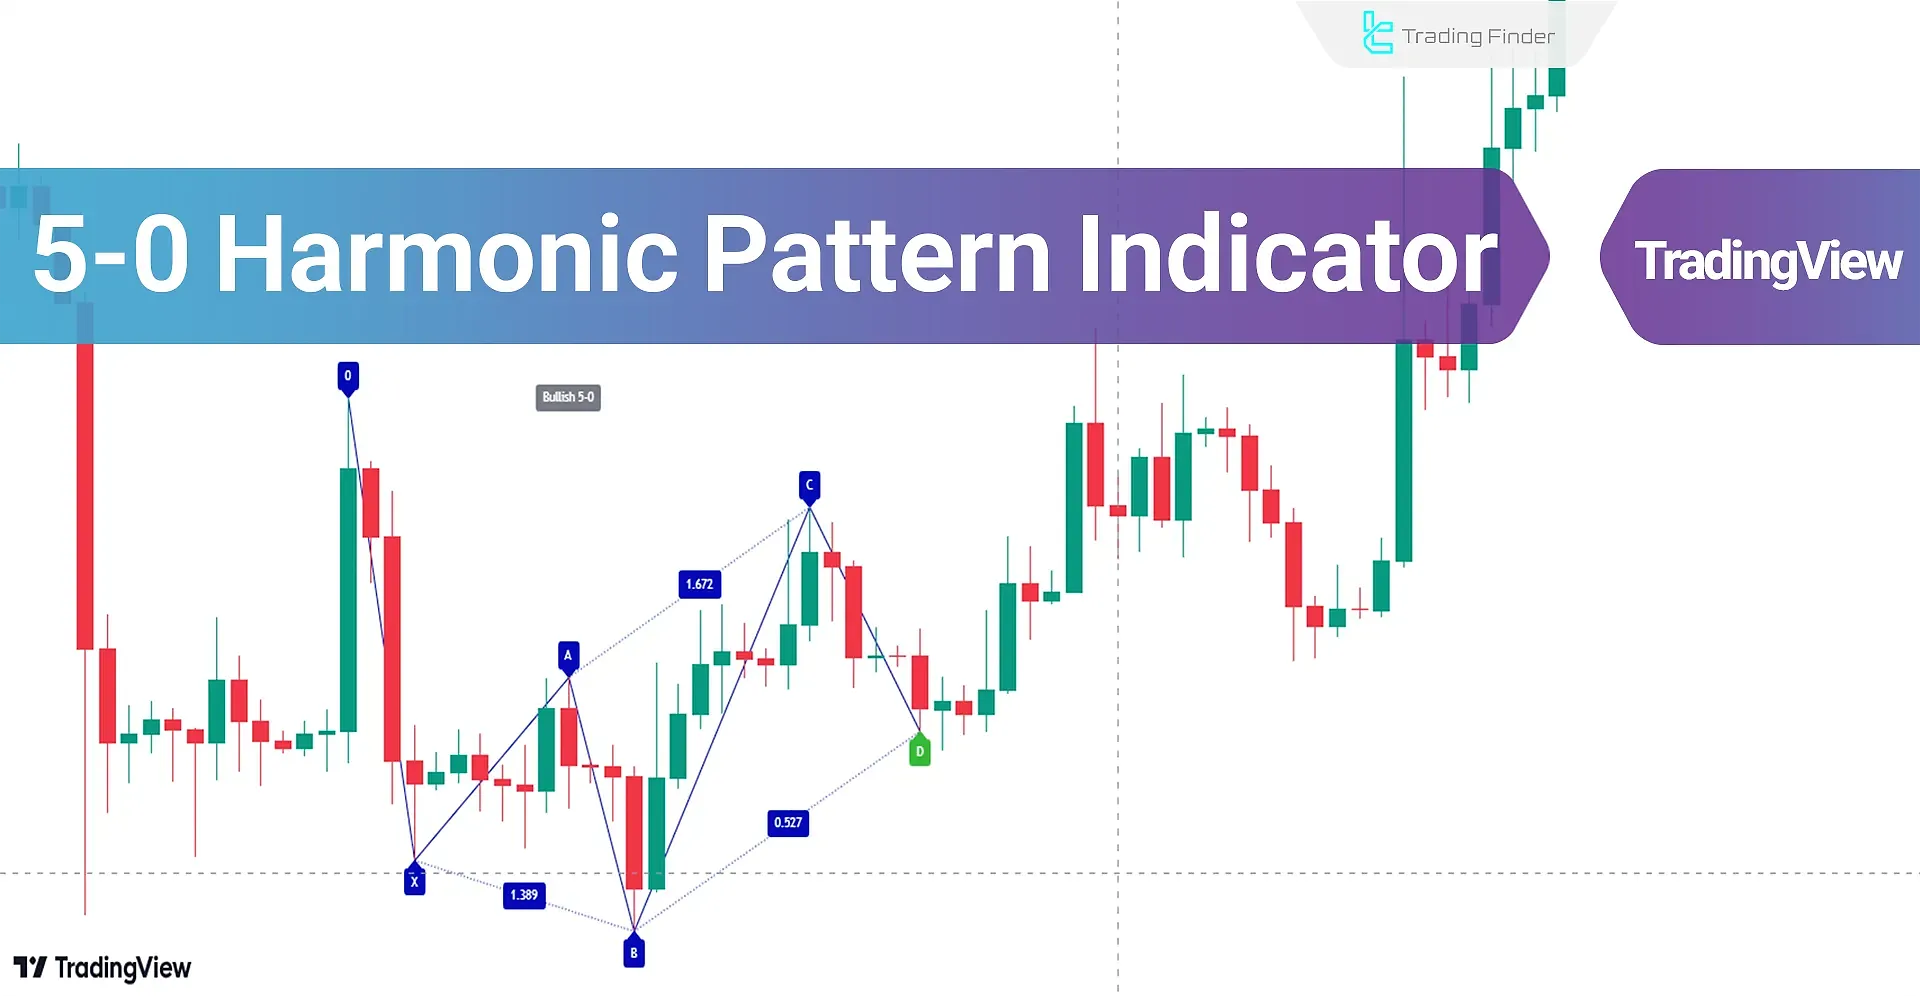
Based on the 15-minute price chart of Ethereum (ETH), the price initially moves from point X to A in an upward trend.
After this upward movement, a price correction occurs from point A to point B. The price then rises and reaches point C, where a new high is formed that is higher than point A.
Once the price reaches point D, the harmonic pattern is complete, and the indicator uses a green arrow to indicate a buy entry.

Bearish 5-0 Harmonic Pattern
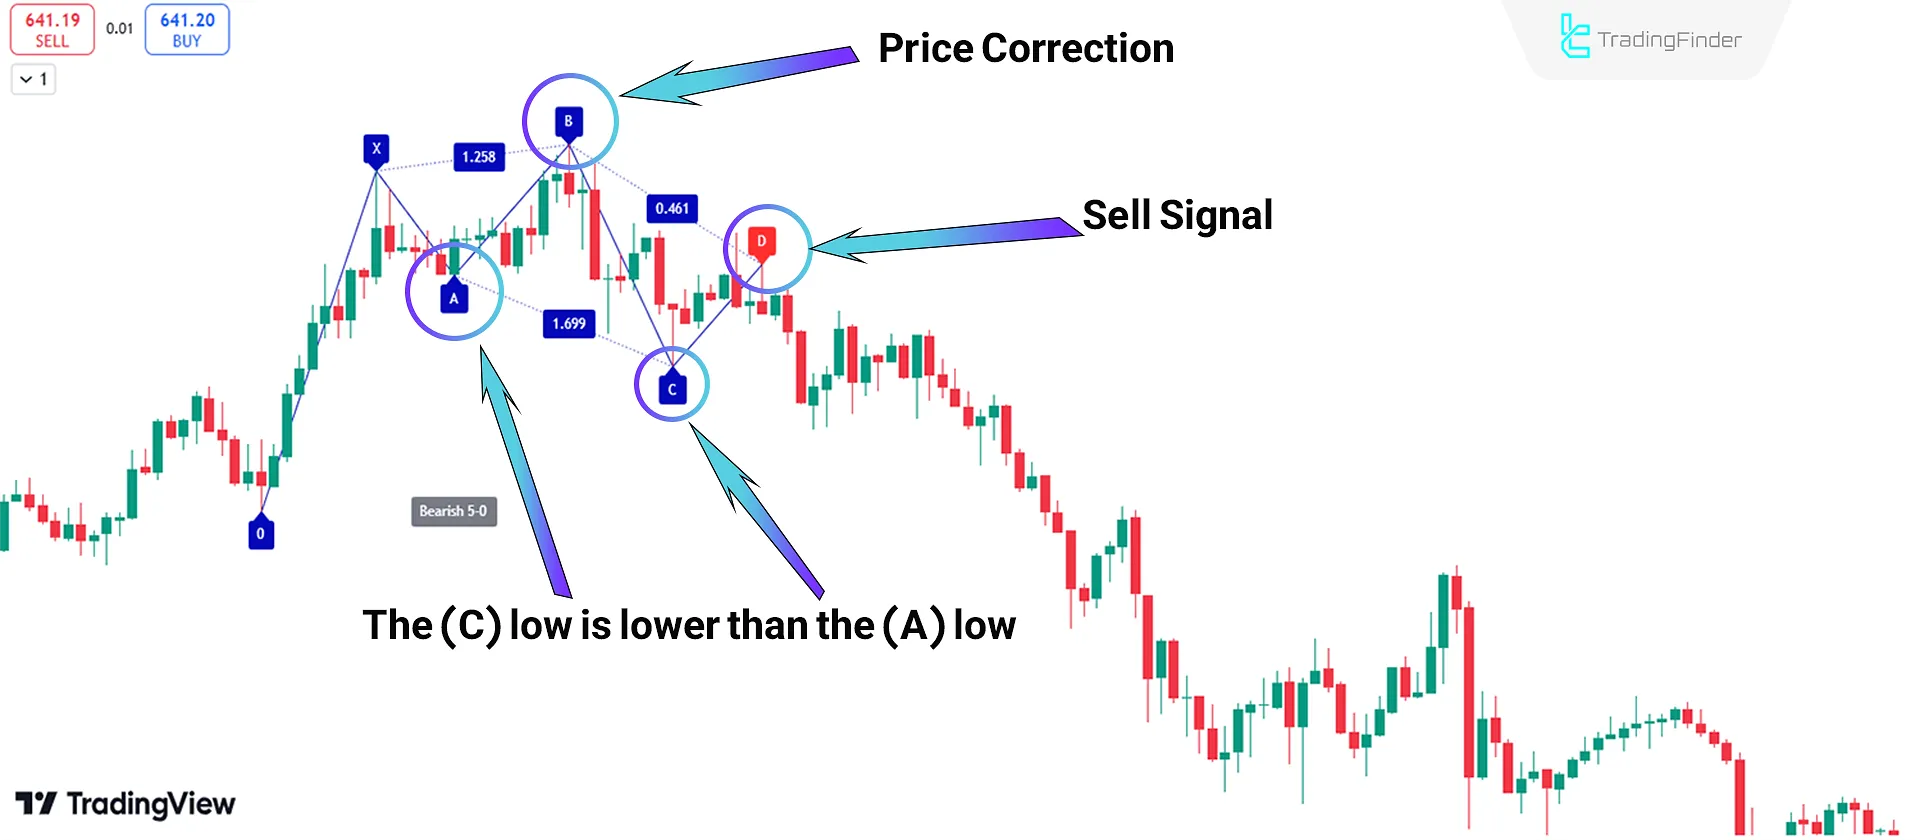
According to the 1-hour price chart of Binance Coin (BNB), the price initially moves from point X to A in a downward trend.
After this downward movement, an upward price correction occurs from point A to point B. The price then decreases and reaches point C, where a new low is formed that is lower than point A.
Once the price reaches point D, the pattern is complete, and the indicator uses a red arrow to indicate a sell entry.

Indicator Settings

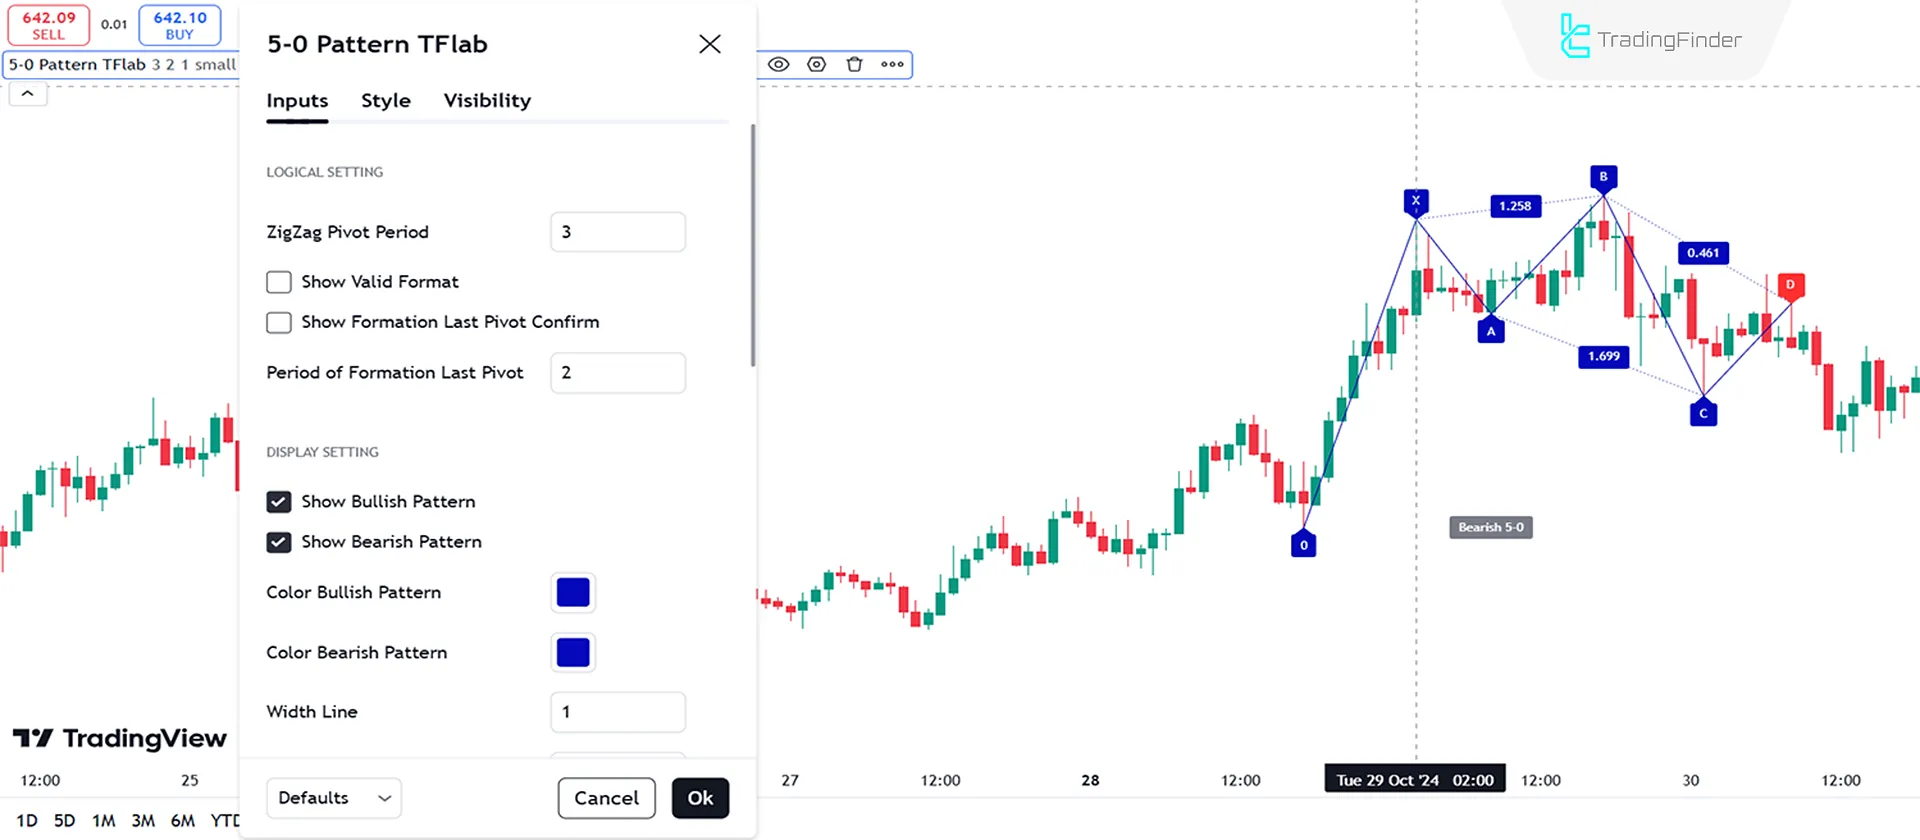
- ZigZag Pivot Period: Calculates the zigzag line, set to 3;
- Show Valid Format: Displays patterns based on specific conditions;
- Show Formation Last Pivot Confirm: Confirms the final pivot of the pattern;
- Period of Formation Last Pivot: The period for confirming the last pivot is 1;
- Show Bullish Pattern: Displays bullish patterns;
- Show Bearish Pattern: Displays bearish patterns;
- Color Bullish Pattern: Sets the color for bullish patterns;
- Color Bearish Pattern: Sets the color for bearish patterns;
- Width Line: Line thickness for drawn patterns, set to 1;
- Label Size: Sets the size of labels;
- Switching Colors Theme Mode: Changes the indicator's theme;
- Alert: Sets up alerts;
- Alert Name: Defines the name for the alert.
Conclusion
The 5-0 Harmonic Pattern Indicator is a valuable tool for identifying reversal points. It can significantly improve trading accuracy when used alongside proper risk management and other tools.
This Harmonic indicator automatically plots the pattern on the chart and, under the right conditions, uses arrow markers to issue entry signals for trades.
5-0 Harmonic Pattern TradingView PDF
5-0 Harmonic Pattern TradingView PDF
Click to download 5-0 Harmonic Pattern TradingView PDFIs this indicator specific to any particular market?
No, this indicator is applicable across all markets, including Forex, Crypto, Stocks, and Commodities.
Does the 5-0 Harmonic Pattern Indicator generate trade entry signals?
Yes, after the pattern completes on the chart and the price reaches point D, the indicator issues trade entry signals.


