


TradingView
MetaTrader4
MetaTrader5
The Divergence Detector Indicator (MACD, RSI, or AO) is an advanced tool that combines three types of divergences MACD, RSI, and an AO Oscillator.
This indicator automatically identifies positive and negative divergences using lines displayed in a panel outside the price chart.
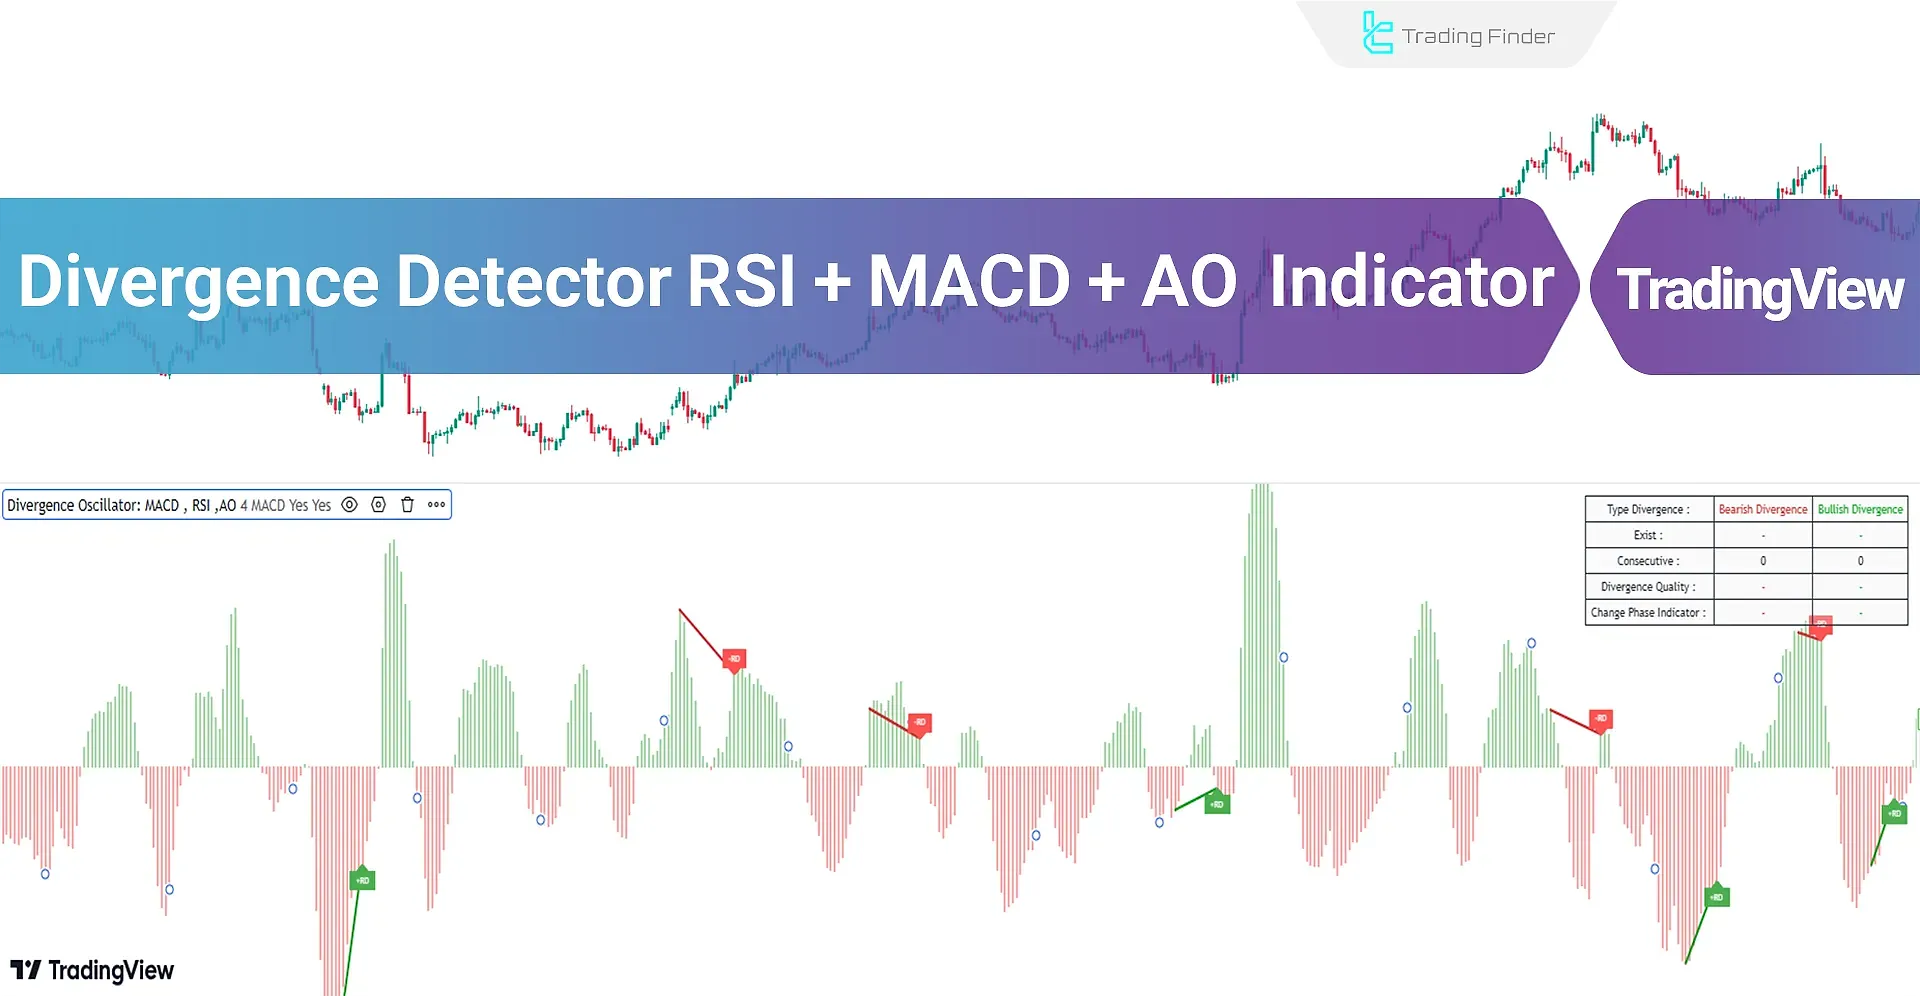
It plays a key role in identifying reversal points and price movement changes. Additionally, this trading tool it records information about divergences in a separate table.
Divergence Detector Indicator (MACD, RSI, or AO) Specifications Table
The specifications of the Divergence Detection Indicator (MACD, RSI, or AO) are as shown in the table below.
Indicator Categories: | Oscillators Tradingview Indicators Signal & Forecast Tradingview Indicators Trading Assist Tradingview Indicators MACD Indicators for TradingView RSI Indicators for TradingView |
Platforms: | Trading View Indicators |
Trading Skills: | Intermediate |
Indicator Types: | Reversal Tradingview Indicators |
Timeframe: | Multi-Timeframe Tradingview Indicators |
Trading Style: | Intraday Tradingview Indicators Swing Trading Tradingview Indicators |
Trading Instruments: | TradingView Indicators in the Forex Market Cryptocurrency Tradingview Indicators Stock Tradingview Indicators Binary Option Tradingview Indicators |
Indicator Overview
The Divergence Detector Indicator (MACD, RSI, or AO) displays real time divergence information in a separate table on the chart. The data provided in this table includes:
- Type Divergence: The type of divergence (Bullish) or (Bearish);
- Exist: Displays "+" if a divergence exists;
- Consecutive: Shows the number of consecutive divergences;
- Divergence Quality: The quality of divergence based on consecutive occurrences;
- Change Phase Indicator: Detects phase changes between two oscillating peaks.
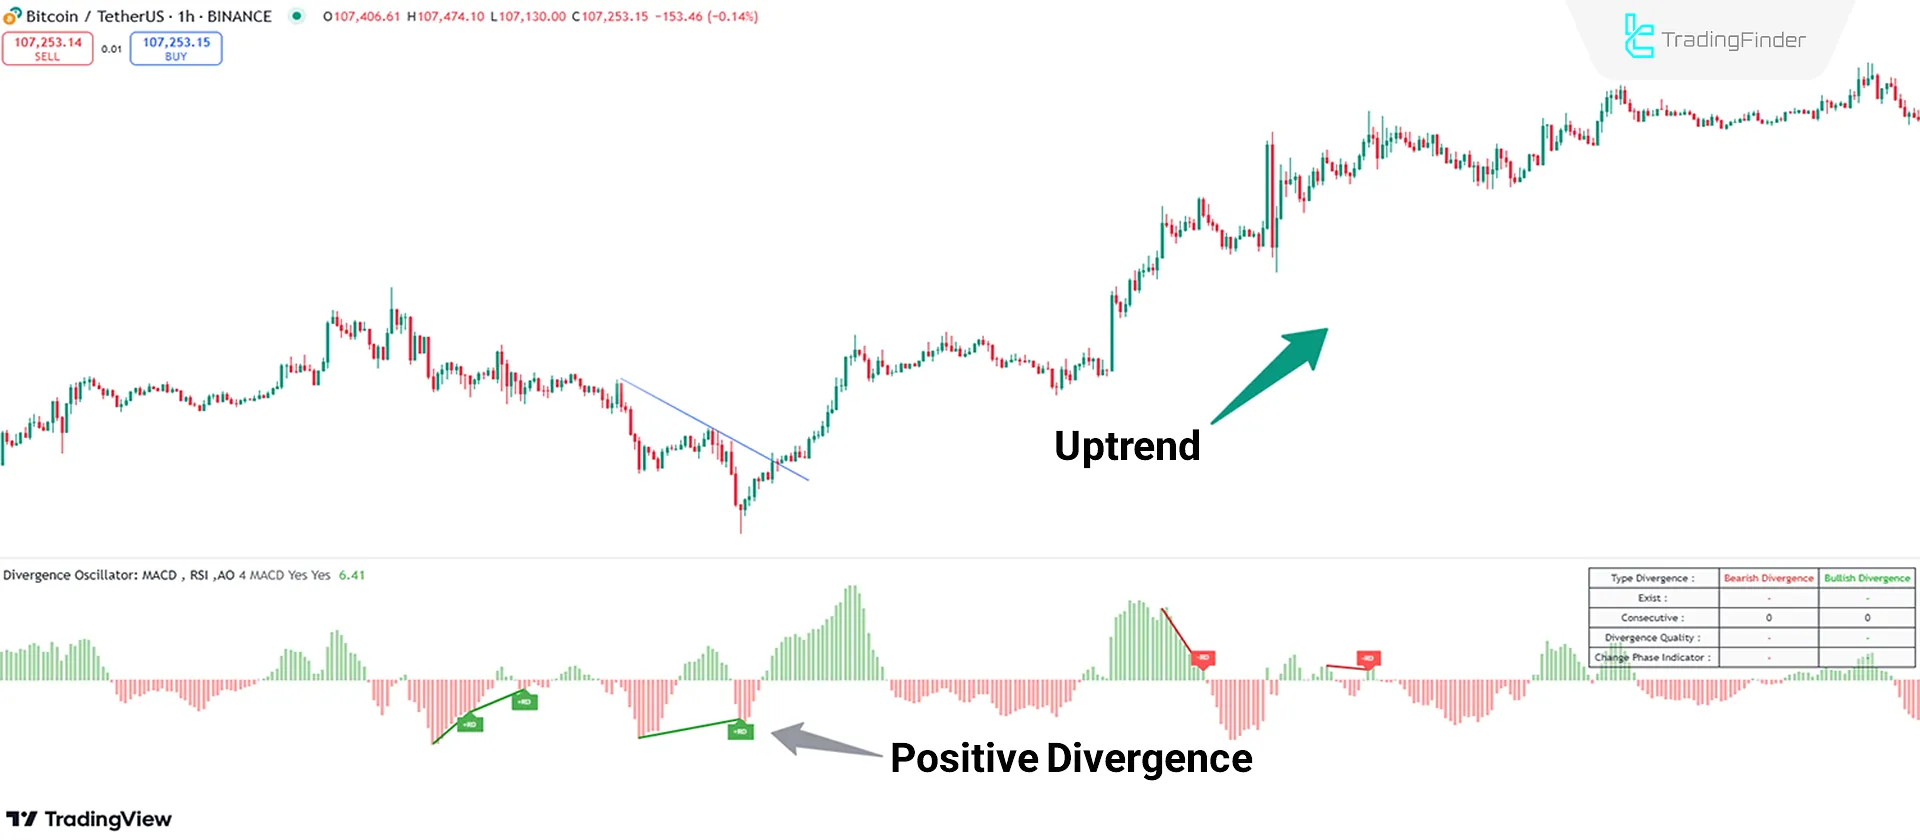
Indicator Performance in an Uptrend
Based on the Bitcoin (BTC) price chart in a 1-hour timeframe, the price formed lower highs (LH), while the oscillator (MACD Divergence) displayed higher lows (HL) as positive divergence.
Positive divergence can be a signal to enter buy trades.
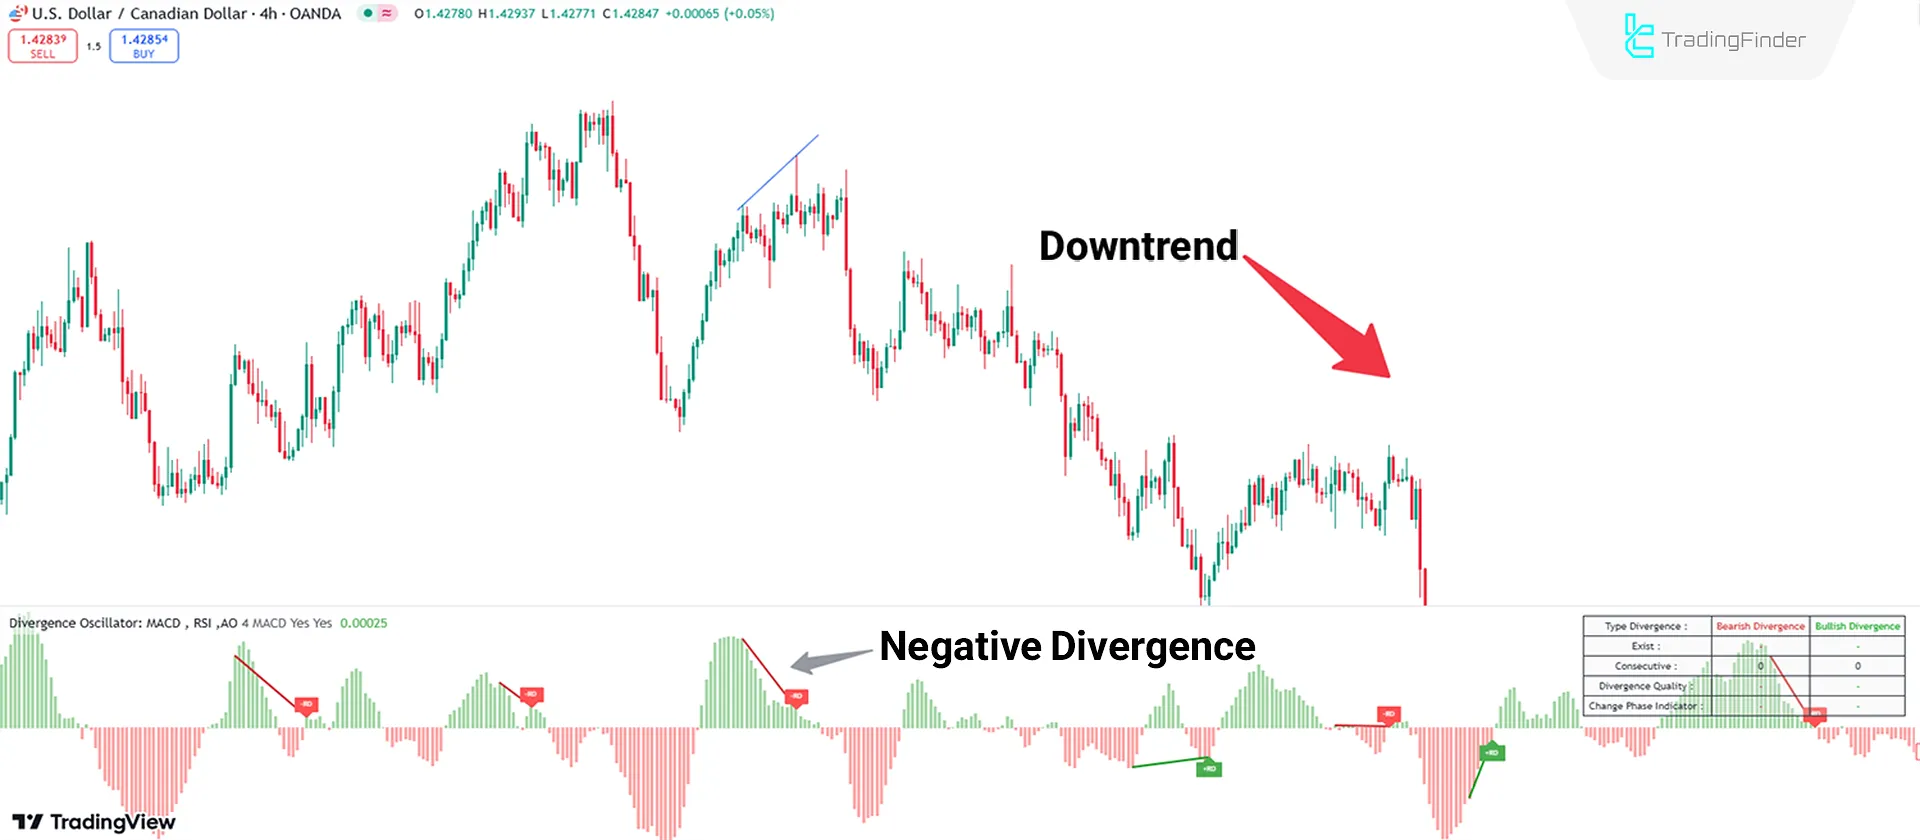
Indicator Performance in a Downtrend
For example, in the USD/CAD currency pair chart in a 4-hour timeframe, the price formed higher highs (HH), whereas the indicator displayed lower highs (LL), indicating negative divergence.
Negative divergence signals an uptrend's end and a downtrend's beginning.
Indicator Settings
The settings of the Divergence Detection Indicator (MACD, RSI, or AO) can be seen in the image below:
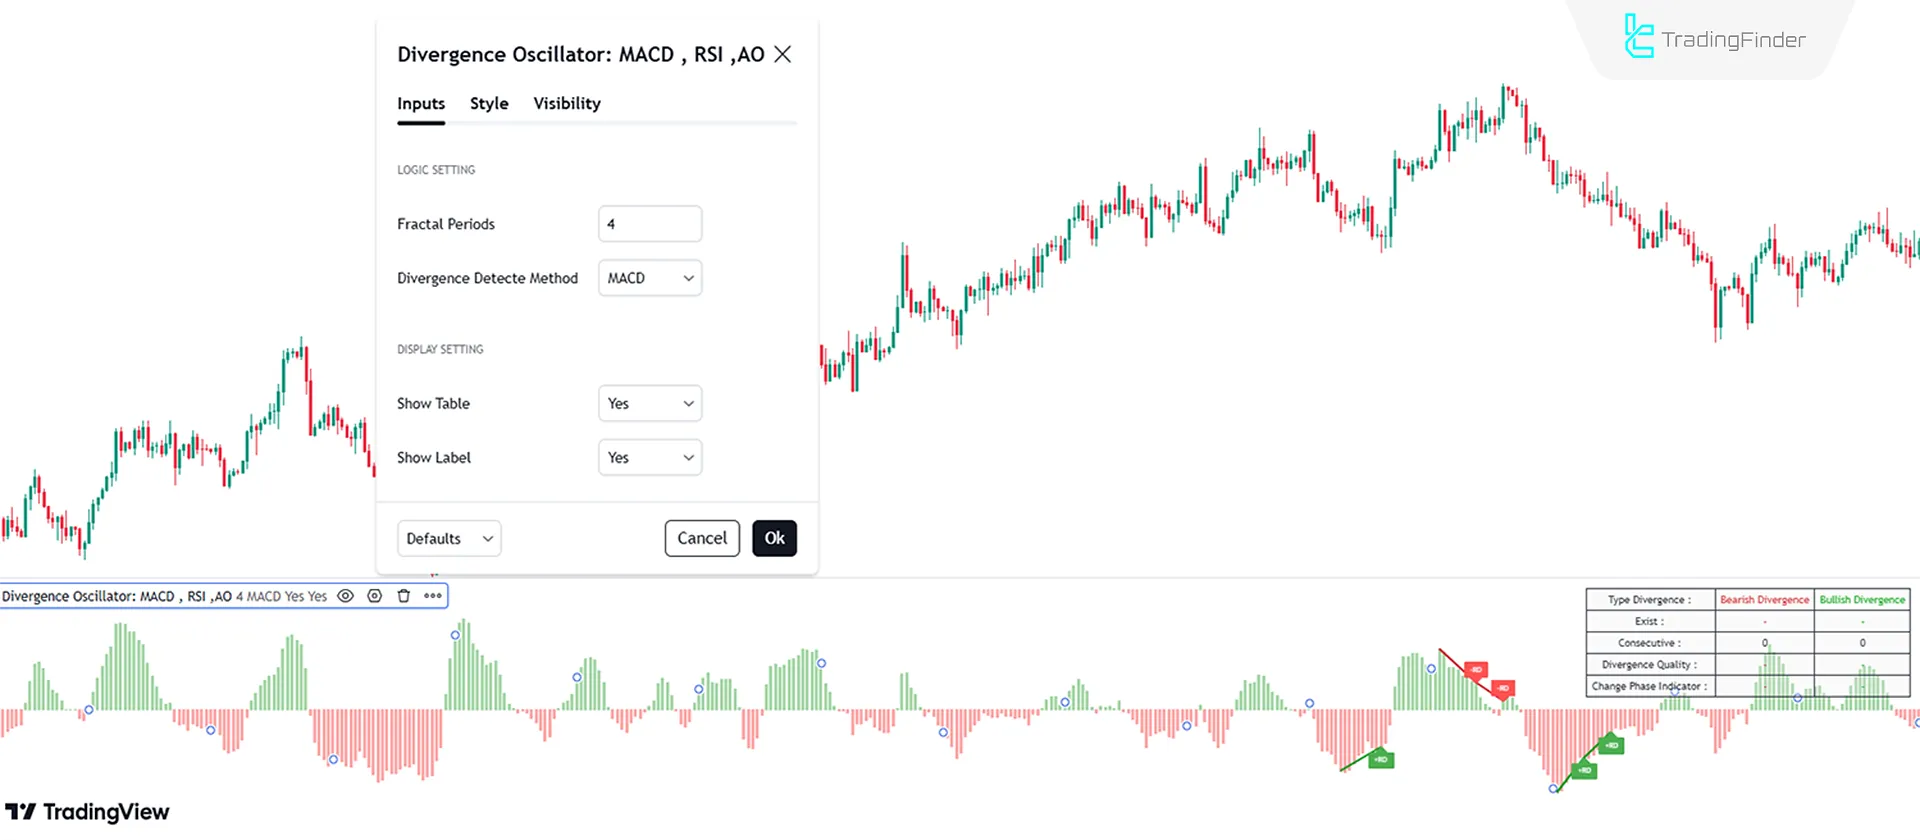
- Fractal Periods: Fractal periods for identifying divergences set to 4;
- Divergence Detecte Method: Choose the method for detecting divergences among "MACD," "RSI," and "AO";
- Show Table: Display the divergence information table;
- Show Label: Display labels.
Conclusion
The Divergence Detector MACD + RSI + AO Oscillator enables the analysis and identification of divergences using three tools MACD, RSI, and the AO Oscillator.
This oscillator visually displays price divergences and identifies whether they are positive or negative using labels.
One of its features is the ability to display a divergence information table for validating signals.
Divergence Detector MACD RSI TradingView PDF
Divergence Detector MACD RSI TradingView PDF
Click to download Divergence Detector MACD RSI TradingView PDFDoes this indicator use all three tools simultaneously?
Users can choose one tool for divergence analysis in the settings section.
Does this tool work on stock indices?
Yes, this indicator works in all markets.


