


TradingView
MetaTrader4
MetaTrader5
The OBV Divergence (On Balance Volume) indicator is designed to detect and display divergence between price and OBV for the TradingView platform.
On Balance Volume (OBV) measures buying and selling pressure based on trading volume and price.
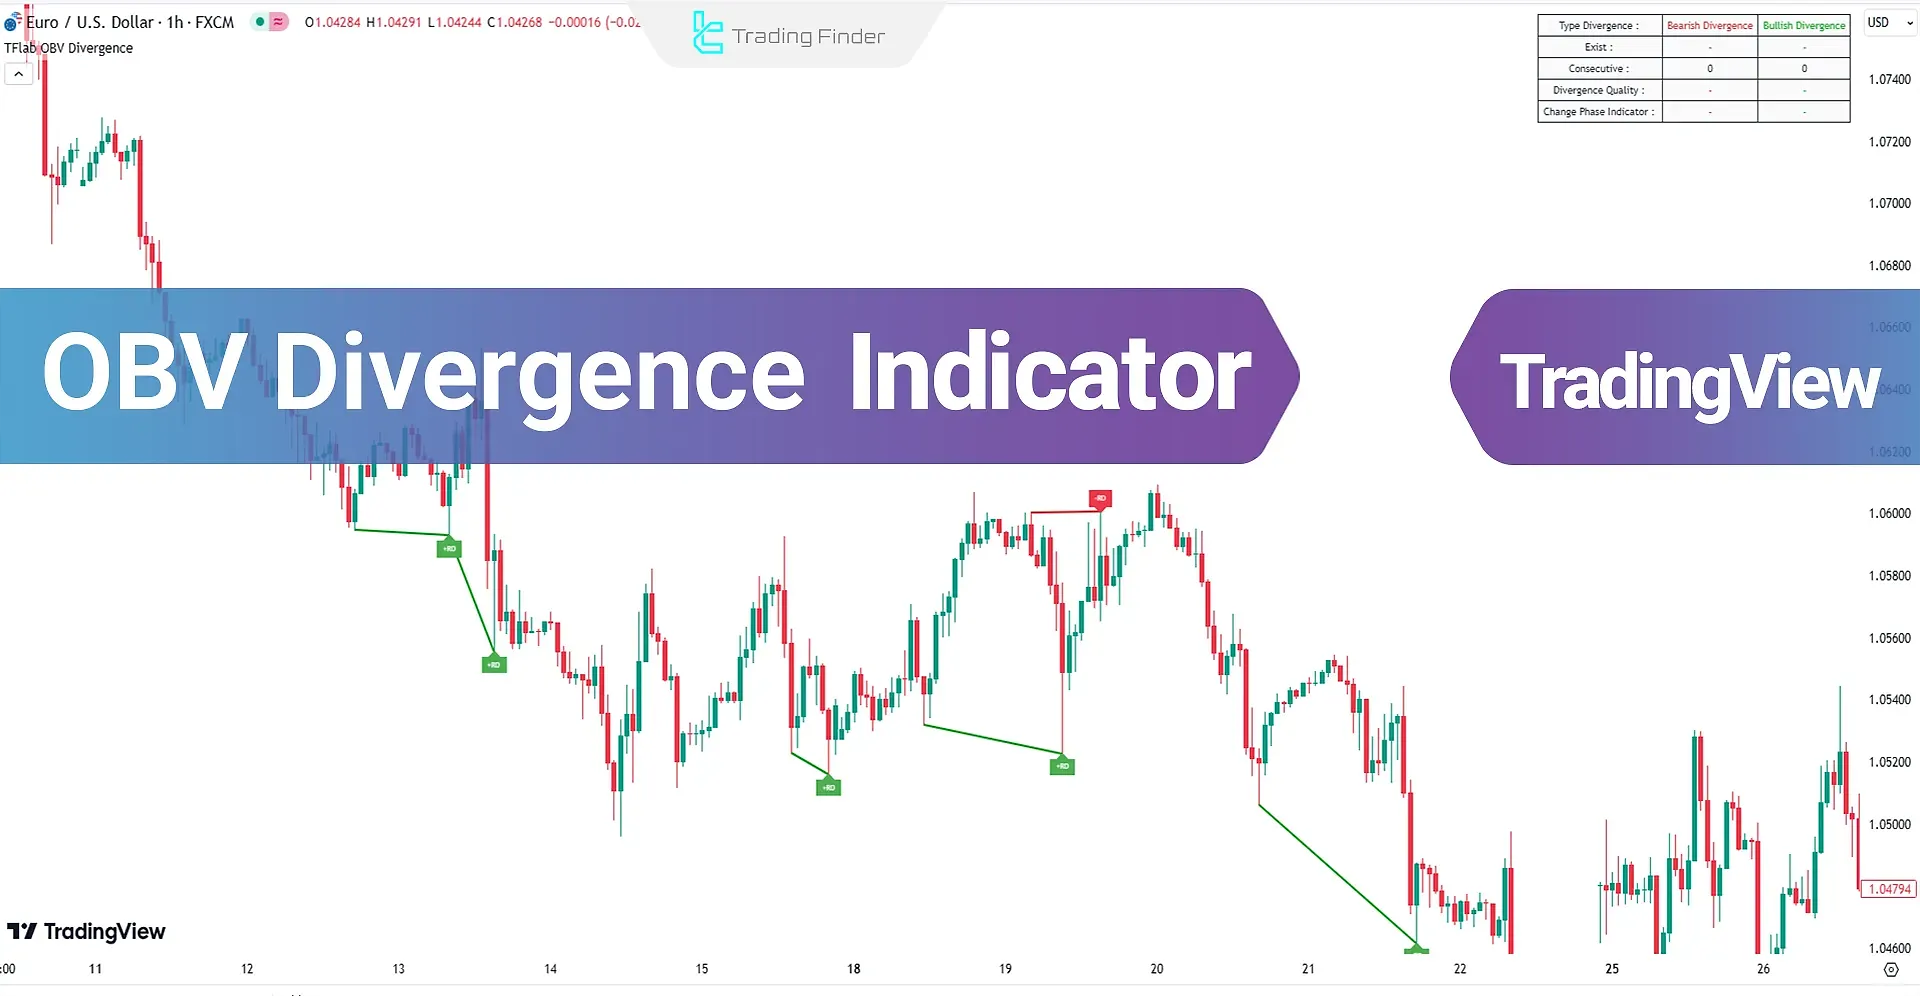
The OBV Divergence indicator calculates the divergence between the current price and OBV and displays it using lines and markers; This TradingView signal and forecast indicator also includes a separate table containing information about the divergences.
Table of OBV Divergence Indicator Specifications
The specifications of the OBV Divergence indicator are as follows:
Indicator Categories: | Signal & Forecast Tradingview Indicators Currency Strength Tradingview Indicators Trading Assist Tradingview Indicators |
Platforms: | Trading View Indicators |
Trading Skills: | Intermediate |
Indicator Types: | Reversal Tradingview Indicators |
Timeframe: | Multi-Timeframe Tradingview Indicators |
Trading Style: | Intraday Tradingview Indicators |
Trading Instruments: | TradingView Indicators in the Forex Market Cryptocurrency Tradingview Indicators Stock Tradingview Indicators Commodity Tradingview Indicators Indices Tradingview Indicators Share Stocks Tradingview Indicators |
Indicator Overview
The OBV Divergence indicator plots a table with real-time divergence information on the chart. The table includes the following data:
- Type Divergence: Type of divergences (Bullish or Bearish)
- Exist: Indicates the existence of divergence with a "+"
- Consecutive: Displays the number of consecutive divergences
- Divergence Quality: Evaluates the quality of the divergence based on the number of consecutive occurrences
- Change Phase Indicator: This shows the phase change between two oscillation peaks
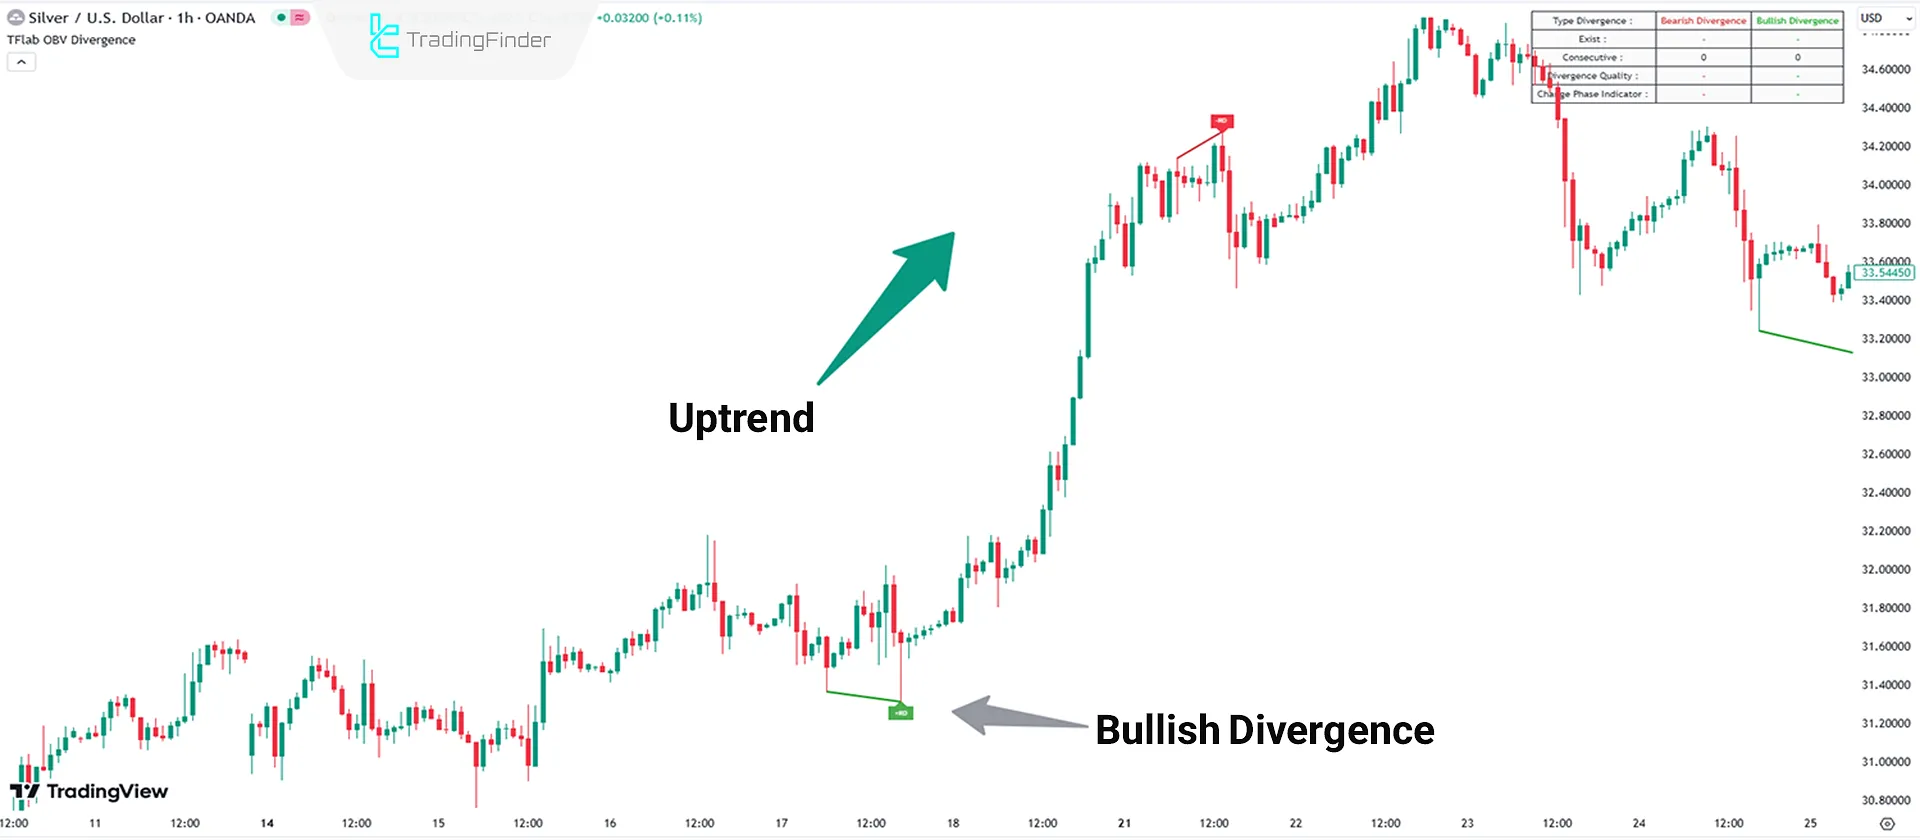
Positive Divergence
The Silver/U.S. Dollar chart is an example of a Bullish Divergence, showing its impact on price.
The OBV Divergence indicator detects divergence between price and OBV, using a green line to mark the Bullish Divergence, signaling the beginning of an upward trend.
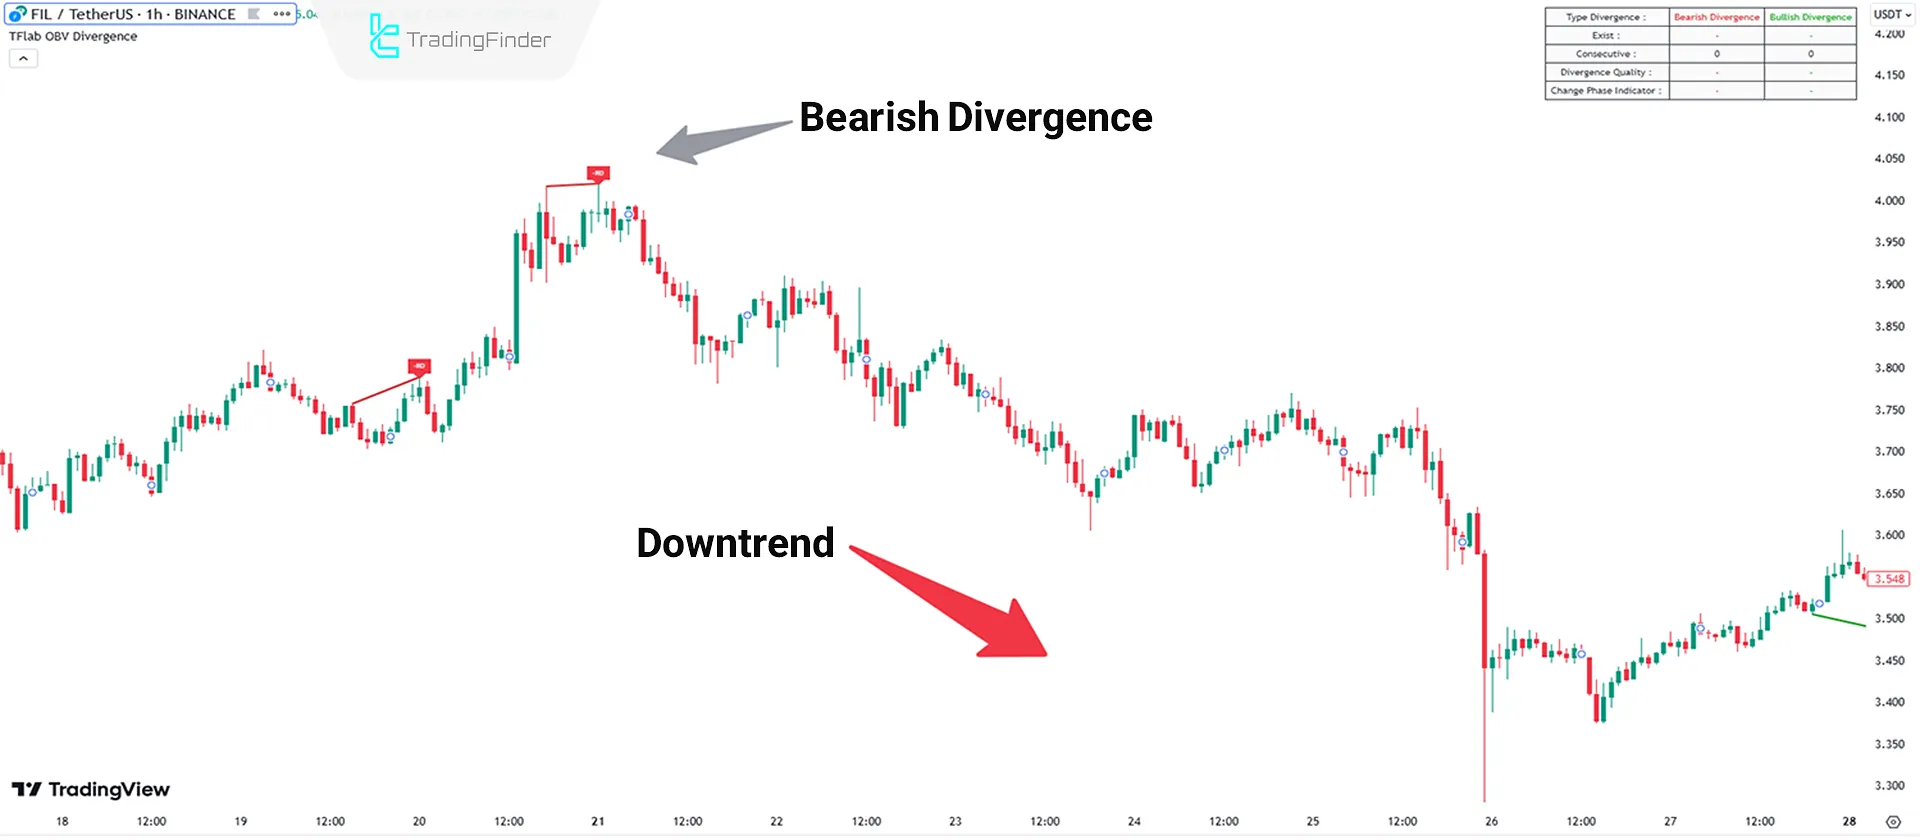
Negative Divergence
The 1-hour File Coin (Filecoin) chart, indicator detects the divergence between price and OBV using a red line.
In such cases, divergence marker lines can be used as trade entry signals.
Indicator Settings
The settings section for the OBV Divergence indicator is as follows:
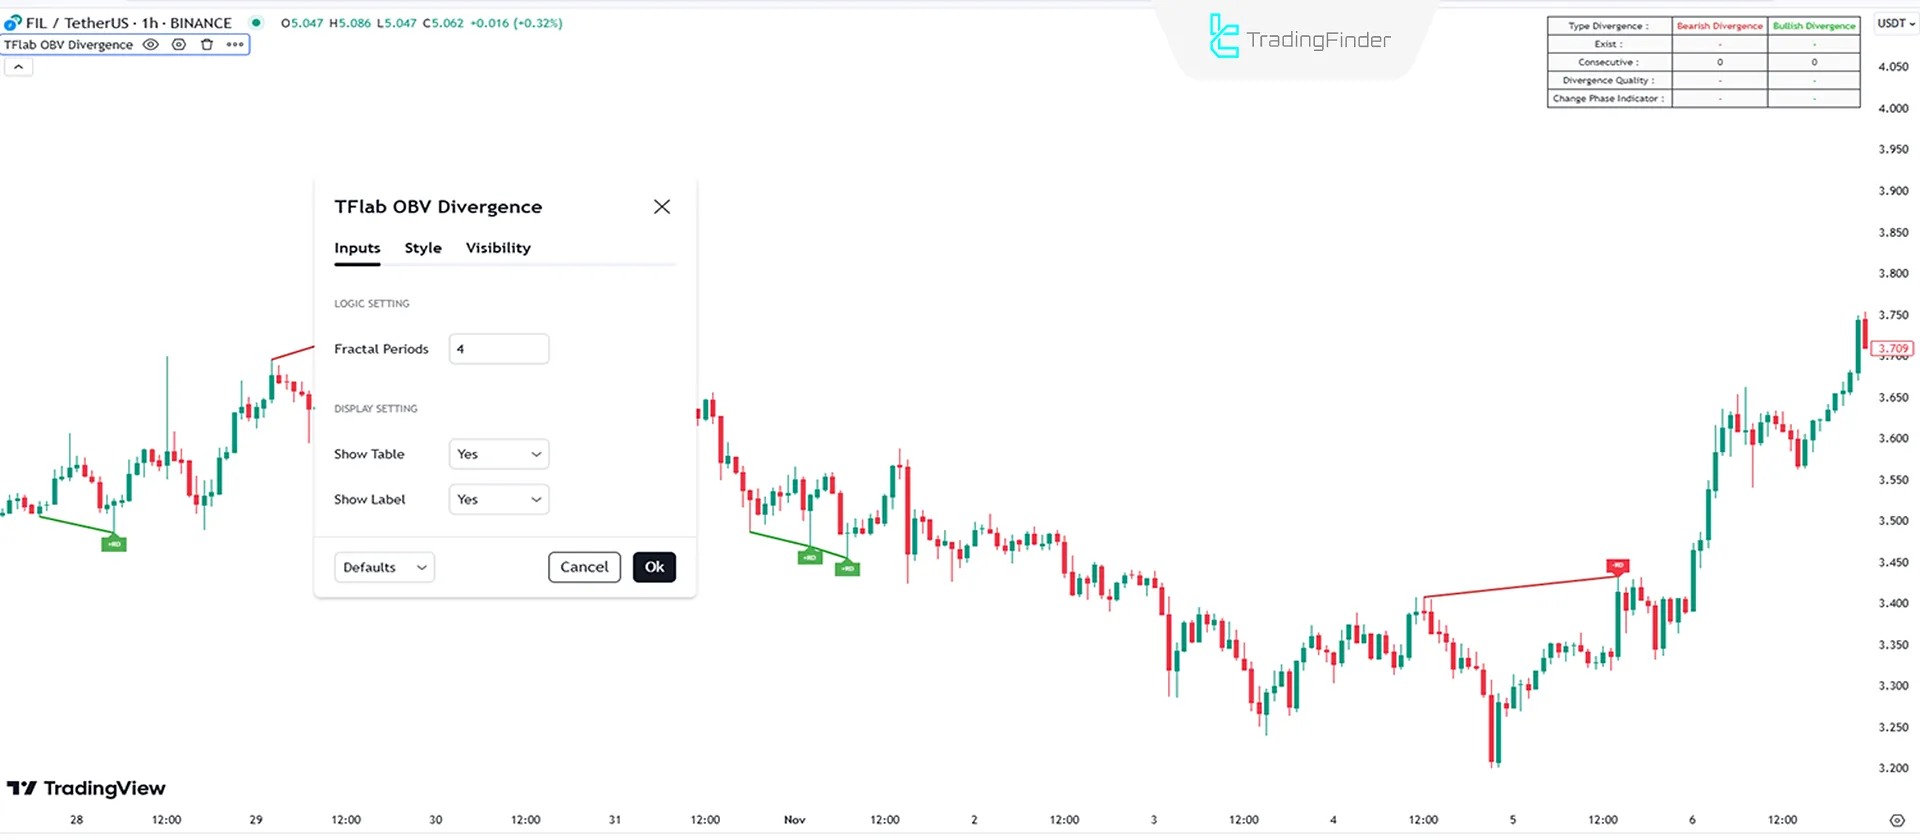
Logic Setting
- Fractal Period: The number of periods for detecting divergences is set to 4
Display Setting
- Show Table: Display the divergence table
- Show Label: Display the divergence labels
Conclusion
TheOBV Divergence indicator (On Balance Volume Divergence) analyzes divergences between price and OBV to provide signals for entering trades.
This trading tool, one of TradingView currency strength indicators, can be used in all trading markets.
On Balance Volume Divergence TradingView PDF
On Balance Volume Divergence TradingView PDF
Click to download On Balance Volume Divergence TradingView PDFIs this indicator suitable for monthly trades?
No, this indicator does not display divergences in monthly timeframes.
How does this indicator display divergences?
The OBV Divergence indicator displays divergences using lines and labels.


