


TradingView
MetaTrader4
MetaTrader5
The Pivot Points Level Indicator is a TradingView fractal pivot points indicator for identifying support and resistance zones.
Pivot Points are key levels on a chart calculated using the previous day's price data (open, high, low, and close). In addition to this indicator, you can use TradingFinder pivot point calculator tool to automatically calculate these levels.
They are especially usefulshort short-term timeframes.
Specifications of the "Pivot Points Level" Indicator
The specifications and features of the Pivot Points Level Indicator are as follows:
Indicator Categories: | Pivot Points & Fractals Tradingview Indicators Support & Resistance Tradingview Indicators Liquidity Tradingview Indicators Fibonacci TradingView Indicators |
Platforms: | Trading View Indicators |
Trading Skills: | Intermediate |
Indicator Types: | Reversal Tradingview Indicators Leading Tradingview Indicators |
Timeframe: | Daily-Weekly Time Tradingview Indicators M1-M5 Time MT4 Indicators M15-M30 Time MT4 Indicators |
Trading Style: | Intraday Tradingview Indicators Scalper Tradingview Indicators |
Trading Instruments: | TradingView Indicators in the Forex Market Cryptocurrency Tradingview Indicators Indices Tradingview Indicators Binary Option Tradingview Indicators |
Indicator at a Glance
The Pivot Points Level Indicator offers four distinct types of pivot points:
- Floor Pivot Points: Widely used for identifying support and resistance levels
- Camarilla Pivot Points: Consist of eight distinct levels closely associated with support and resistance
- Woodie Pivot Points: While similar to Floor Pivot Points, they emphasize the closing price
- Fibonacci Pivot Points: Combine Floor Pivot Points with Fibonacci retracement levels, applied to the previous session's trading range
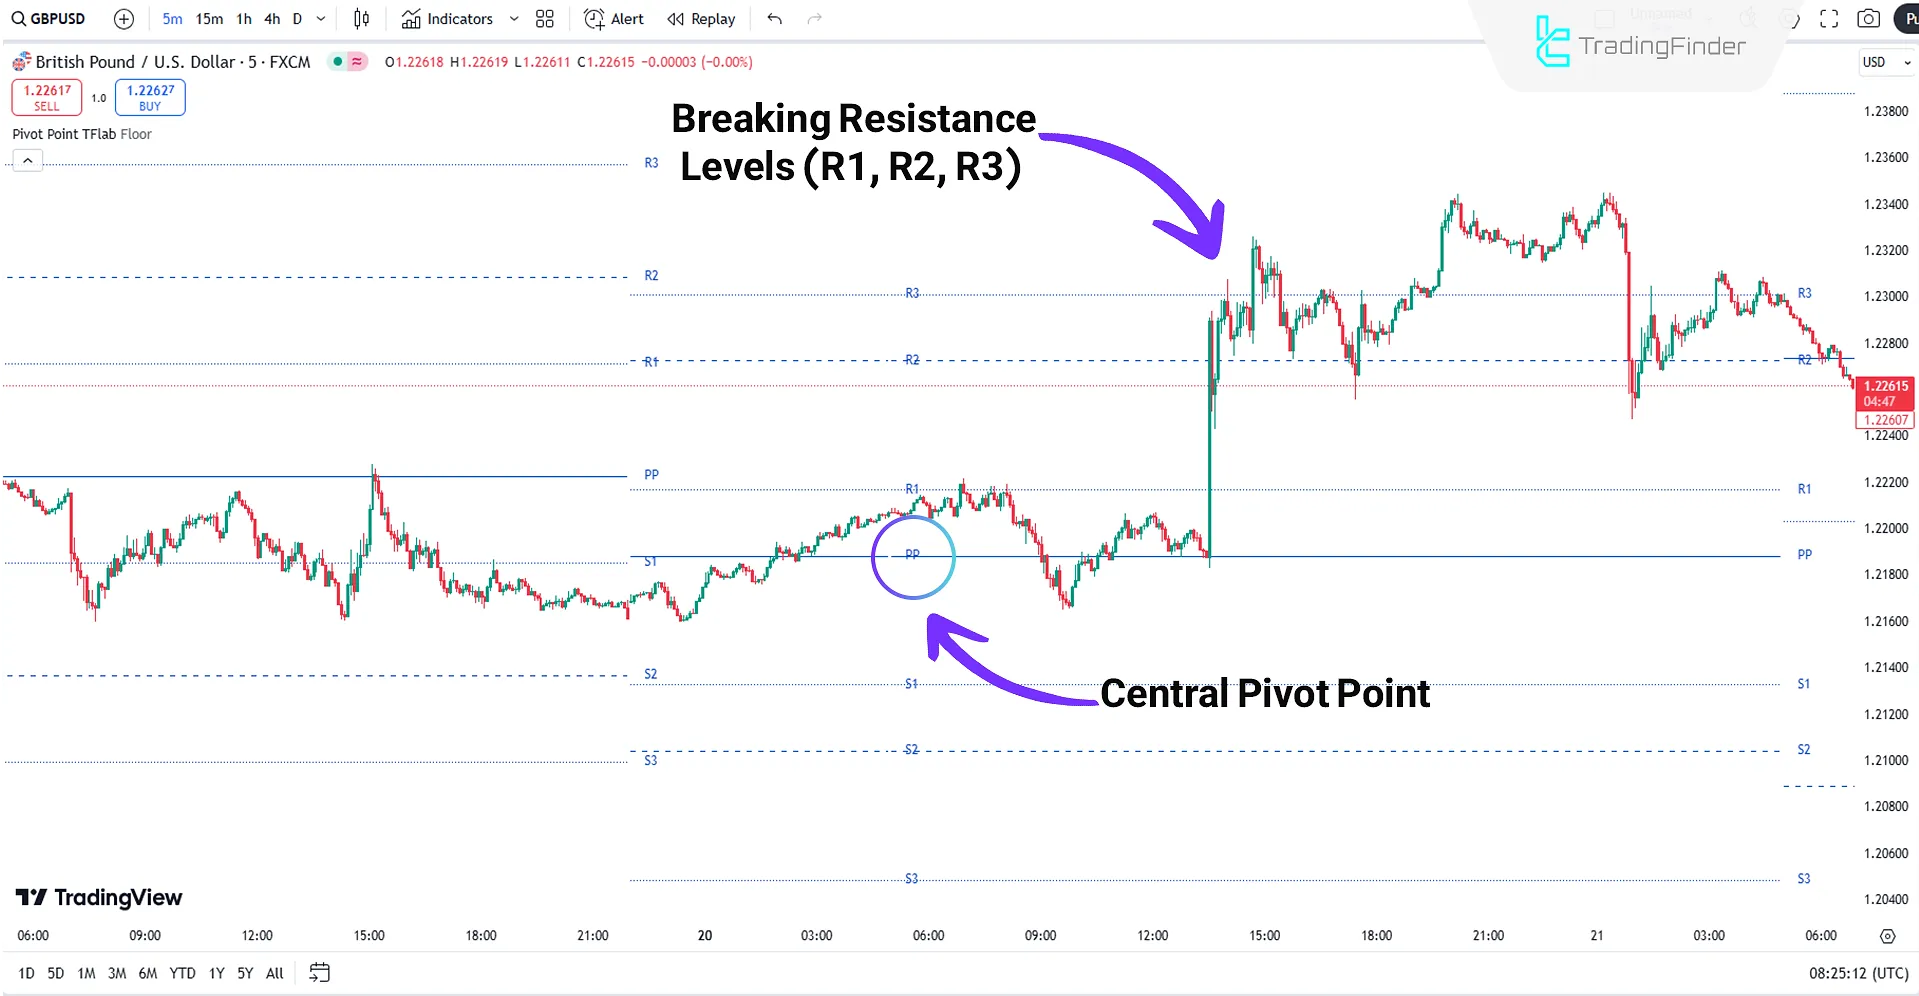
Pivot Points Levels in an Uptrend
In the 5-minute chart of GBP/USD, currency pair in the Forex market, the trend above the central pivot (PP) indicates a potential uptrend.
According to the chart analysis, after returning to the central pivot, the price moved toward higher price targets, breaking resistance lines (R1, R2, R3).
The support lines (S1, S2, S3) are appropriate zones for setting Stop Loss (SL) in such scenarios.
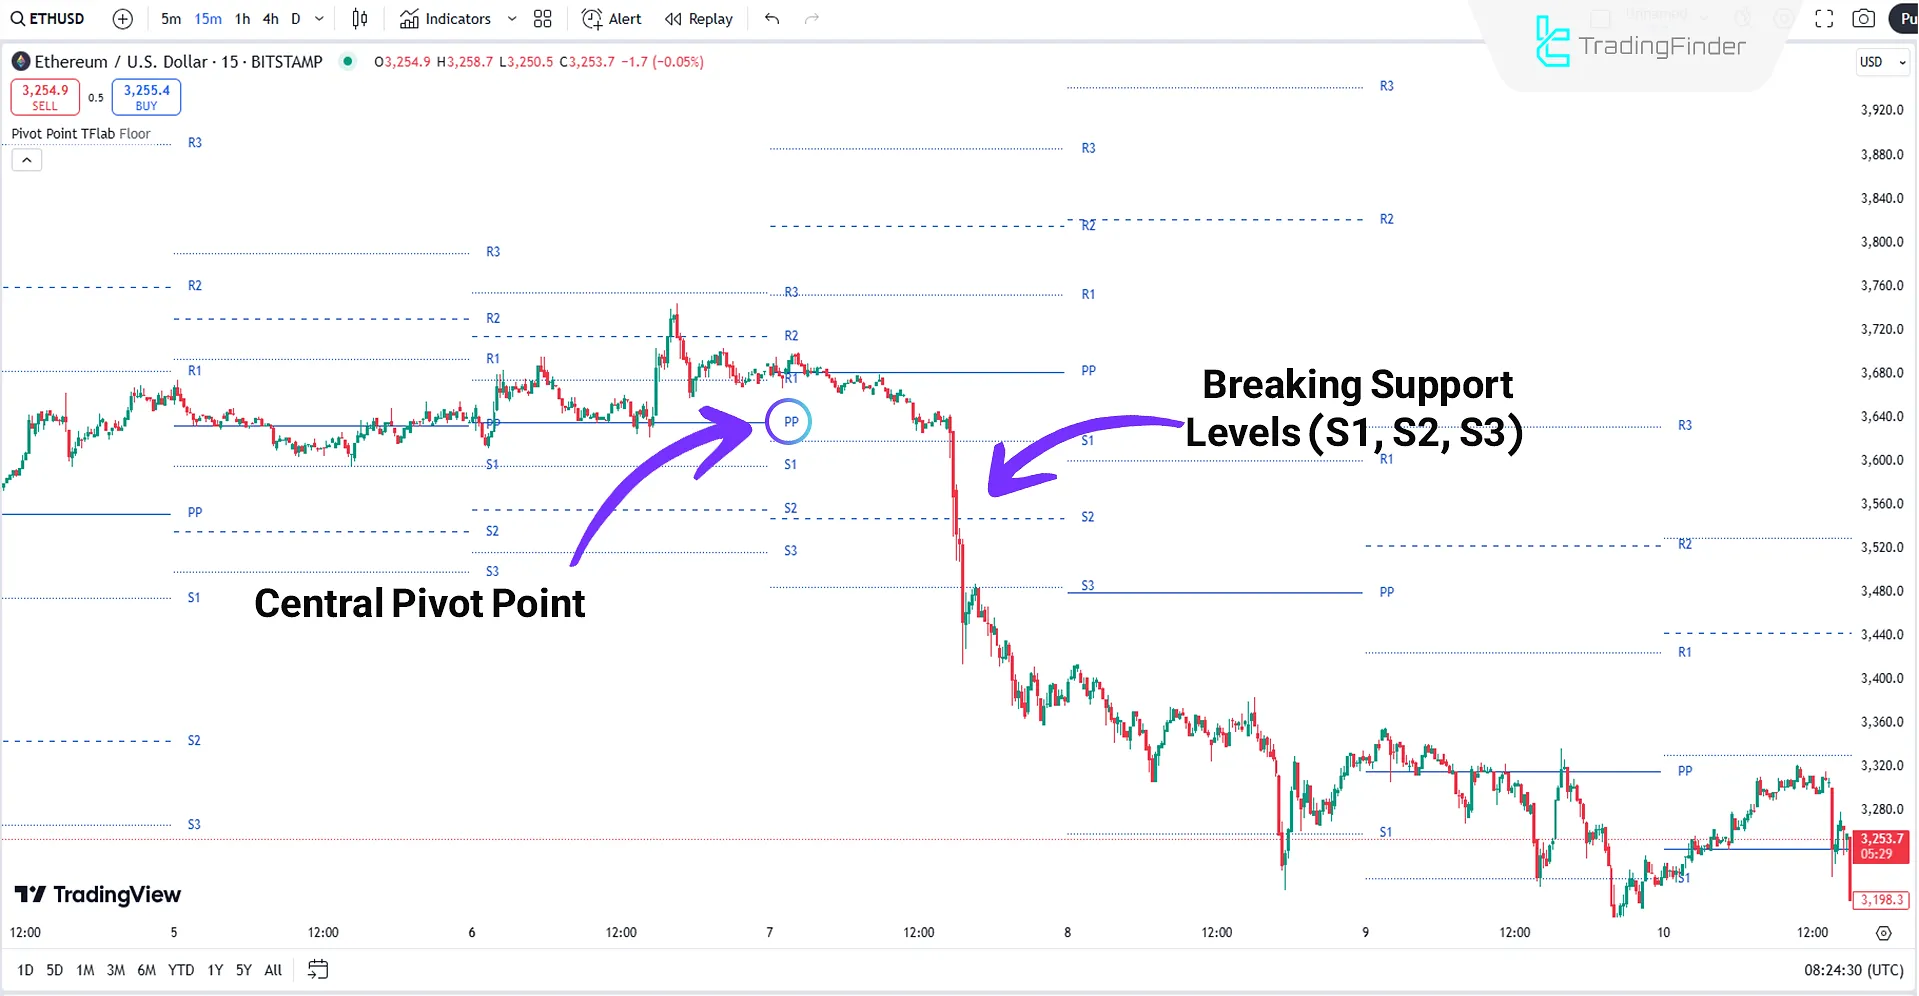
Pivot Points Levels in a Downtrend
Based on the 15-minute Ethereum (ETH) chart analysis, the trend below the central pivot (PP) signals the beginning of a potential downtrend.
The image shows that the price broke sharply below the central pivot (PP) and breached support lines (S1, S2, S3). In a bearish trend, the R1, R2, and R3 levels are ideal for placing a Stop Loss (SL).
Settings of the Pivot Points Level Indicator
The settings panel for the Pivot Points Level indicator is described as follows:
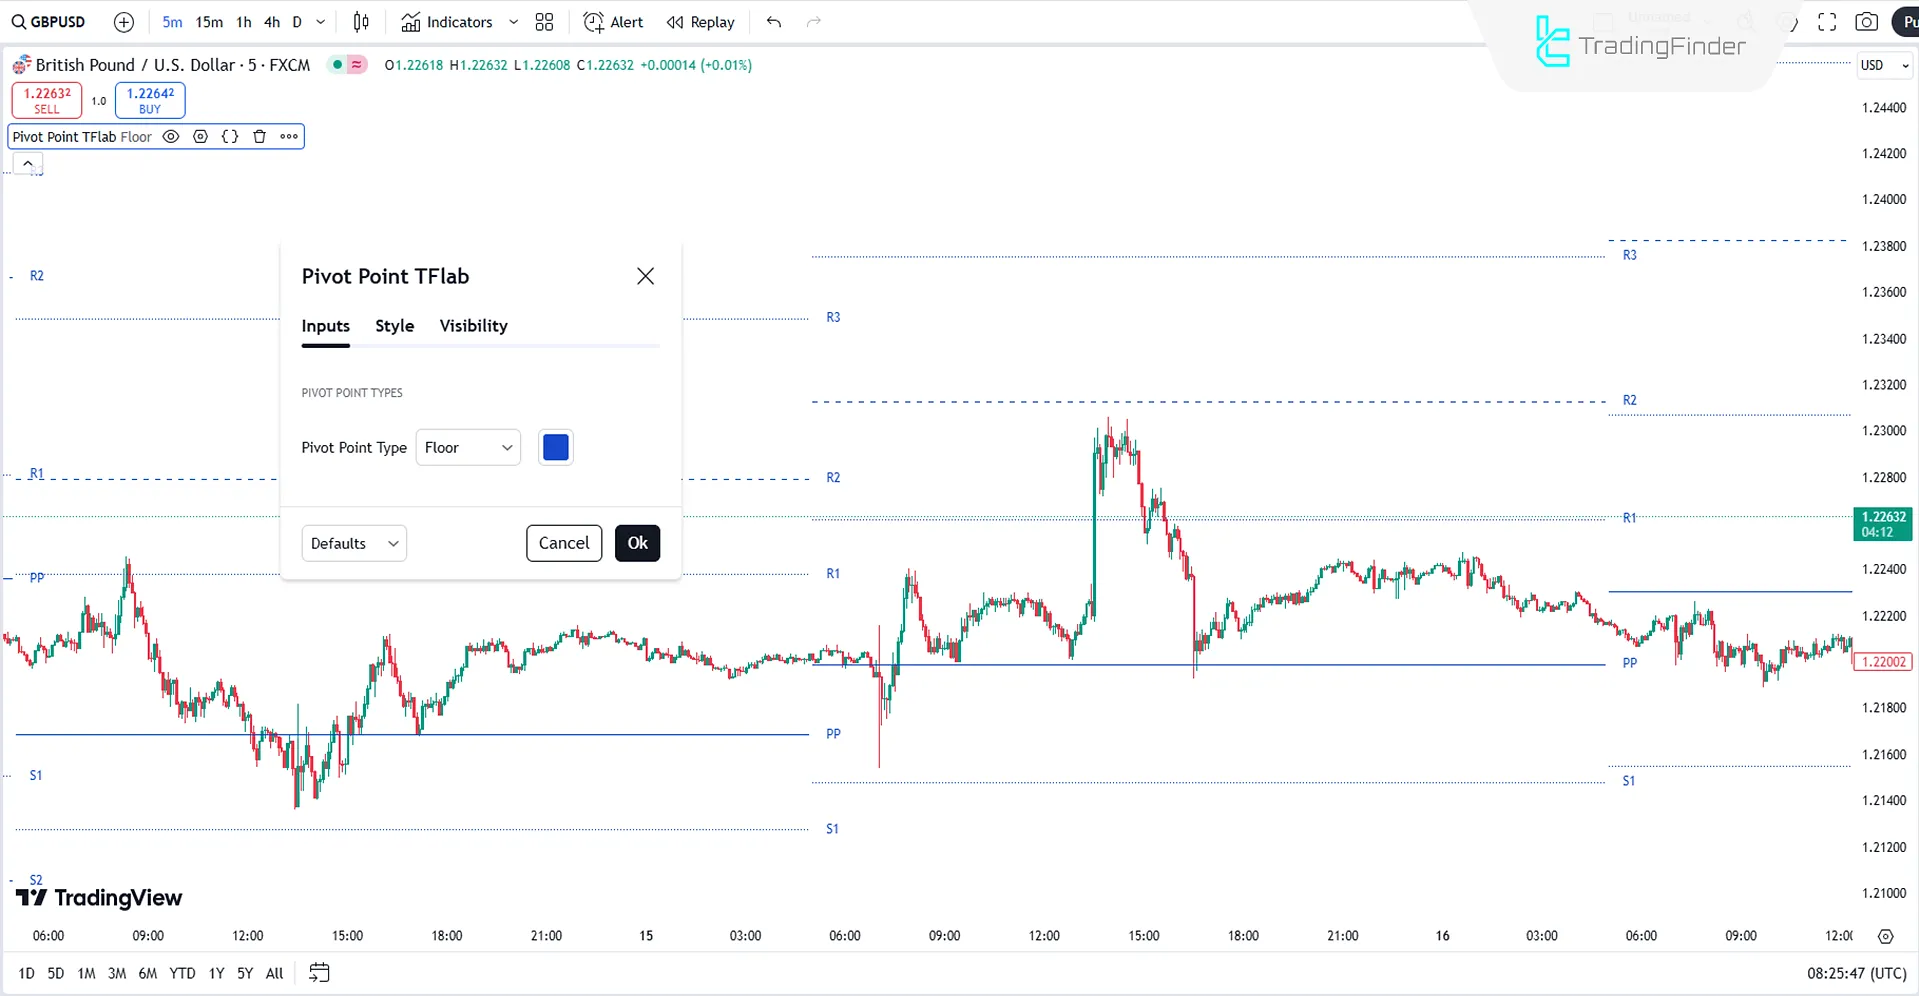
- Pivot Point Type: Determines the color and type of pivot levels.
Conclusion
The Pivot Points Level Indicator provides four distinct types of pivot levels, making it highly effective for analyzing and identifying trend reversal zones.
As a TradingView indicator, it precisely marks support and resistance areas on the chart by drawing pivot point lines.
Pivot Points Level TradingView PDF
Pivot Points Level TradingView PDF
Click to download Pivot Points Level TradingView PDFWhat is the difference between Woodie Pivot Points and Floor Pivot Points?
Woodie Pivot Points are similar to Floor Pivot Points but emphasize the closing price more.
What are the features of Camarilla Pivot Points?
Camarilla Pivot Points consist of eight distinct levels that can be used to identify support and resistance areas.


