


TradingView
MetaTrader4
MetaTrader5
The Quarterly Theory ICT Indicator is designed based on ICT concepts and fractal time analysis.
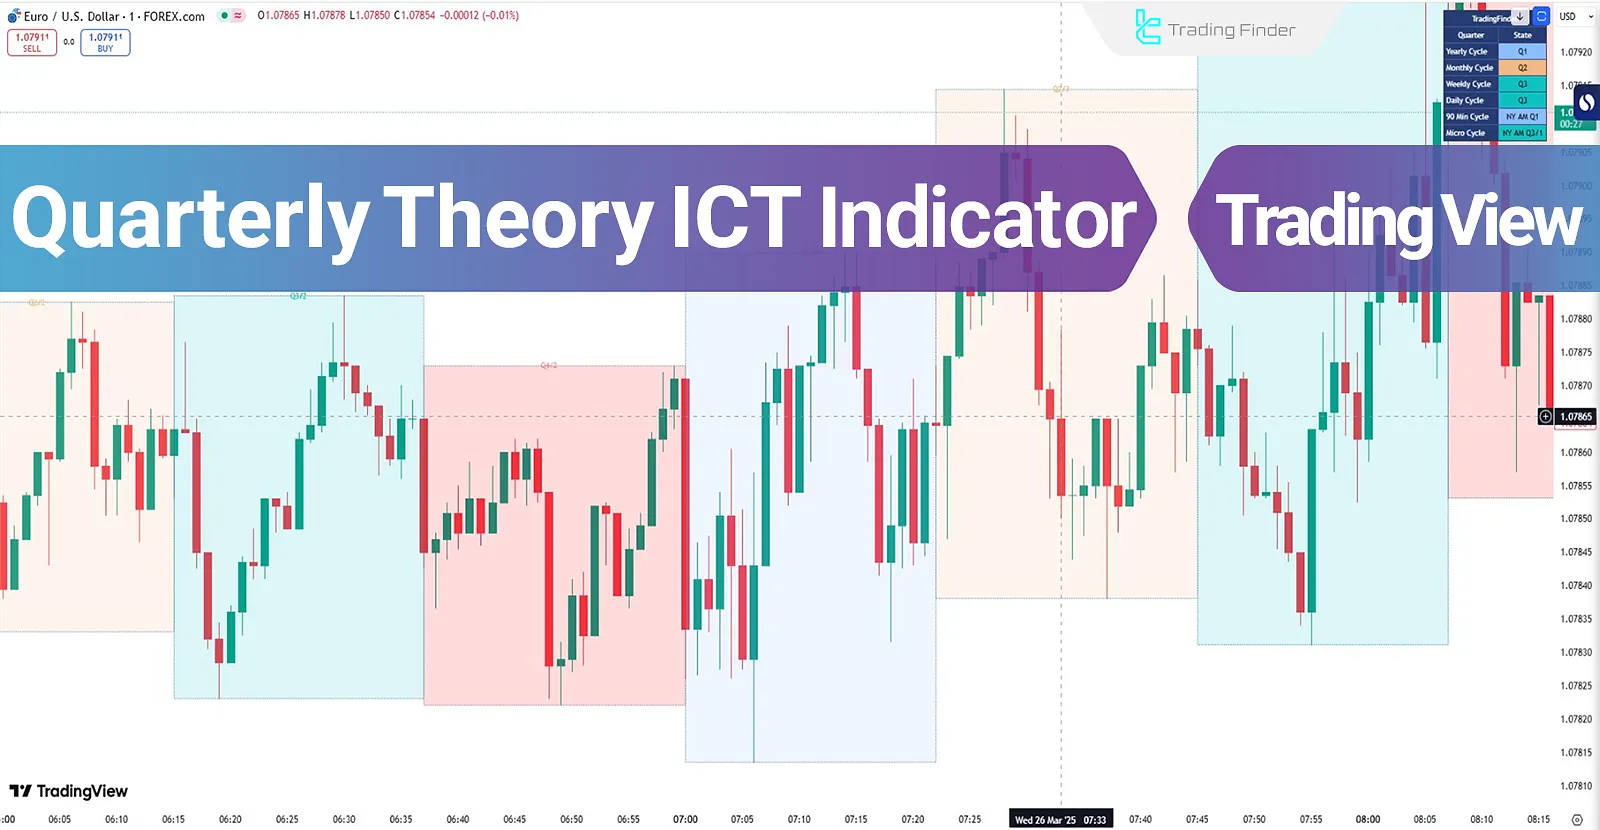
This method divides time into four quarters (Q1 to Q4), where the phases of Accumulation, Price Manipulation (Judas Swing), Distribution, and Trend Continuation/Reversal appear systematically and repetitively.
Quarterly Theory ICT Indicator Table
The following table summarizes the specifications of the indicator.
Indicator Categories: | ICT Tradingview Indicators Session & KillZone Tradingview Indicators Cycles Tradingview Indicators |
Platforms: | Trading View Indicators |
Trading Skills: | Advanced |
Indicator Types: | Reversal Tradingview Indicators Breakout Tradingview Indicators |
Timeframe: | Multi-Timeframe Tradingview Indicators |
Trading Style: | Day Trading Tradingview Indicators |
Trading Instruments: | TradingView Indicators in the Forex Market Cryptocurrency Tradingview Indicators Stock Tradingview Indicators Forward Tradingview Indicators |
Indicator Overview
In the Quarterly Theory Trading System, time is divided into four trading seasons:
Q1 [Accumulation Phase]
The market remains consolidated, setting the stage for a new trend formation.
Q2 [Manipulation Phase]
Sudden price swings and false breakouts occur, marking the true start of a trend shift.
Q3 [Distribution Phase]
Large-scale price distribution happens, leading to maximum market volatility.
Q4 [Continuation/Reversal Phase]
The market either continues the existing trend or reverses into a new direction.
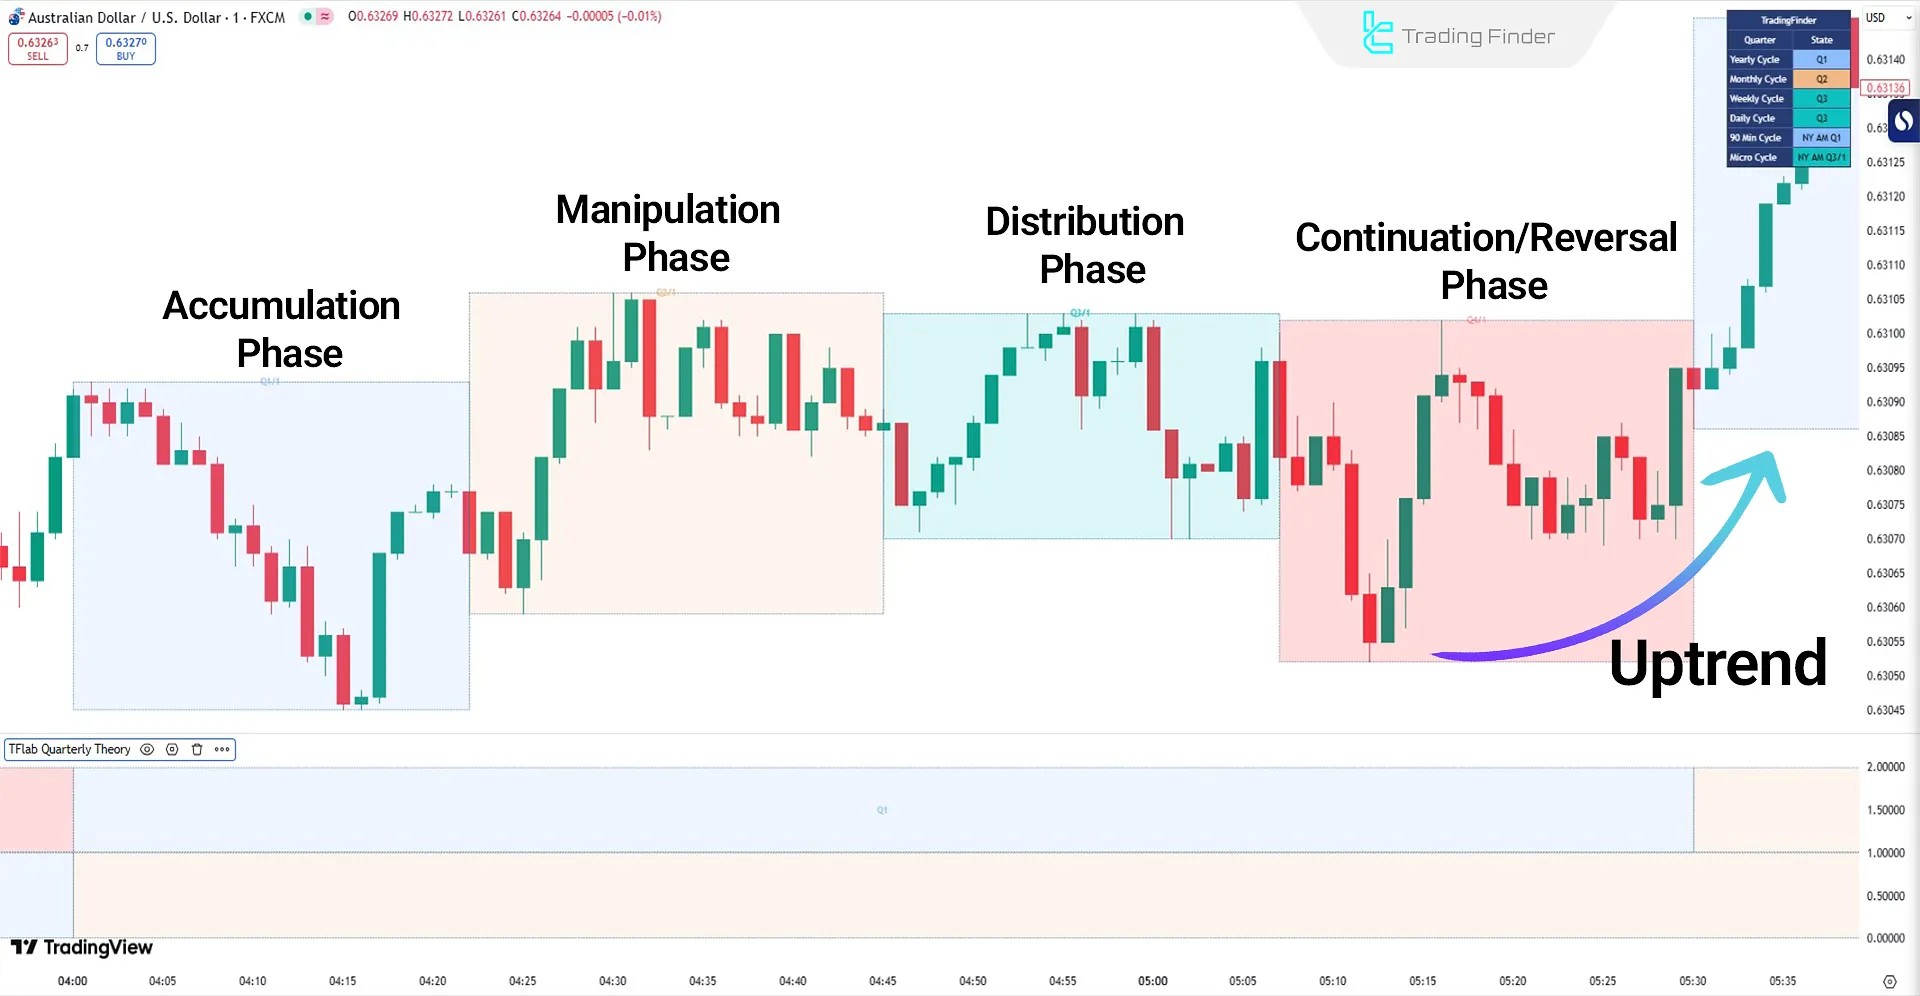
Indicator in an Uptrend
In the AUD/USD chart, the price enters the Accumulation Phase, where liquidity is collected and the market is consolidated. Then, in the Manipulation Phase, a false breakout to a higher high occurs, leading traders into incorrect positions.
Following this stage, the market moves into the Distribution Phase, where the price declines. Finally, in the fourth phase, the trend reverses and enters the main bullish movement.
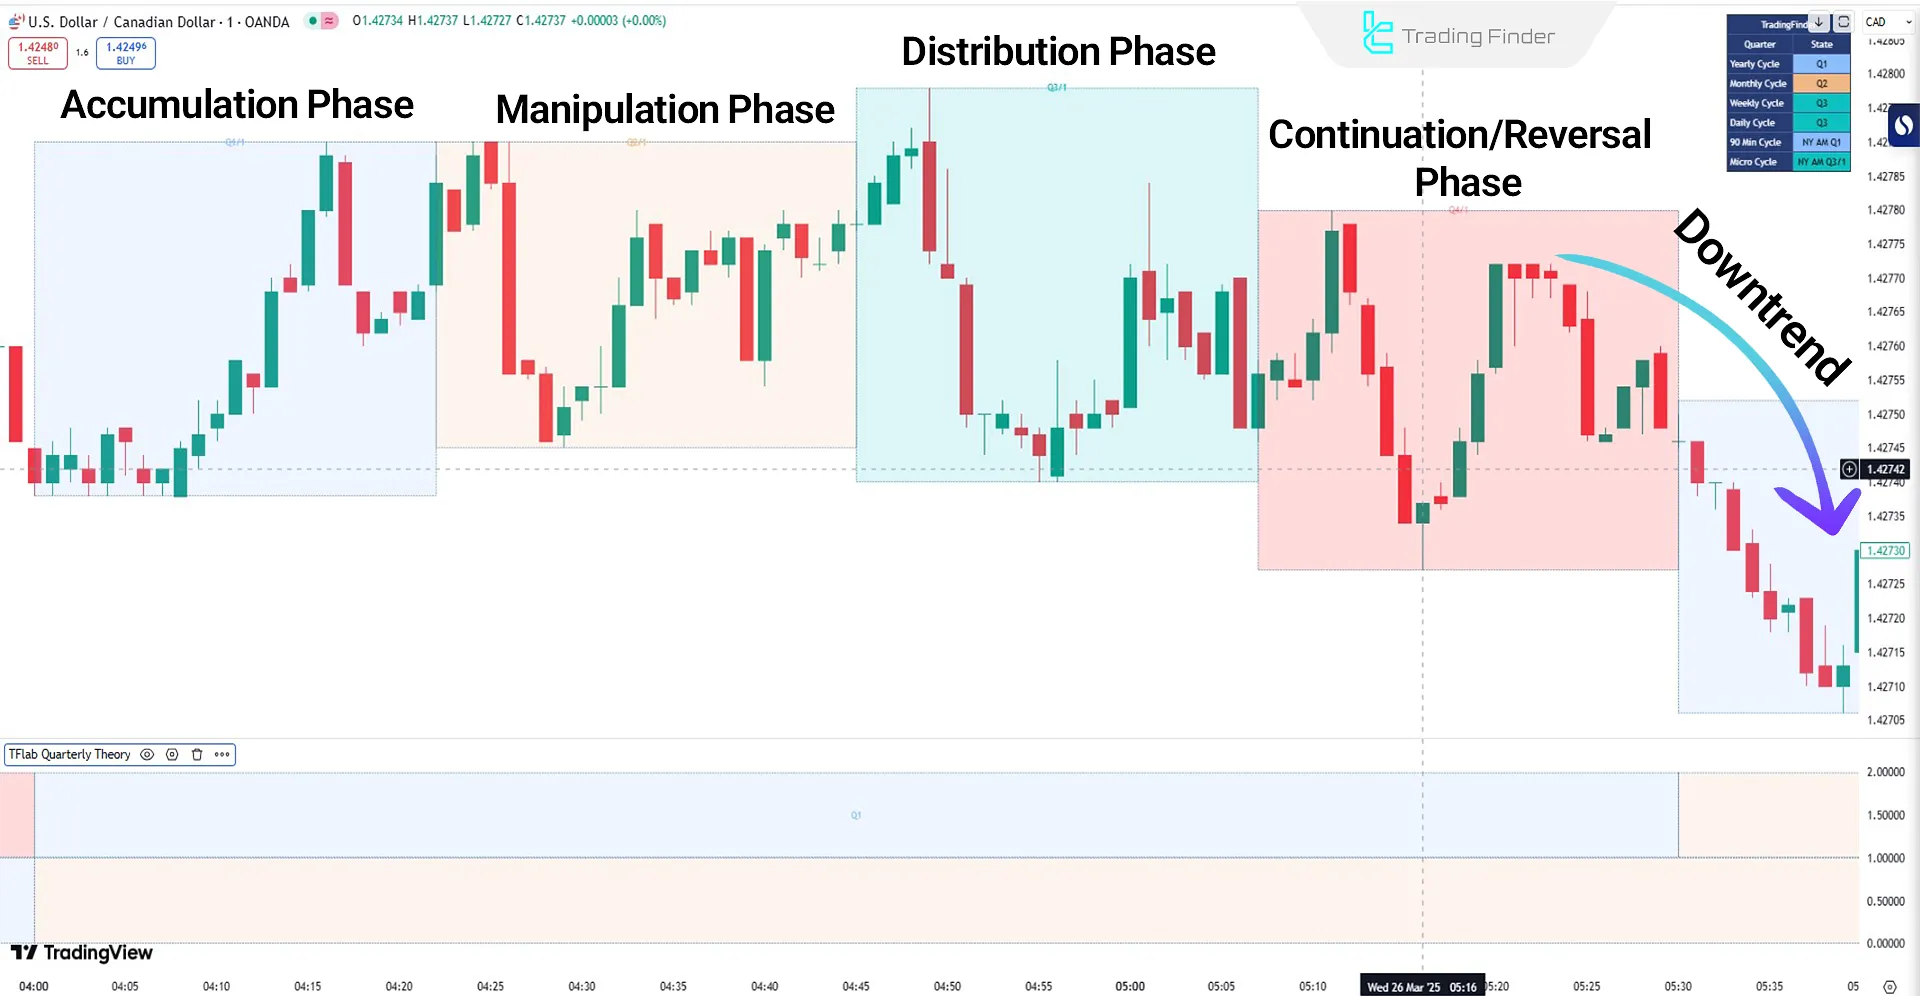
Indicator in a Downtrend
In the USD/CAD chart, the price first moves upward in the Accumulation Phase, collecting liquidity. Then, in the Manipulation Phase, a deceptive price drop occurs, misleading traders.
In the Distribution Phase, the price creates a new high Liquidity, triggering stop losses. Finally, in the fourth phase, the market resumes its main downtrend and continues to decline.
Quarterly Theory ICT Indicator Settings
The parameters for the Quarterly Theory ICT Indicator are shown in the image below:
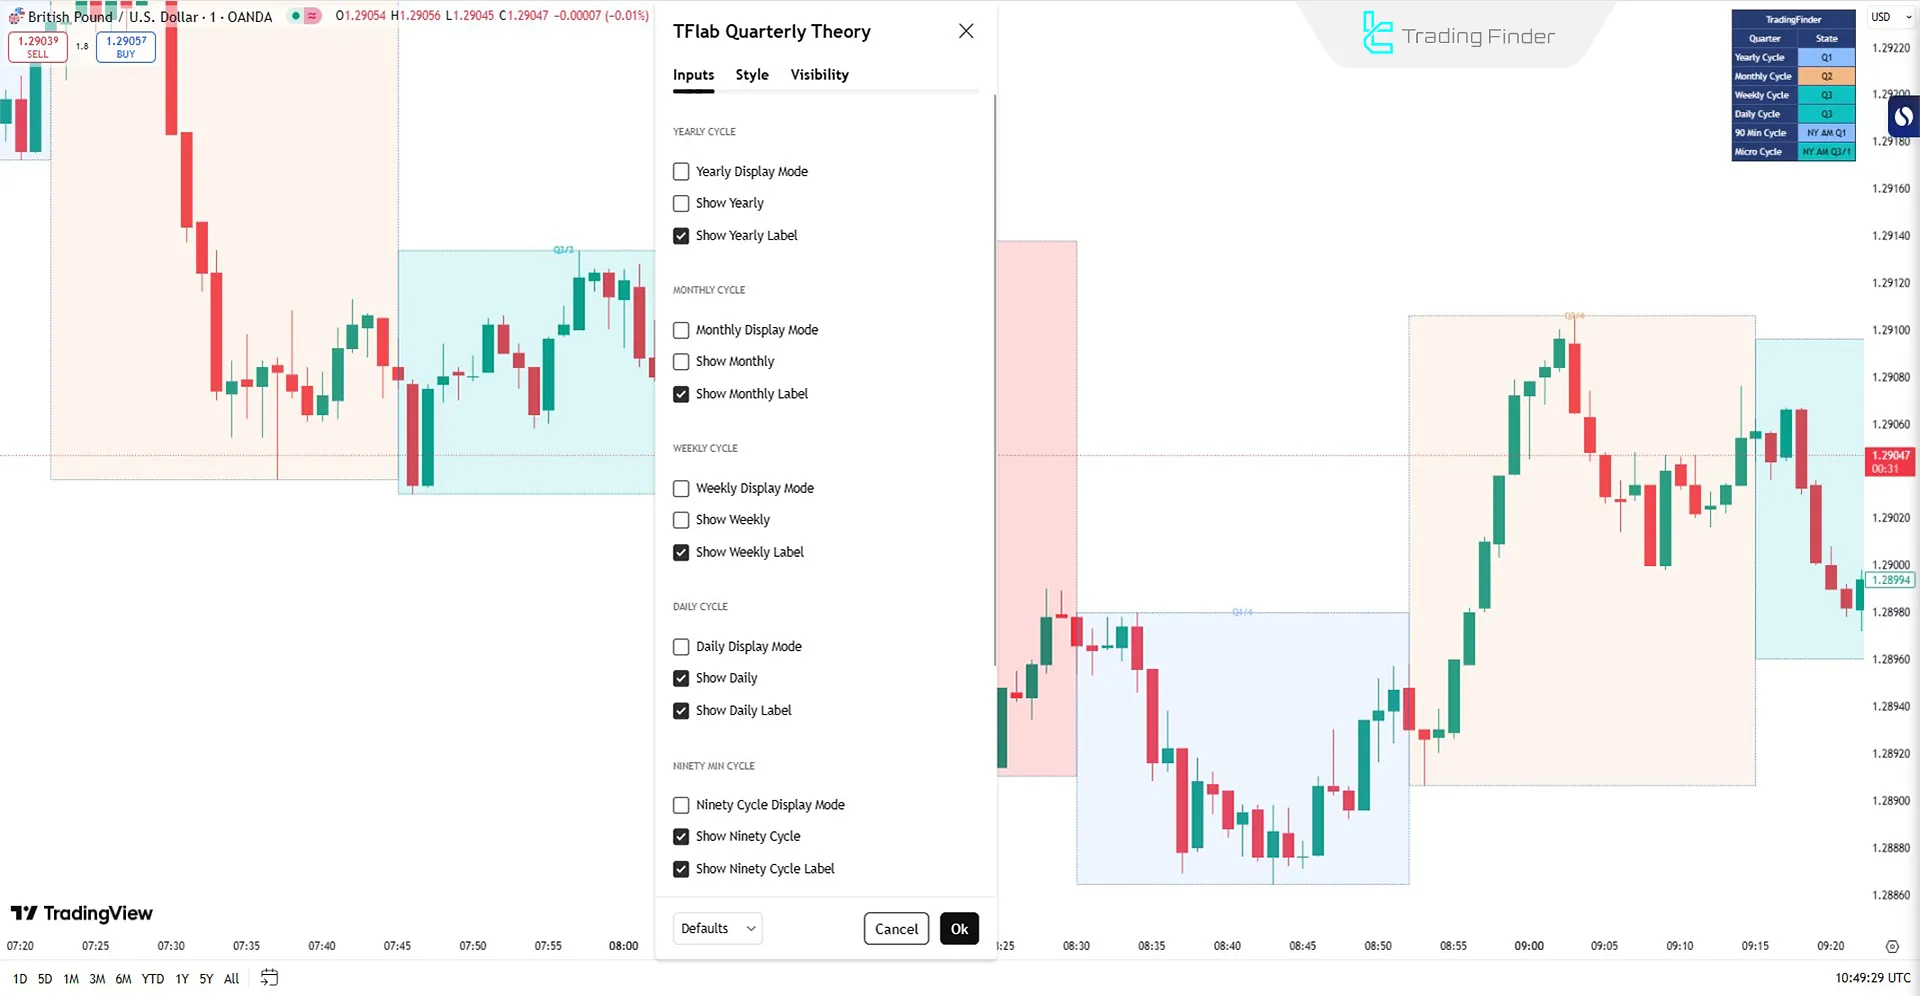
Yearly Cycle
- Yearly Display Mode: Displays the annual cycle
- Show Yearly: Enables yearly data visualization
- Show Yearly Label: Displays yearly cycle labels
Monthly Cycle
- Monthly Display Mode: Displays the monthly cycle
- Show Monthly: Enables monthly data visualization
- Show Monthly Label: Displays monthly cycle labels
Weekly Cycle
- Weekly Display Mode: Displays the weekly cycle
- Show Weekly: Enables weekly data visualization
- Show Weekly Label: Displays weekly cycle labels
Daily Cycle
- Daily Display Mode: Displays the daily cycle
- Show Daily: Enables daily data visualization
- Show Daily Label: Displays daily cycle labels
Ninety-Minute Cycle
- Ninety Cycle Display Mode: Displays the 90-minute cycle
- Show Ninety Cycle: Enables 90-minute cycle data visualization
- Show Ninety Cycle Label: Displays 90-minute cycle labels
Micro Cycle
- Micro Cycle Display Mode: Displays the micro cycle
- Show Micro Cycle: Enables micro cycle data visualization
- Show Micro Cycle Label: Displays micro cycle labels
Table Settings
- Table Display Mode: Enables the table view
- Show Table: Displays table data
- Show More Info: Provides additional table details
Conclusion
The Quarterly Theory Trading Indicator is developed based on ICT methodology and key concepts such as True Open, Accumulation, Manipulation, Distribution, Continuation/Reversal, Technical Analysis, Price Patterns.
This indicator is a structured framework for predicting market trends and developing trading strategies. It is applicable across all timeframes, including yearly, monthly, weekly, daily, and even 90-minute trading sessions.
Quarterly Theory ICT TradingView PDF
Quarterly Theory ICT TradingView PDF
Click to download Quarterly Theory ICT TradingView PDFWhat is the Quarterly Theory ICT Indicator?
The Quarterly Theory ICT Indicator is a technical analysis tool based on ICT methodology. It divides time into four key phases (Accumulation, Manipulation, Distribution, and Continuation/Reversal) to identify market trends.
Who is the Quarterly Theory ICT Indicator designed for?
This indicator is suitable for trend traders, swing traders, and scalpers. It helps them analyze market cycles and optimize their trade entries and exits.


