


The XAMD/AMDX [01] Quarterly Theory Cycle Indicator is an advanced tool for precise price analysis and identifying trend reversal points on the TradingView platform.
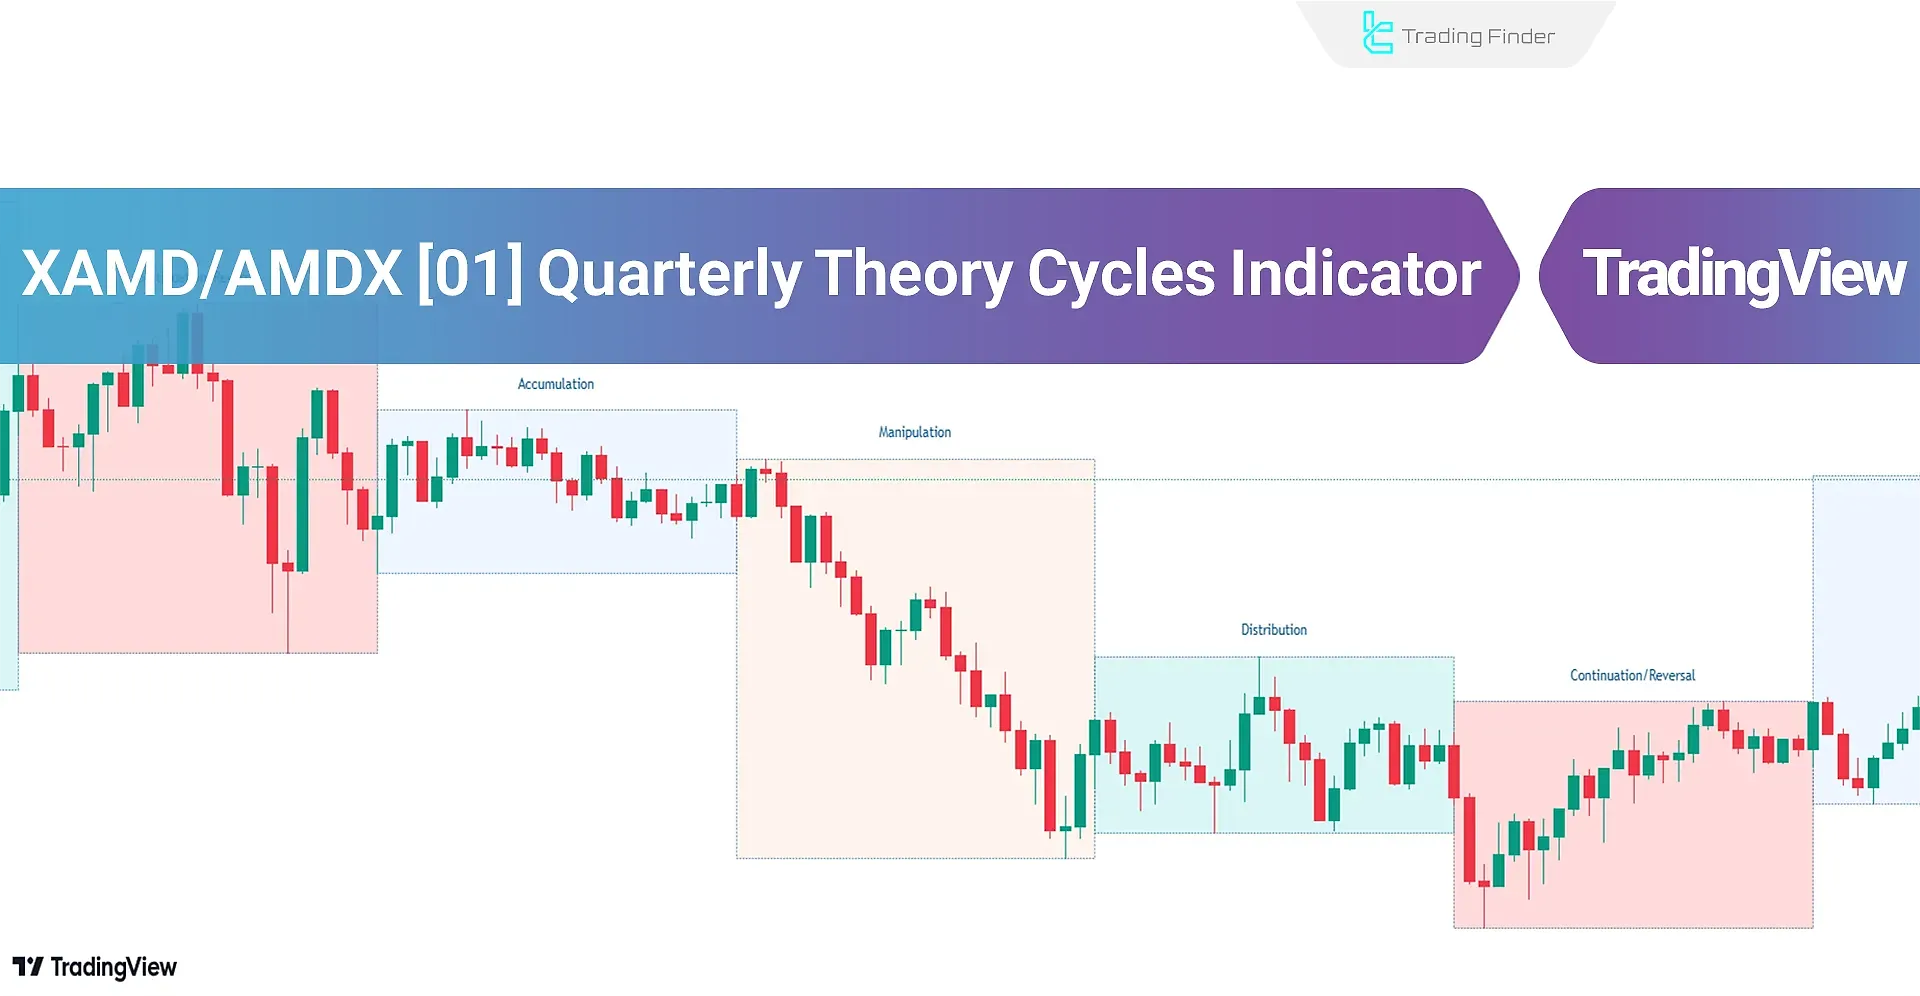
Designed based on Smart Money Concepts (SMC) and ICT trading styles, this liquidity indicator divides trading days into four distinct phases using the Power of 3 strategies approach.
XAMD/AMDX [01] Indicator Specifications
Indicator Categories: | ICT Tradingview Indicators Smart Money Tradingview Indicators Liquidity Tradingview Indicators |
Platforms: | Trading View Indicators |
Trading Skills: | Advanced |
Indicator Types: | Reversal Tradingview Indicators |
Timeframe: | Multi-Timeframe Tradingview Indicators |
Trading Style: | Intraday Tradingview Indicators |
Trading Instruments: | TradingView Indicators in the Forex Market Cryptocurrency Tradingview Indicators Stock Tradingview Indicators Commodity Tradingview Indicators Indices Tradingview Indicators Share Stocks Tradingview Indicators |
Overview of the Indicator
The XAMD/AMDX strategy outlines four market rotation phases as follows:
- Accumulation: The market is usually calm during this phase, and institutional players (Market Makers) accumulate their positions
- Manipulation: Market makers create fakebreakouts in the manipulation phase and trigger stop-loss levels
- Distribution: The dominant trend of the day forms during the distribution phase, characterized by significant and sharp price movements due to large transactions by market makers
- Continuation or Reversal: This phase evaluates the market direction and can signal a price reversal
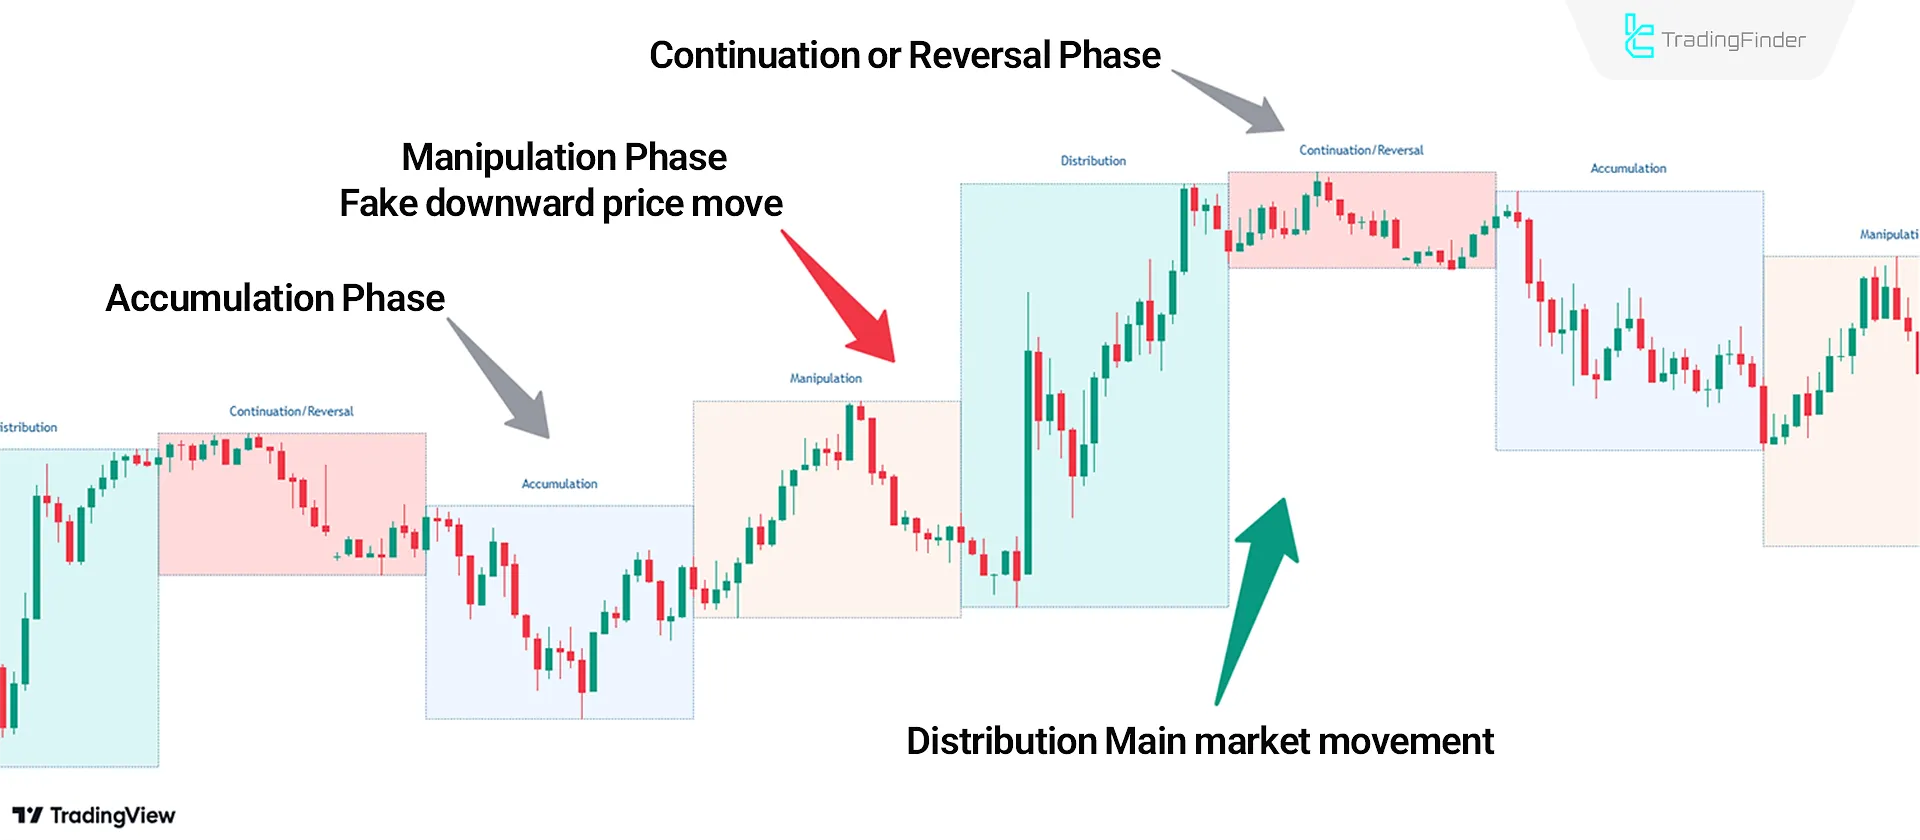
Performance of the Indicator in a Bullish Trend
Based on the chart of the USD/JPY currency pair in the 30-minute timeframe, the trend entered the manipulation phase (Fake Downward Move).
However, as soon as the price entered the distribution phase, it began its main move as an upward trend.
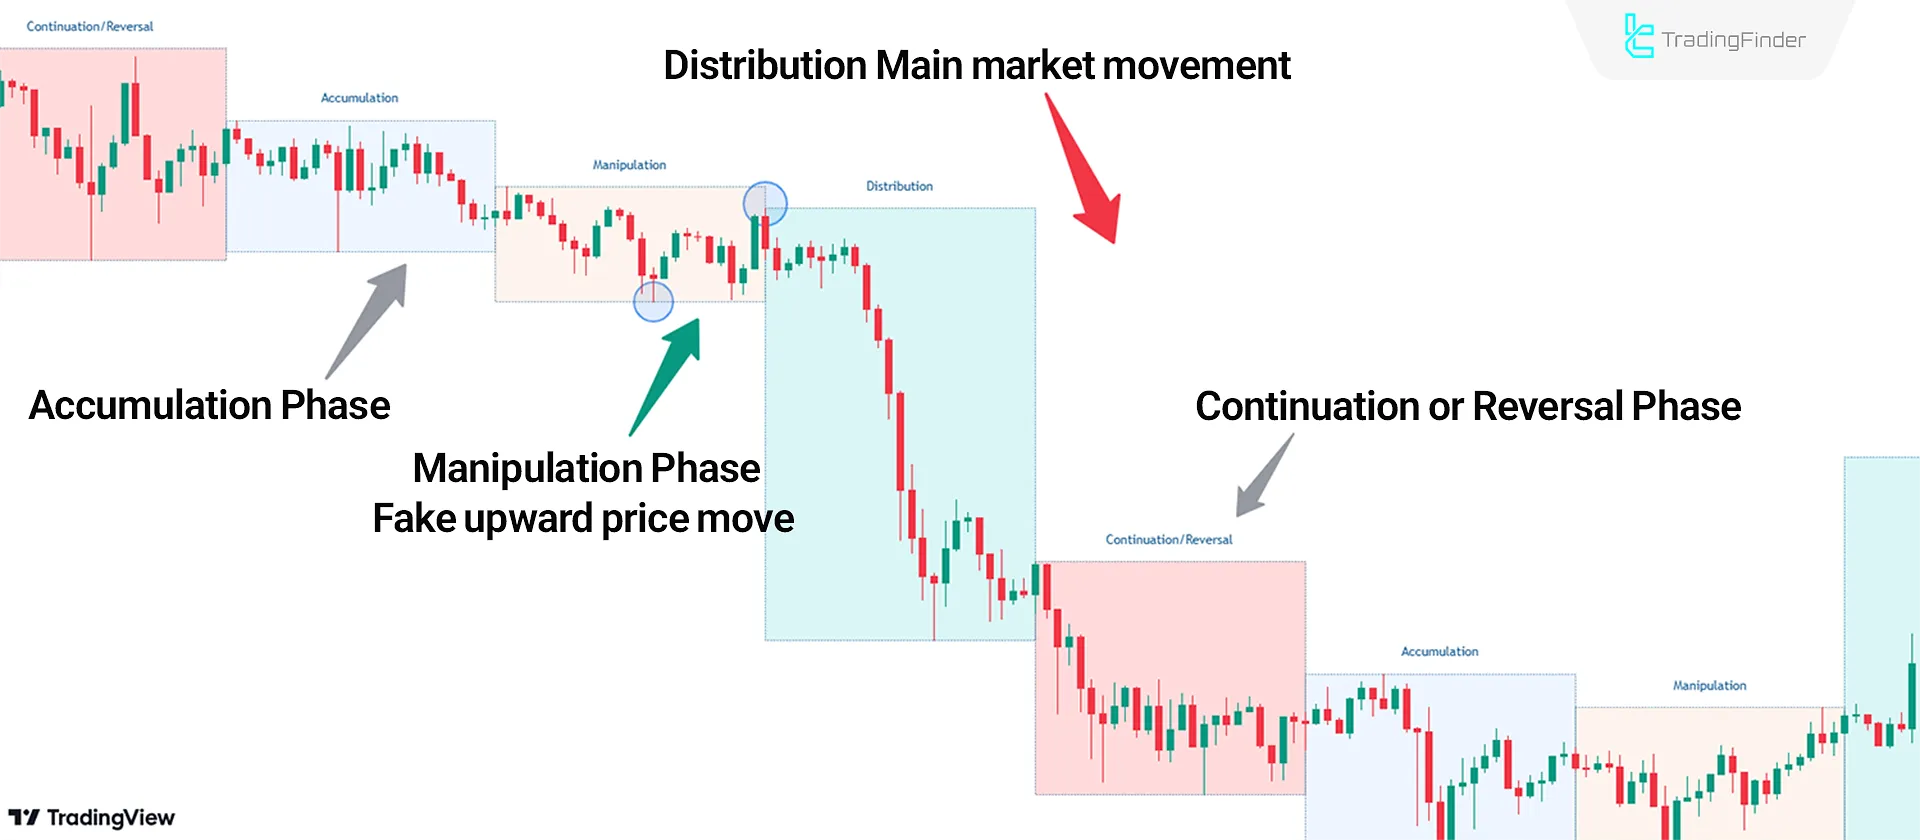
Performance of the Indicator in a Bearish Trend
The ETH cryptocurrency price chart in the 15-minute timeframe exemplifies how the XAMD/AMDX [01] indicator works in a bearish trend.
During the manipulation phase, fake upward moves occur, but as soon as the price enters the distribution phase, the main market move begins, and the trend turns bearish.
Indicator Settings
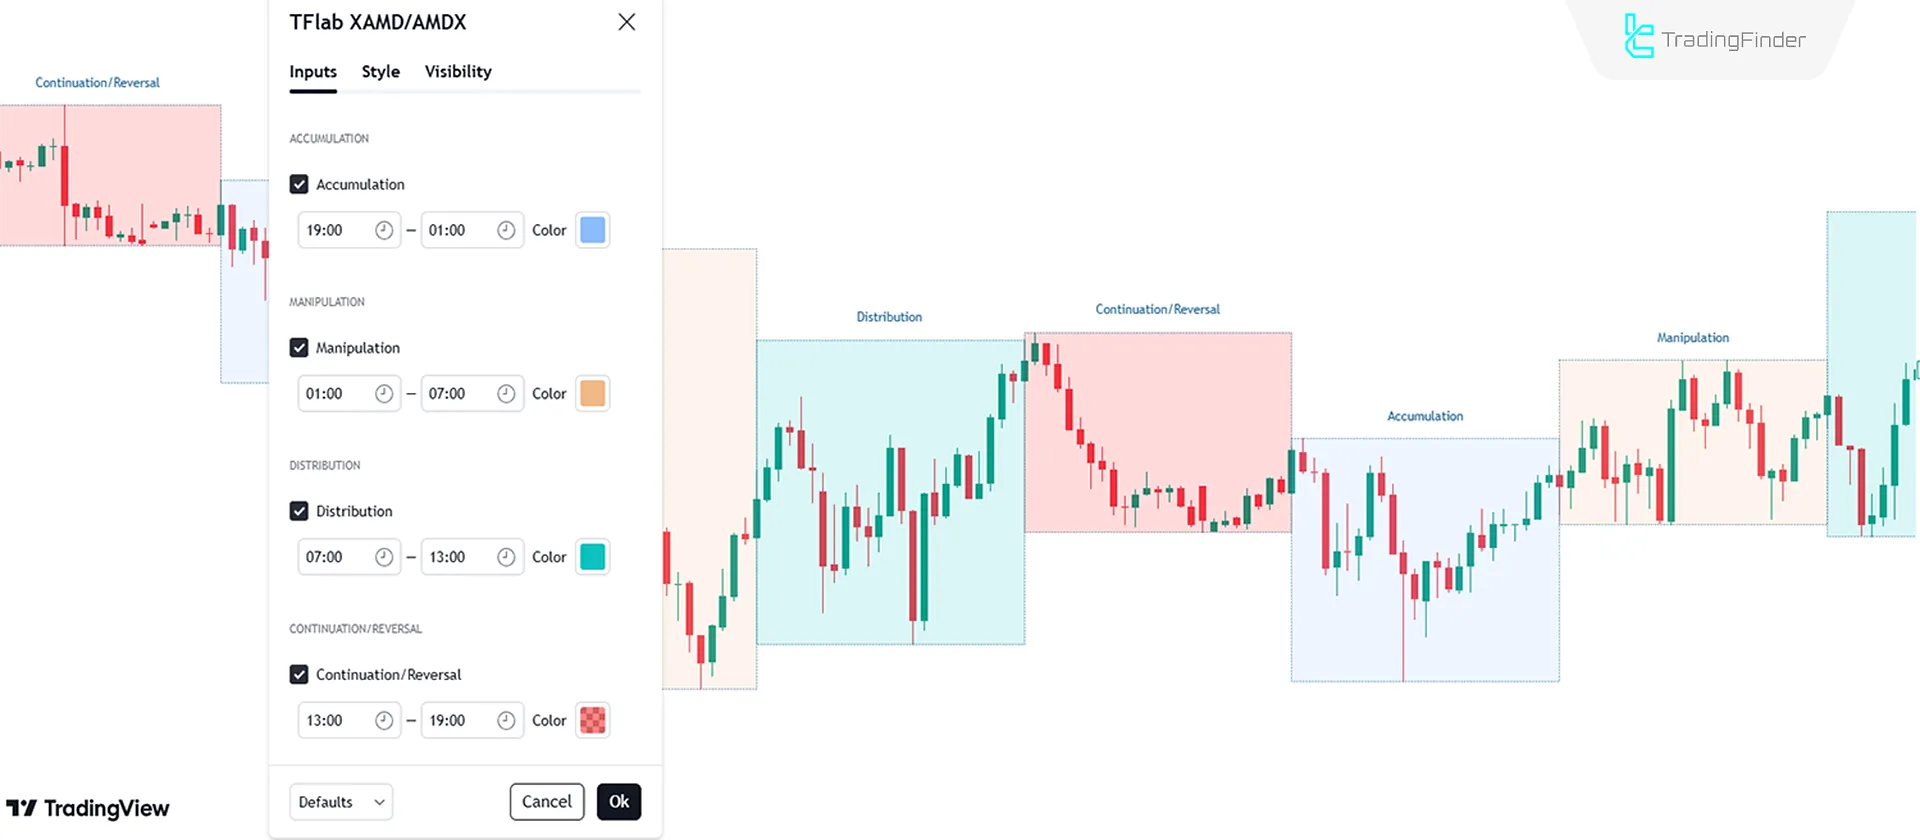
- Accumulation: Settings related to the accumulation phase;
- Manipulation: Settings related to the manipulation phase;
- Distribution: Settings related to the distribution phase;
- Continuation/Reversal: Settings related to the continuation or reversal phase.
Conclusion
TheXAMD/AMDX Quarterly Theory Cycle Indicator divides the daily market movements into four phases.
Each phase exhibits distinct price behavior; analyzing these behaviors makes forecasting future price movements clearer and more precise.
This smart money indicator allows traders to align their strategies with the primary market maker moves.
XAMD/AMDX [01] Quarterly Theory TradingView PDF
XAMD/AMDX [01] Quarterly Theory TradingView PDF
Click to download XAMD/AMDX [01] Quarterly Theory TradingView PDFHow does the "Continuation or Reversal" phase affect the price?
The continuation or reversal phase occurs after the distribution phase, during which the price either continues the previous trend with greater strength or reverses entirely.
Which strategies is this indicator based on?
This indicator is designed based on the Power of 3 strategy and incorporates ICT and Smart Money trading styles.


