The Zigzag Multi Indicator helps traders identify the overall market trend by connecting swing high and low points. These zigzag lines connect pivotal points from high to low and low to high, clearly showing significant price changes.
Using this TradingView Indicator, traders can easily identify classic patterns like head and shoulders, triangles, and Elliott waves on charts, improving technical analysis and making better trading decisions.
Zigzag Multi-Indicator Table
|
Indicator Categories:
|
Pivot Points & Fractals Tradingview Indicators
Elliott Wave Tradingview Indicators
Levels Tradingview Indicators
|
|
Platforms:
|
Trading View Indicators
|
|
Trading Skills:
|
Intermediate
|
|
Indicator Types:
|
Reversal Tradingview Indicators
Lagging Tradingview Indicators
Entry & Exit TradingView Indicators
|
|
Timeframe:
|
Multi-Timeframe Tradingview Indicators
|
|
Trading Style:
|
Intraday Tradingview Indicators
Day Trading Tradingview Indicators
Scalper Tradingview Indicators
|
|
Trading Instruments:
|
TradingView Indicators in the Forex Market
Commodity Tradingview Indicators
Indices Tradingview Indicators
|
Indicator at a Glance
The Multiple Zigzag Indicator helps traders identify Major (main) and Minor pivot points by displaying two zigzag lines on the chart.
Using labels such as LL, LH, HH, and HL, this indicator assists traders in recognizing key points and reversal zones, enabling them to identify the main market trend.
The uptrend in the Indicator

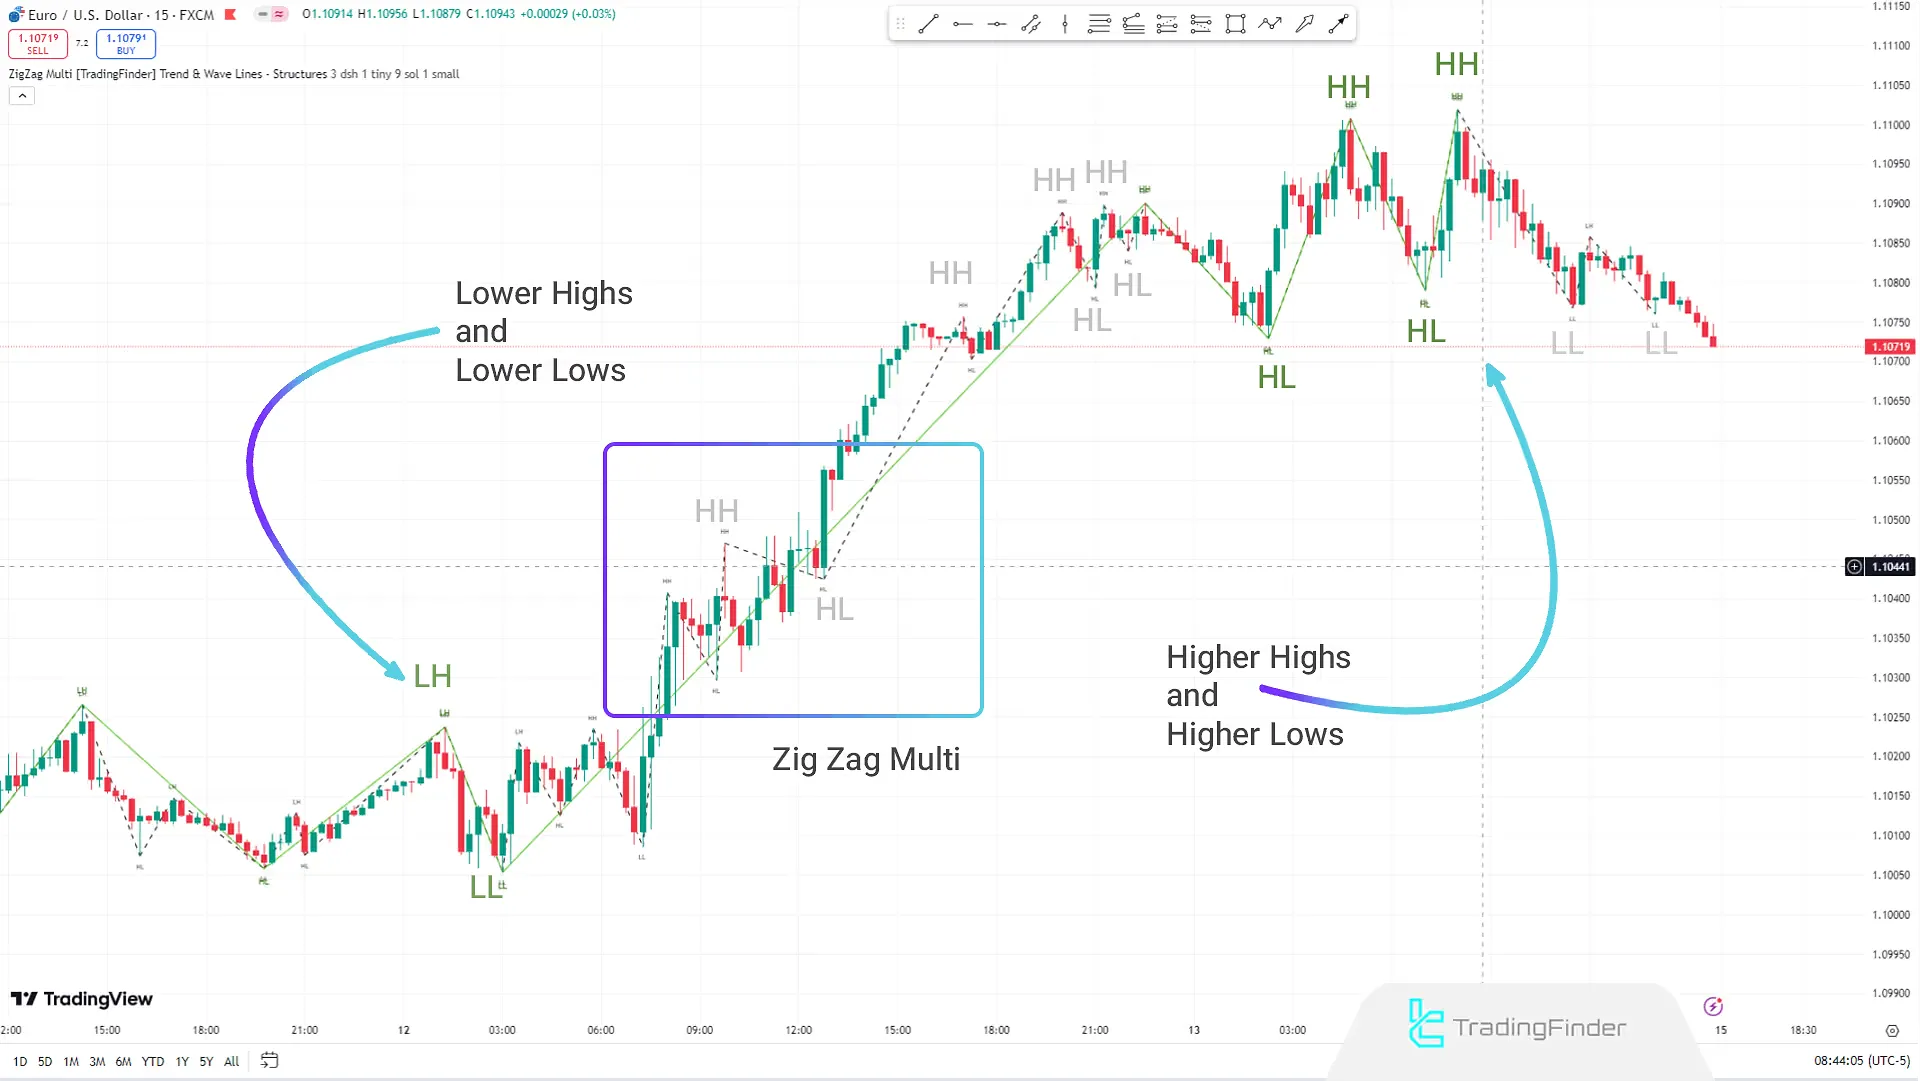
In the 15-minute EUR/USD chart, the Zigzag Indicator clearly shows the market trend by plotting higher highs (HH) and higher lows (HL).
By connecting these swing points, the Indicator displays the path of price changes, allowing traders to easily identify classic patterns and more accurately analyze the market trend.
Additionally, the Zigzag Indicator is useful for Elliott Wave analysis, helping traders better understand price waves and structures and adjust their trading strategies accordingly.
The downtrend in the Indicator

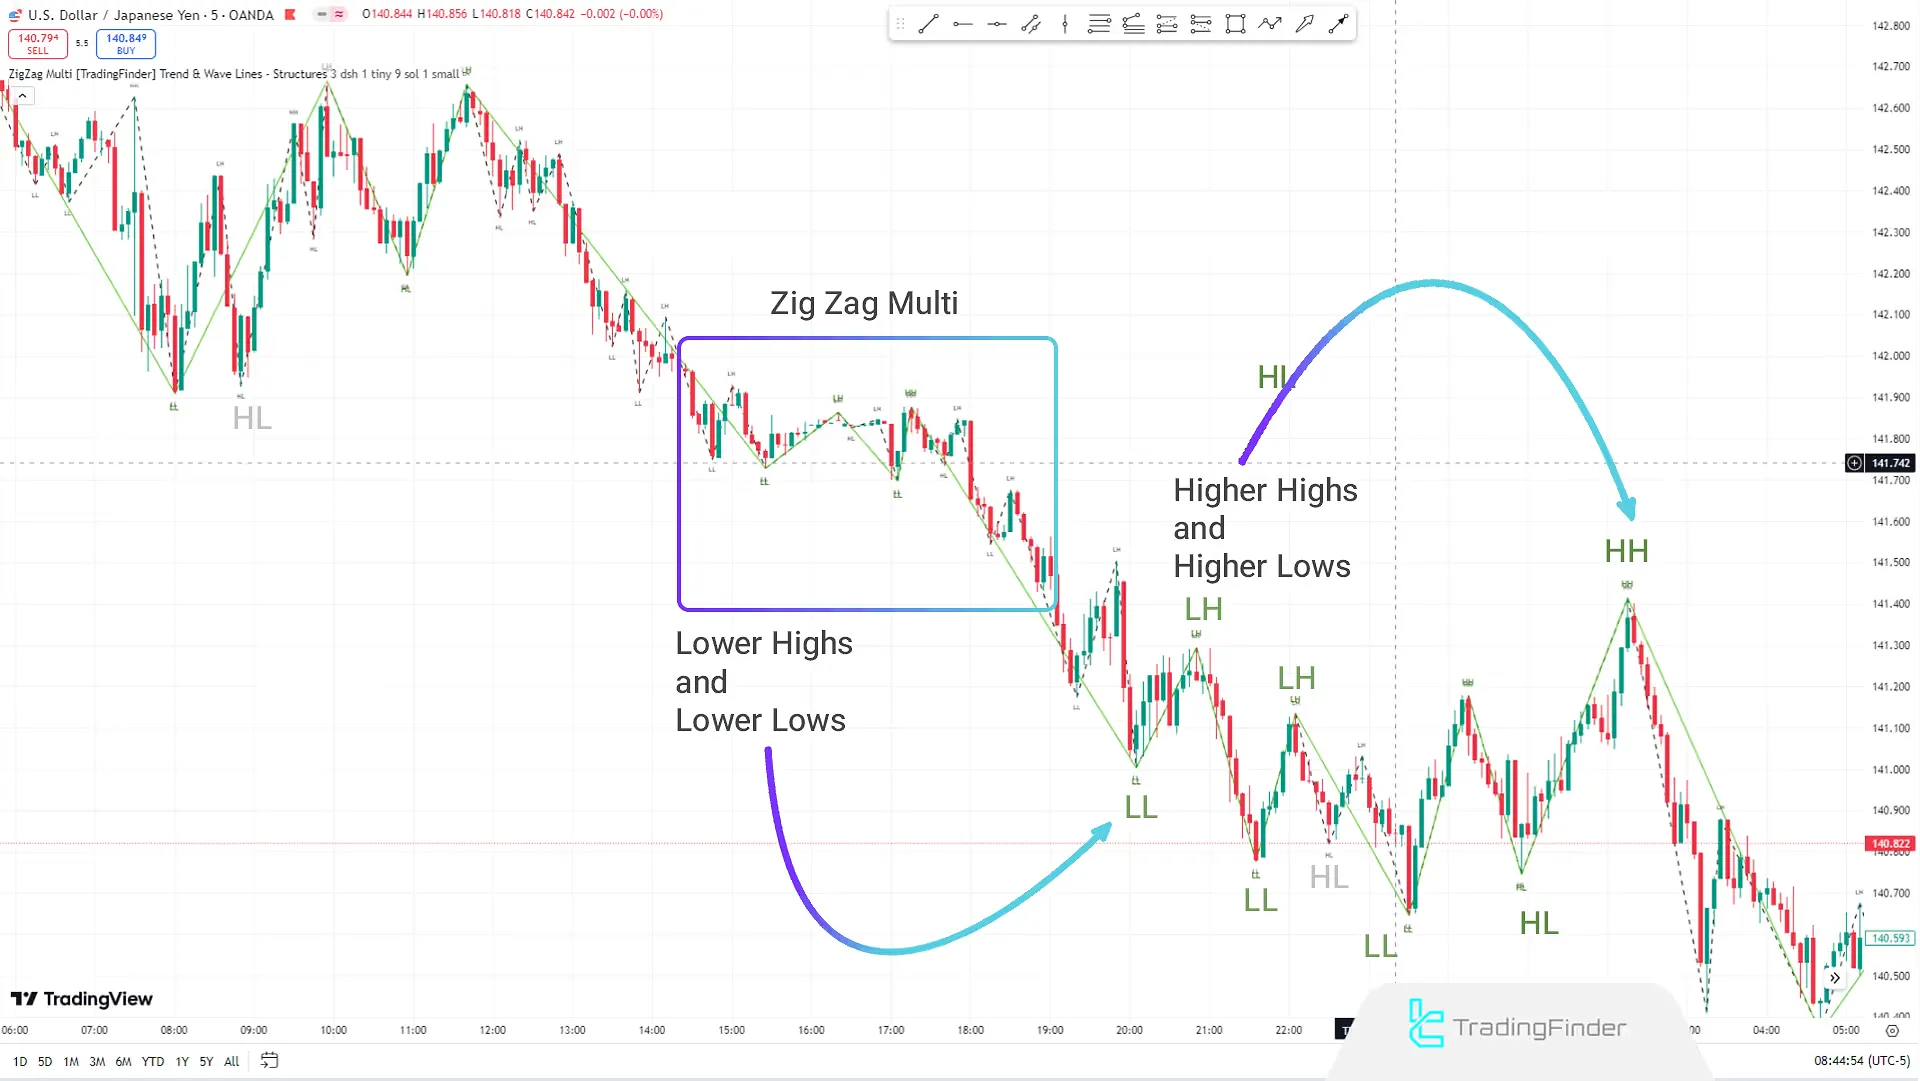
In the 5-minute USD/JPY chart, the Zigzag Indicator shows the market trend by plotting Lower Highs (LH) and Lower Lows (LL).
By identifying these lower high and lower low points, this Indicator indicates the market's downtrend and helps traders understand price changes more precisely.
The Zigzag Indicator simplifies the process of analysis for traders by showing more apparent market swing movements and drawing more precise highs and lows, aiding them in more effectively identifying uptrends and downtrends.
Indicator Settings

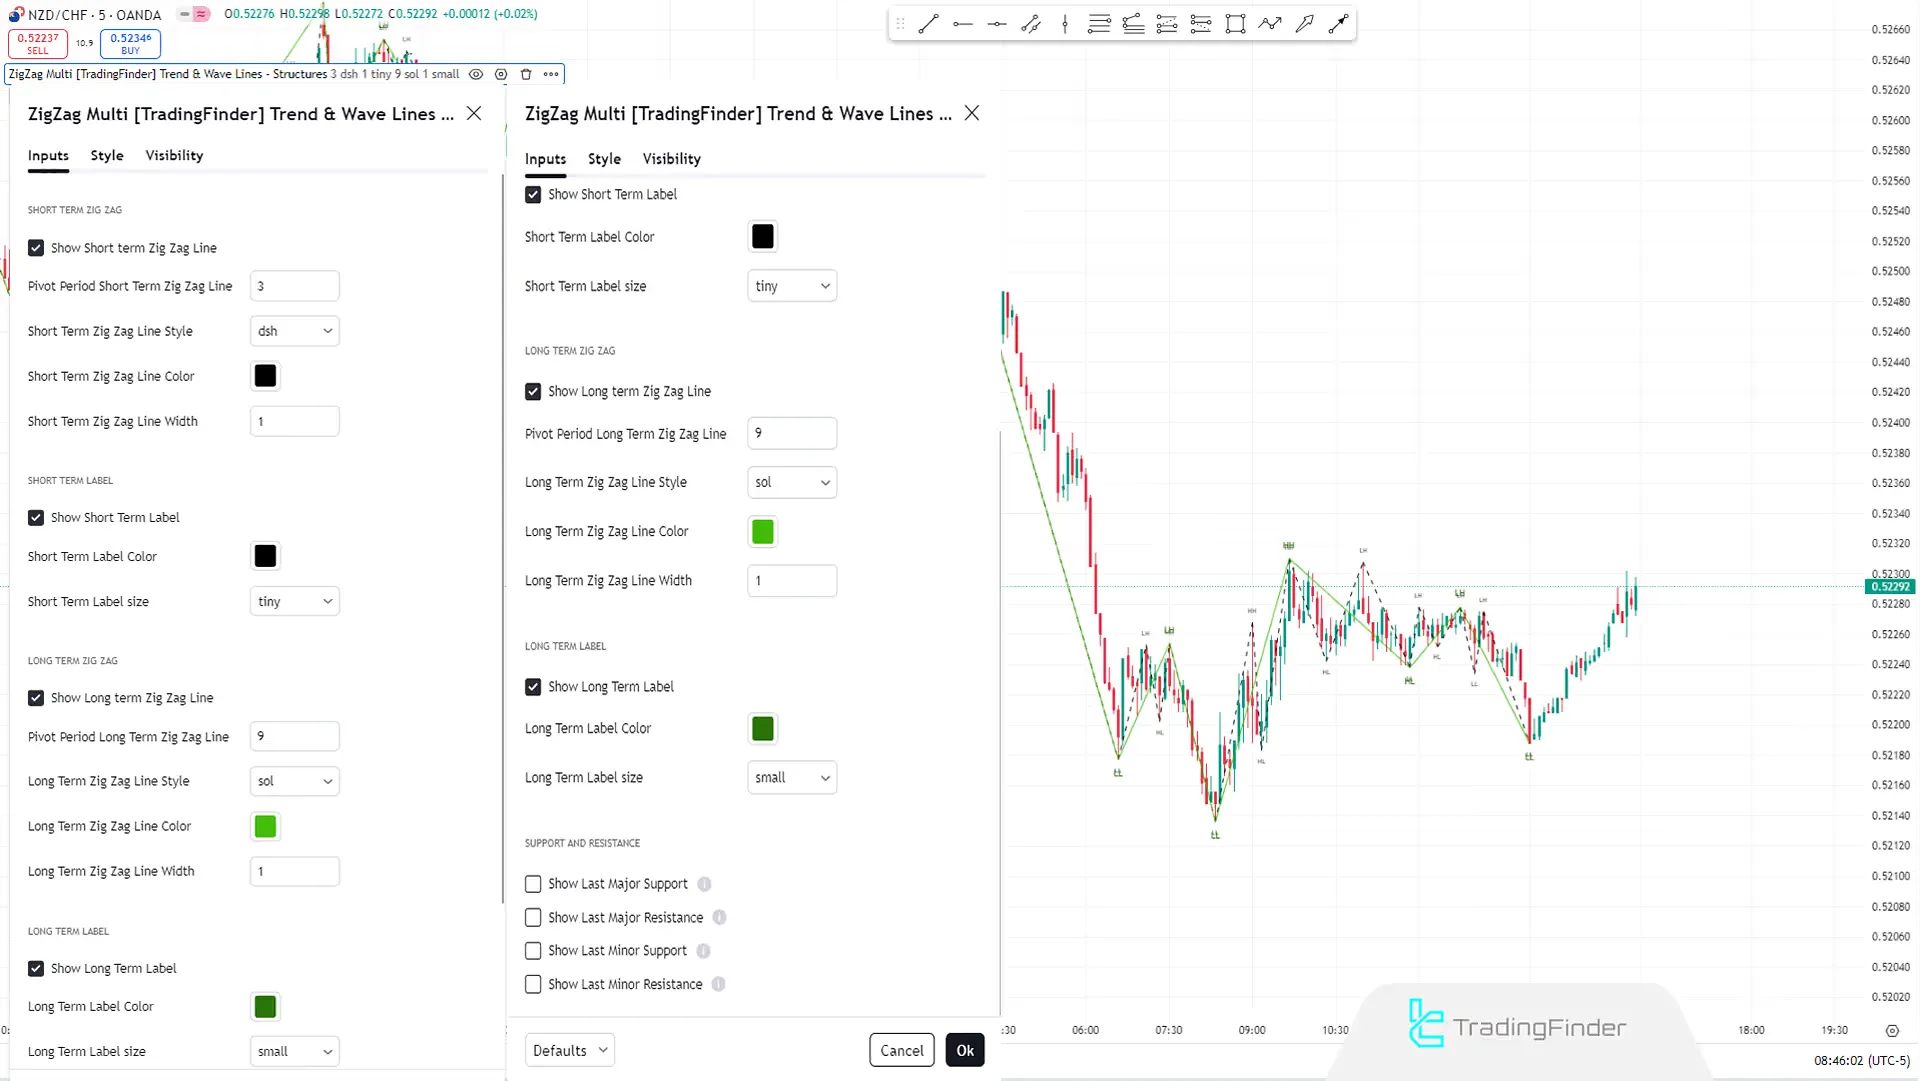
SHORT TERM ZIG ZAG: Short Term Zigzag
- Show Short-term Zig Zag Line: Show/Hide Short-Term Zigzag Line;
- Pivot Period Short Term Zig Zag Line: Pivot Period for Short Term Zigzag Line;
- Short Term Zig Zag Line Style: Style of Short Term Zigzag Line;
- Short-Term Zig Zag Line Color: Color of Short-Term Zigzag Line;
- Short-Term Zig Zag Line Width: Width of Short-Term Zigzag Line.
SHORT TERM LABEL: Short-Term Label
- Show Short-Term Label: Show/Hide Short-Term Label;
- Short-Term Label Color: Color of Short-Term Label;
- Short-Term Label Size: Size of Short-Term Label.
LONG TERM ZIG ZAG: Long Term Zigzag
- Show Long-term Zig Zag Line: Show/Hide Long-Term Zigzag Line;
- Pivot Period Long Term Zig Zag Line: Pivot Period for Long Term Zigzag Line;
- Long Term Zig Zag Line Style: Style of Long Term Zigzag Line;
- Long Term Zig Zag Line Color: Color of Long Term Zigzag Line;
- Long Term Zig Zag Line Width: Width of Long Term Zigzag Line.
LONG TERM LABEL: Long-Term Label
- Show Long-Term Label: Show/Hide Long-Term Label;
- Long-Term Label Color: Color of Long-Term Label;
- Long-Term Label Size: Size of Long-Term Label.
SUPPORT AND RESISTANCE: Support and Resistance
- Show Last Major Support: Show/Hide Last Major Support;
- Show Last Major Resistance: Show/Hide Last Major Resistance;
- Show Last Minor Support: Show/Hide Last Minor Support;
- Show Last Minor Resistance: Show/Hide Last Minor Resistance.
Summary
The Zigzag Multi Indicator (ZigZag Multi) is a valuable and practical tool for traders identifying and determining market trends. Its settings are designed to be easily adjustable for different timeframes, allowing traders to stay informed of market movements.
By displaying significant and minor support and resistance levels, this TradingView Pivot Point and Fractal Indicator helps traders better identify market trends.
Is the Zigzag Multi Indicator suitable for all markets?
The Zigzag Multi Indicator can be used in various markets, including stocks, forex, and cryptocurrencies. However, it is recommended that you test the Indicator's performance in the specific market and asset you intend to analyze.
What is the Zigzag Multi Indicator, and how does it work?
The Zigzag Multi Indicator is a technical analysis tool used to identify market trends and reversal points. It displays the price chart in a zigzag pattern using price highs and lows, helping to identify price fluctuations and key market patterns.