


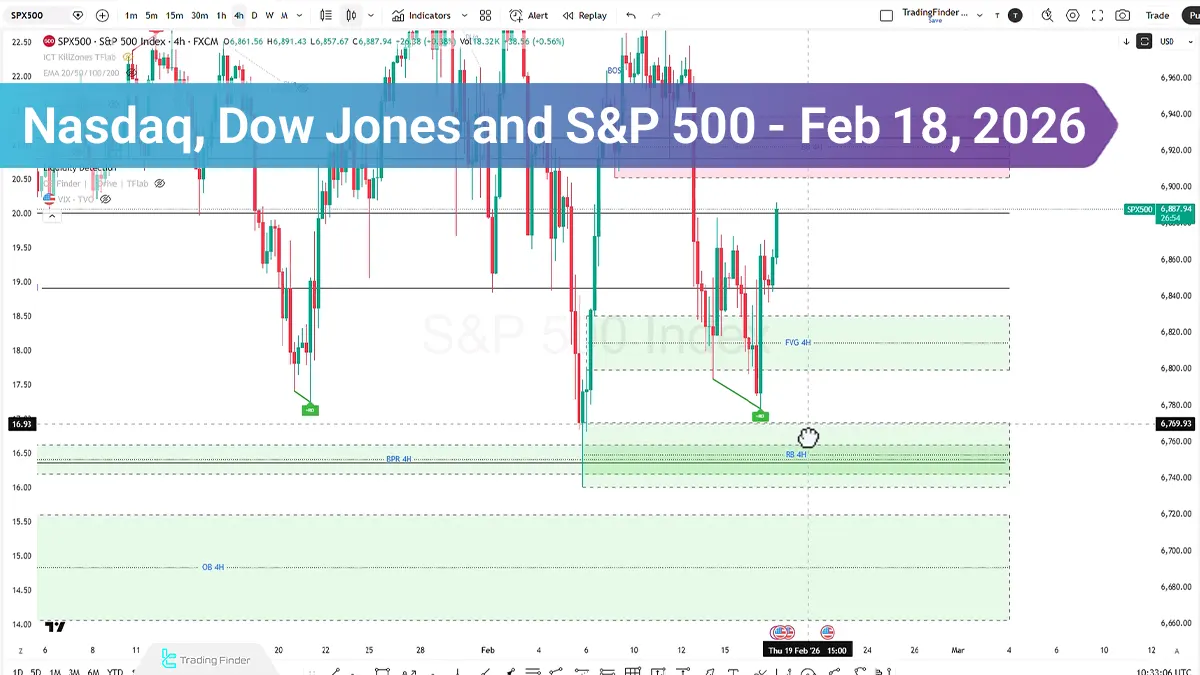
Key Points:
- The S&P 500 index, after collecting Sell Side Liquidity, has maintained a short-term bullish bias; however, negative divergence in the lower timeframe RSI increases the probability of a limited pullback toward the FVG or Breaker Block;
- In the Nasdaq price chart, the 14-day and 42-day RSI are positioned above the 50 level, indicating sustained bullish momentum; however, a structural break on the lower timeframe could mark the beginning of a corrective phase;
- In the Dow Jones chart, a positive reaction to the Rejection Block on the 4-hour timeframe demonstrates the relative dominance of demand;
In today’s trading session, the main U.S. stock market indices exhibited technical behavior based on liquidity grabs and reactions to imbalance zones. In the S&P 500 index, after collecting Sell Side Liquidity, the price close within the prior day’s channel has tilted the short-term bias toward bullishness.
In Nasdaq, positive correlation with the S&P has been maintained; however, intermarket divergences are issuing cautionary signals. On the other hand, the Dow Jones, by forming a Smart Money divergence relative to the other two indices, presents signs of relative structural bullish strength.
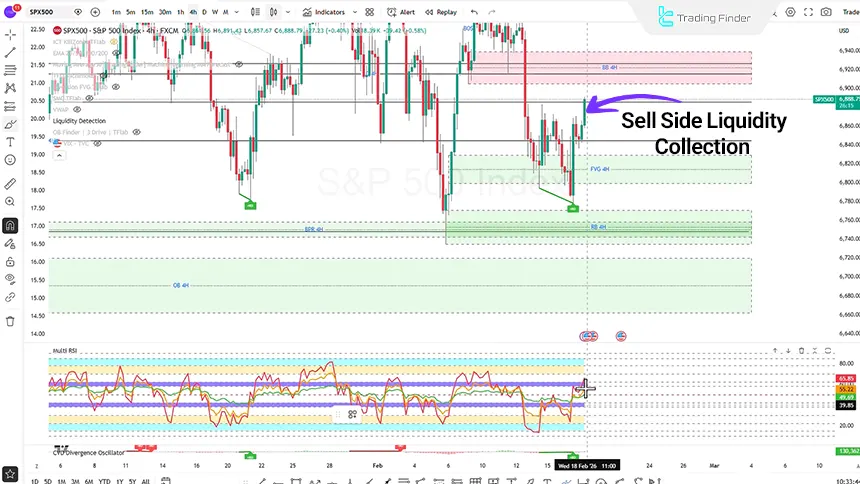
S&P 500 Index Analysis on the 4-Hour Timeframe
In this range, after collecting Sell Side Liquidity, price lacked sufficient momentum to reach the Rejection Block and ultimately moved toward the specified target and Buy Side Liquidity.
The Multi RSI indicator shows:
- The trend remains bullish;
- Entering the high-potential zone at the 78 level and stabilizing above it could confirm the continuation of the bullish trend;
- Entering the overbought zone and forming a Bearish Divergence could signal the end of the bullish trend.
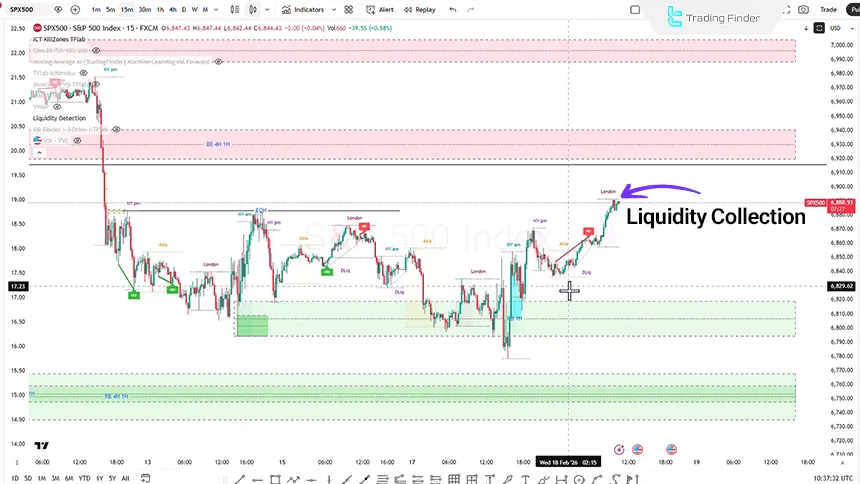
S&P 500 Index Analysis on the 15-Minute Timeframe (15 M)
Using the ICT Killzone indicator, during the New York session, after a Stop Hunt and liquidity collection, price moves upward.
- Negative divergence in the Multi RSI could mark the beginning of a new bearish phase;
- If price enters the FVG or Breaker Block, rejection and targeting of lower levels are likely.
At present, the short-term outlook for S&P and Nasdaq is inclined toward a bearish correction, although the higher-timeframe structure has not yet been fully invalidated.
Nasdaq Index Analysis on the 1-Hour Timeframe
On the 1-hour timeframe, alongside examining the price structure, the Multi Relative Strength Index indicator is positioned in a high-potential zone that may determine the short-term market Momentum direction.
- The 14 period RSI is positioned above the 50 level;
- The 42 period RSI is also stabilized above the 50 level.
The positioning of both periods above the mid-level of 50 indicates the relative dominance of buyers in the current market momentum and, from a structural perspective, reinforces the probability of continued bullish movement.
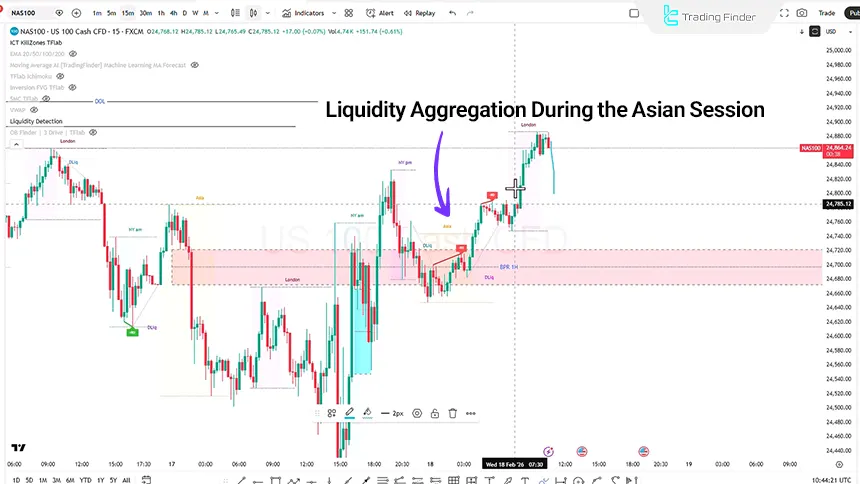
Nasdaq Analysis on the 15-Minute Timeframe (M15)
On the 15-minute timeframe, the price action structure initially enters an accumulation phase during the Asian session, where limited fluctuations, short-term range formation, and the absence of meaningful Displacement are displayed to aggregate liquidity and prepare the market for the primary move.
This behavior typically reflects a balance phase prior to liquidity distribution in one of the primary directions.
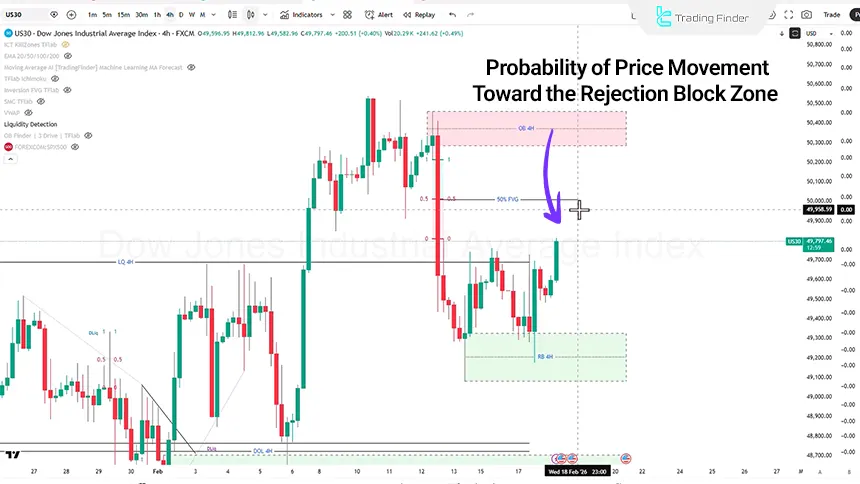
Dow Jones Analysis on the 4-Hour Timeframe (H4)
On the 4-hour timeframe, after entering the 50% Rejection Block zone, price reacted positively and registered a bullish rebound from this area.
Along the path ahead, the first resistance zone facing price is considered the 50% Fair Value Gap at the 5000 level. Price behavior at this level is of high importance from the perspective of market structure and candle quality.
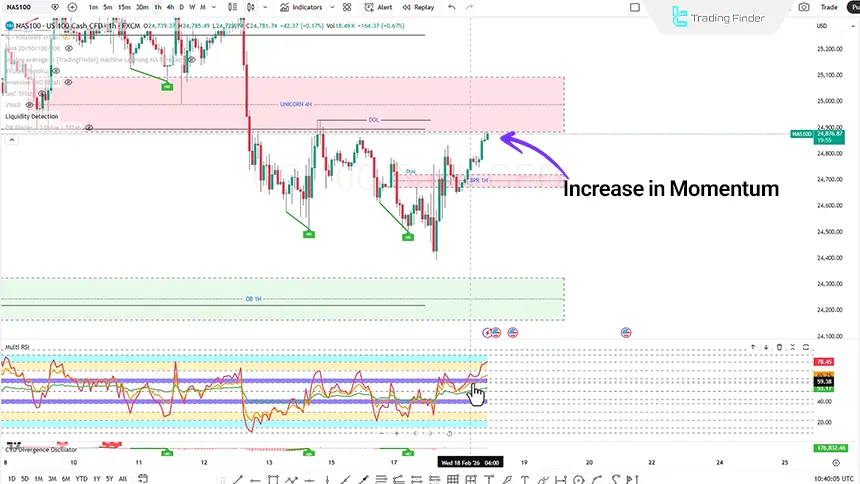
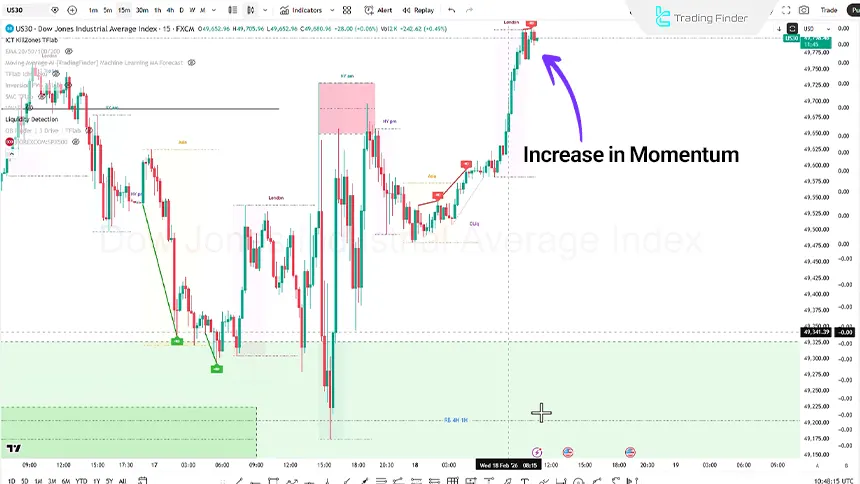
Dow Jones Index Analysis on the 15-Minute Timeframe (M15)
On the short-term timeframe, a sharp bullish movement accompanied by increasing momentum is observed in the price structure, indicating the inflow of buy orders and the dominance of demand over supply at the current stage.
The steep slope of the move and price distancing from equilibrium zones indicate an Imbalance phase in the market.
Along this path, the first key level facing price is considered the Order Block zone at the 49472 level.
This area may act as potential supply and serve as a point for evaluating buyer strength. The way price behaves and the quality of candles in this zone will play a decisive role in the continuation of the move.
Conclusion
The Nasdaq, Dow Jones, and S&P500 indices remain within a medium-term bullish framework; however, signs of declining momentum and intermarket divergences are visible. Price behavior in FVG zones, Order Blocks, and reactions to Buy Side and Sell Side Liquidity will determine the short-term direction of the indices.


