


Key Points:
- Ethereum and BNB are under selling pressure, with bearish momentum shaping the dominant market structure.
- In Ethereum, the breakdown of multiple order blocks combined with RSI positioning in a high-potential bearish zone increases the probability of further decline toward the weekly Fair Value Gap (FVG).
- Ethereum’s reaction to key levels such as $2,250 and $2,346 defines the boundary between continuation of the bearish trend and a short-term market phase shift.
- After entering a bullish order block, BNB is facing weakening momentum and bearish RSI conditions, while failure to reclaim the $801.45 FVG level may intensify downside pressure;
- Until key levels are decisively broken across both assets, market focus remains on liquidity collection and the continuation of bearish pressure.
On February 1, 2026, Ethereum and BNB were influenced by sustained selling pressure and bearish momentum, with price behavior around key zones determining the path of active trading scenarios.
Price reactions to order blocks, Relative Strength Index conditions, and candle closing behavior play a central role in defining trend continuation. Overall market structure remains bearish, and bullish scenarios gain validity only if specific momentum and structural conditions are met.
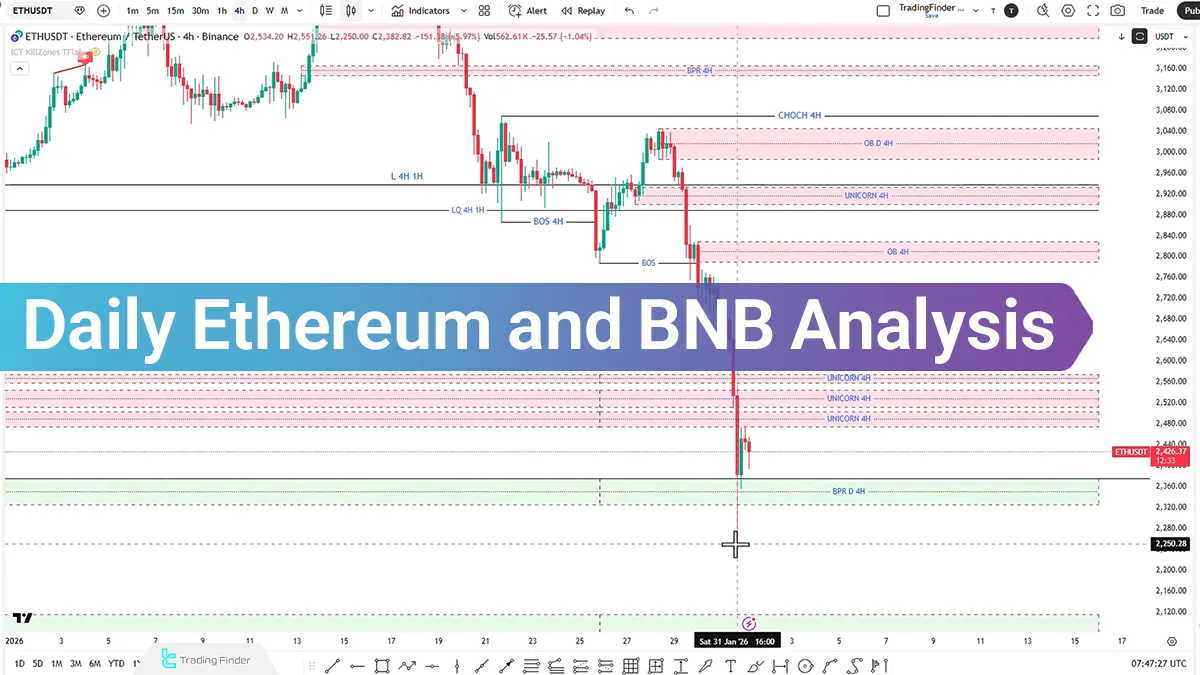
Ethereum (ETH) Analysis on the 4-Hour Timeframe (H4)
On the 4-hour timeframe, the Ethereum price is moving lower with bearish displacement, resulting in the breakdown of three separate order block zones across different sections of the chart.
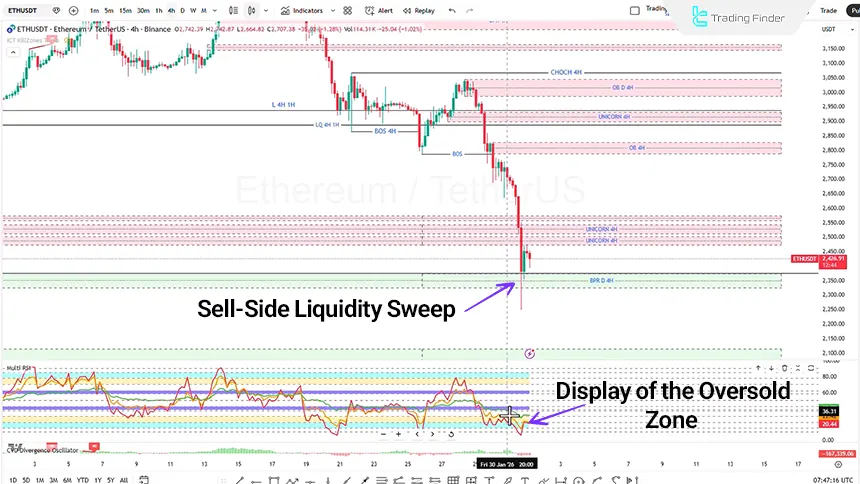
Price ultimately pauses within the Daily BPR zone on the 4-hour timeframe. Analyzing the RSI indicators shows that the price is positioned in a high-potential bearish zone, confirming the continuation of selling pressure.
If downside momentum increases and price closes below the $2,250 level, entry into the weekly Fair Value Gap becomes likely. This zone, ranging from $2,180 to $1,824, may provide the foundation for a potential bullish reaction.
Conversely, if bearish momentum weakens, the formation of a lower high within the candle shadow, combined with sell-side liquidity collection and a close within the shadow, may activate the Ryan Soldier Strategy structure.
This setup enables evaluation of long positions as price targets for buy-side liquidity.
Additionally, a confirmed break above the $2,346 level would trigger a Change of Character, shifting the market phase from bearish to bullish.
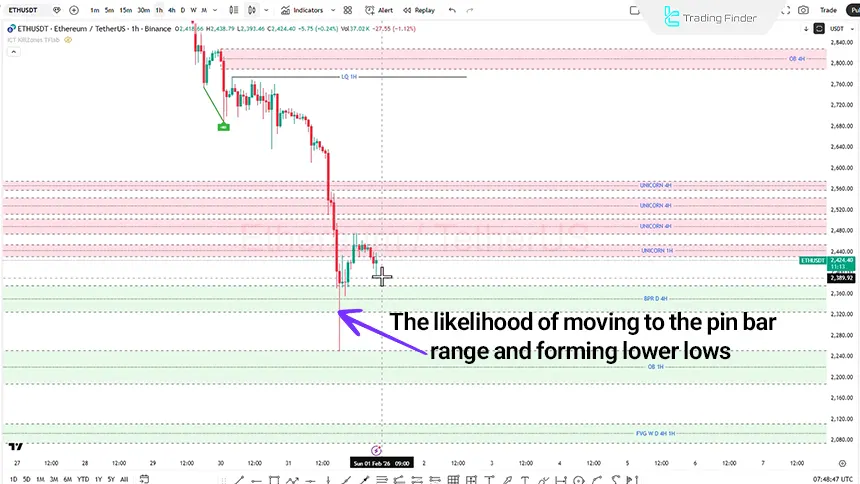
ETH Analysis on the 1-Hour Timeframe (H1)
On the 1-hour timeframe, Ethereum shows weakness in the bullish structure, with insufficient strength to continue higher. If a lower low forms within the Pin Bar candle zone alongside signs of bearish exhaustion, Trading Strategy No. 2 becomes active.
In this scenario, the stop loss is placed behind the Pin Bar swing at the $2,250 level or behind the order block at $2,190. Within this structure, price may continue higher while collecting buy-side liquidity, with upside targets extending toward the $2,787 level.
However, if bearish momentum persists and price closes below the order block at $2,179, downside targeting toward lower levels becomes active.
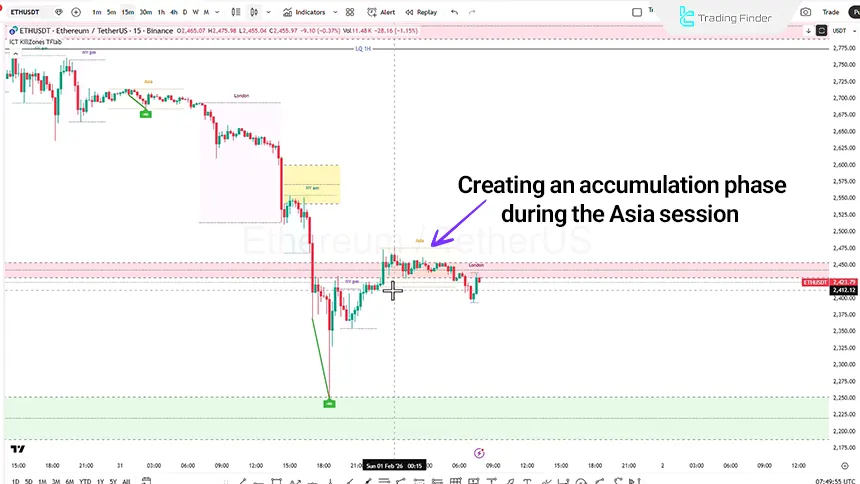
Ethereum Analysis on the 15-Minute Timeframe (M15)
On the 15-minute timeframe, Ethereum forms an Accumulation phase during the Asian session. During the London session, the potential development of a Manipulation move accompanied by sell-side liquidity collection is observed. If these conditions are fulfilled, the market may transition into a Distribution phase.
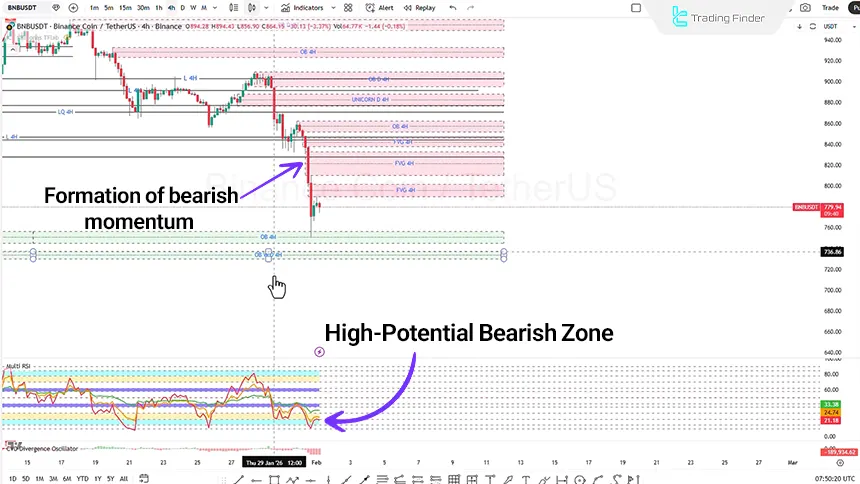
Binance Coin (BNB) Analysis on the 4-Hour Timeframe (H4)
On the 4-hour timeframe, BNB price is moving with bearish momentum and, following a structure break on the 1-hour timeframe, has entered a bullish order block zone. Price stalling within this zone coincides with RSI positioning in a high-potential bearish area, reinforcing the likelihood of continued downside movement.
If price fails to break above the $801.45 Fair Value Gap, continuation toward the $737.26 level becomes probable. Price reaction to the weekly order block remains a critical factor in determining the next phase of market direction.
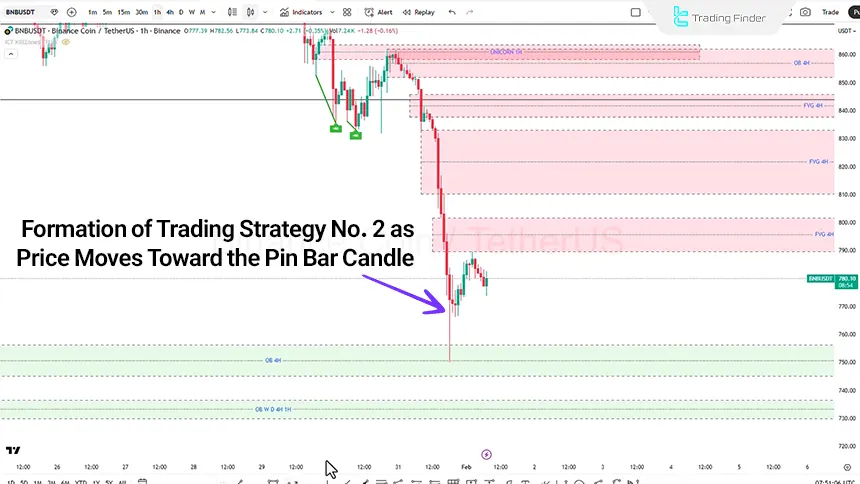
BNBUSDT Analysis on the 1-Hour Timeframe (H1)
On the 1-hour timeframe, BNB market structure shows a tendency toward consolidation. If price moves lower and forms a lower low within the Pin Bar candle, Trading Strategy No. 2 becomes active.
In this scenario, the stop loss is placed behind the swing low at $775 or behind the order block at $744.43. Additionally, if the Fair Value Gap becomes active, the $810.22 level is considered a potential upside target.
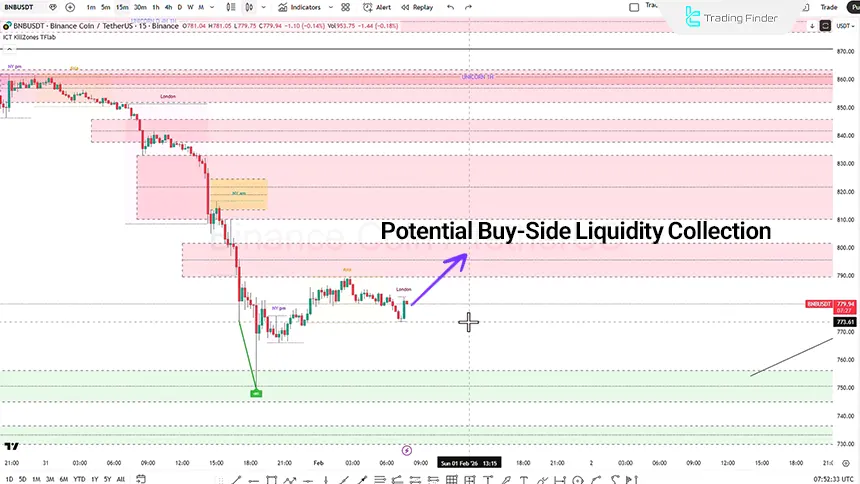
BNB Analysis on the 15-Minute Timeframe (M15)
On the 15-minute timeframe, BNB price action during the Asian session remains in consolidation. If price moves lower during the London session and sell-side liquidity is collected, the probability of a directional move emerging during the New York session increases.
Conversely, an upside move during the London session, accompanied by buy-side liquidity collection signals entry into the Fair Value Gap zone, which reflects continuation of the bearish trend and downside targeting.
Conclusion
Price behavior of Ethereum and BNB on February 1, 2026, indicates thatthe overall market structure remains bearish. Price reactions to order blocks, Fair Value Gap zones, and Relative Strength Index conditions continue to define active trading scenarios.
Until a confirmed break of key levels occurs, market focus remains on liquidity management and the persistence of downside pressure.


