


Key Points:
- Global gold is currently in a consolidation phase, and the inability to break out of the range indicates a weakening of short-term bullish momentum;
- On the 4-hour timeframe, a reaction to the rejection block zone could serve as a potential market turning point; additionally, a break of the bearish structure in this area would signal continuation to the upside;
- On the 1-hour timeframe, price is moving within an ascending channel; a corrective scenario toward the order block or lower liquidity zones, alongside the possibility of a bullish Liquidity Sweep, is under consideration;
- Price behavior during the London and New York sessions will be decisive; the manner of liquidity collection may either trigger bearish distribution or support continuation of the upward move.
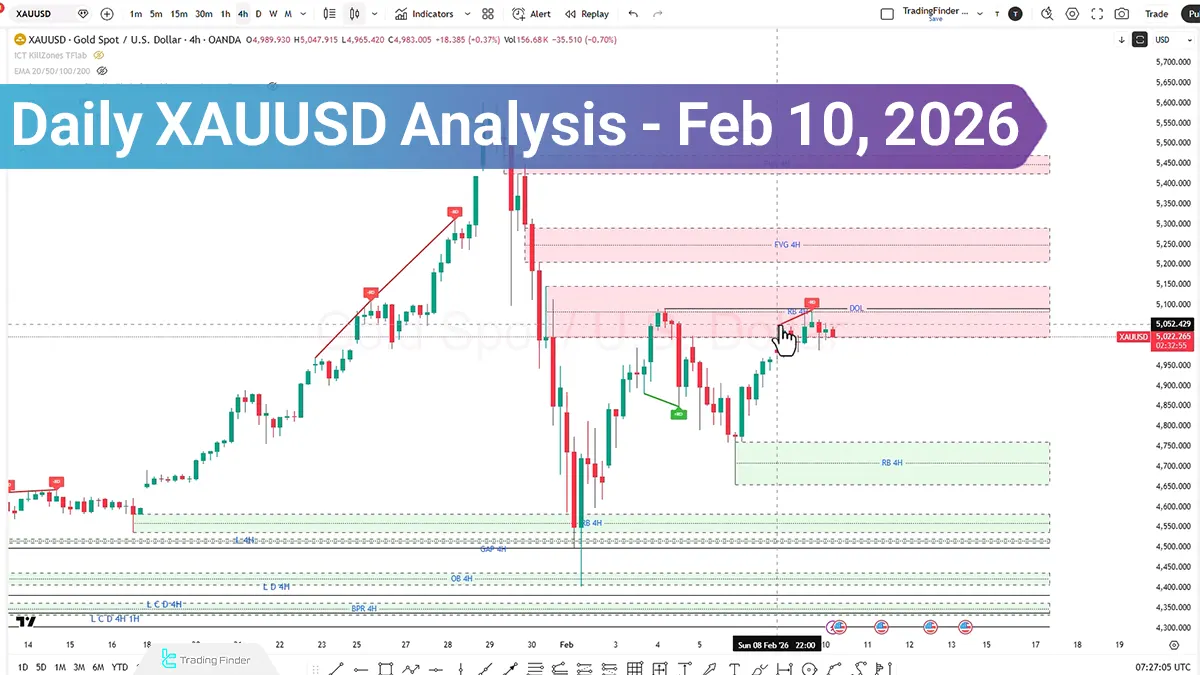
During yesterday’s trading session, gold price entered a consolidation phase and failed to register a candle close outside the range boundaries.
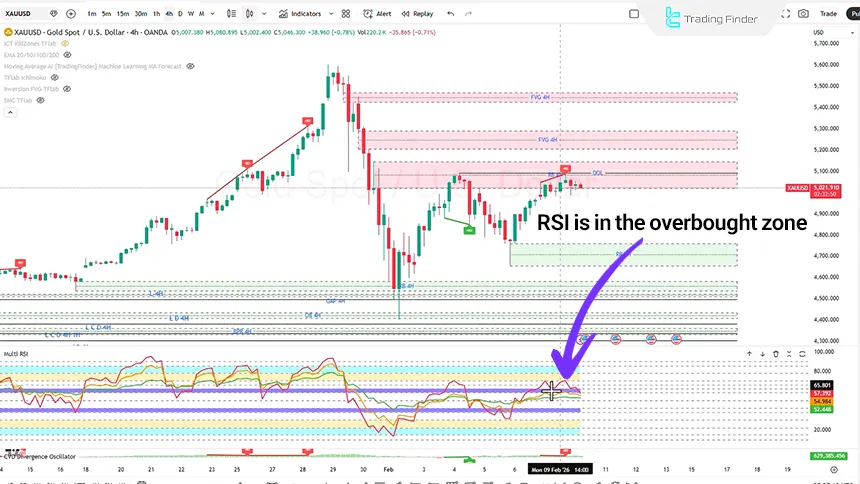
Meanwhile, the observation of negative divergence in the CVD indicator and the Relative Strength Index being positioned in the overbought zone indicate that bullish momentum has weakened and the ability to continue a strong move toward higher levels has diminished.
Additionally, the probability of a short-term bearish correction aimed at collecting sell-side liquidity is however, the broader market structure still maintains a bullish nature.
Gold Analysis on the 4-Hour Timeframe (H4)
On the 4-hour timeframe, price fluctuated within a consolidation range over the past day and failed to record a valid close either above the range high or below the range low.
In this process, buy-side liquidity was activated; however, the continuation of the bullish move was accompanied by weakness. Signs of short-term trend weakening include:
- Identification of negative divergence in the CVD indicator;
- Presence of the Relative Strength Index in the overbought zone;
- A decrease in the upward slope of price and a decline in momentum.
This set of data strengthens the likelihood of a short-term bearish correction; a correction that could be carried out with the objective of collecting sell-side liquidity.Furthermore, if a corrective move forms, price reaction to the rejection block zone will be of high importance.
If weakness in the continuation of the bearish move and a structure break occur in these areas, a bullish signal will be issued.
XAUUSD Analysis on the 1-Hour Timeframe (H1)
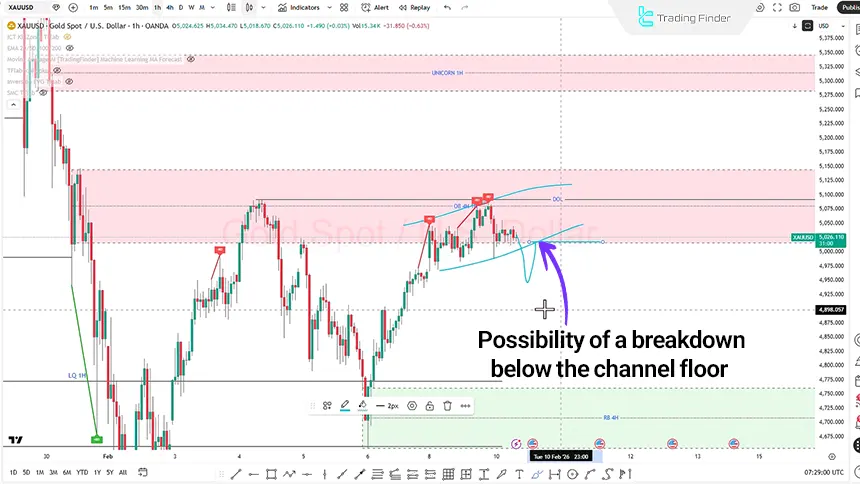
On the 1-hour timeframe, price is moving within an ascending channel.
Bearish Scenario:
- The possibility of entering short positions targeting the order block zone or lower support areas;
- Formation of a market structure shift within the range or buy-side liquidity.
Bullish Scenario:
- Price moves upward and activates buy-side liquidity;
- After a Liquidity Sweep, price closes again within the consolidation range.
XAUUSD Analysis on the 15-Minute Timeframe (M15)
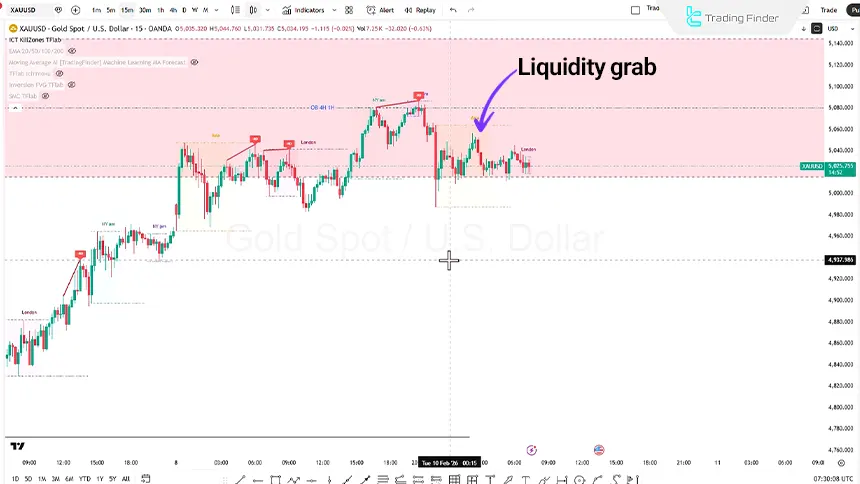
On the 15-minute timeframe, trading session zones are analyzed using the Kill Zone indicator.
During the Asian session and simultaneously with the opening of the Tokyo market, price initially faces selling pressure; however, this pressure is not sustained, and the market gradually enters a consolidation phase.
This price behavior can be considered an accumulation phase; a stage that is usually accompanied by reduced volatility and preparation for the next move.
Subsequently, with the transition into the London and New York sessions, two behavioral scenarios can be envisaged.
- Scenario One: If during the London session price moves downward and collects sell-side liquidity, this action could pave the way for a bullish distribution move during the New York session;
- Scenario Two: If during the London session buy-side liquidity is activated first and then price once again records a candle close within the Asian session range, the probability of the market entering a bearish distribution phase during the New York session will increase.
Conclusion
The short-term structure of gold presents signs of weakening bullish momentum through negative divergence in CVD and overbought conditions in RSI, which increases the probability of a short-term correction.
However, within the broader framework, the market structure remains bullish, and fundamental factors continue to support the prevailing trend. Price reaction to key zones and the manner of liquidity management during trading sessions will determine the dominant short-term scenario.


