


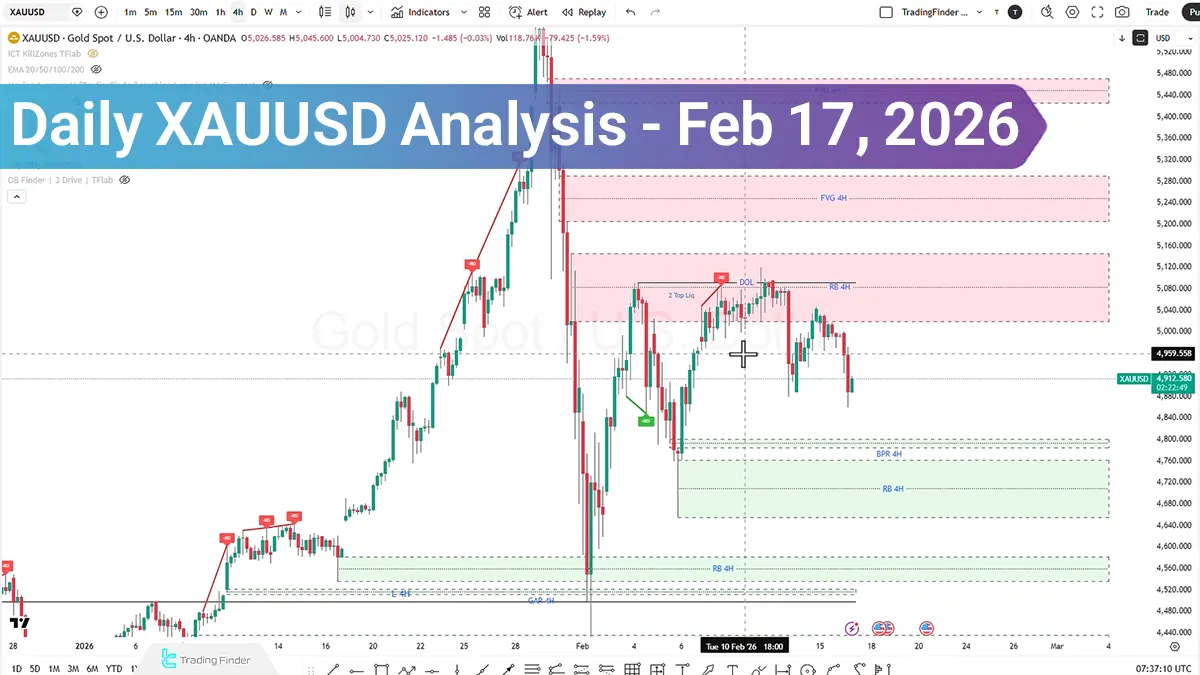
The following scenarios illustrate the market’s next move:
Key Points:
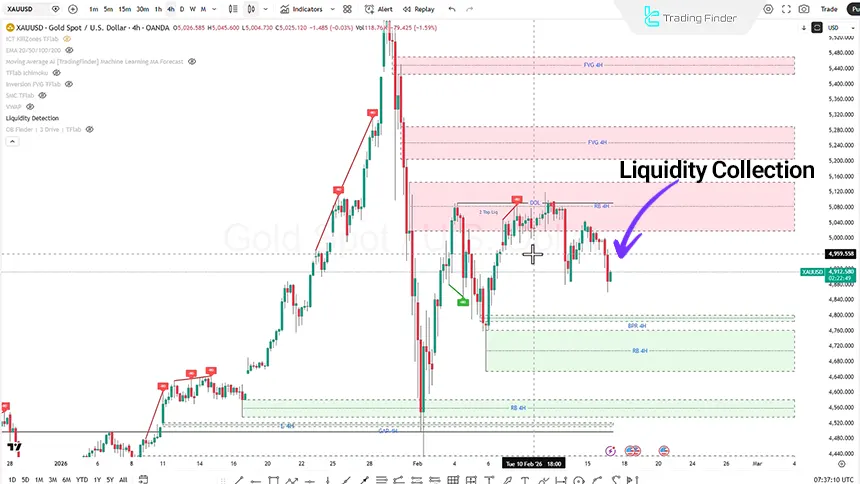
- Global gold spot, after collecting Sell Side Liquidity, has entered a pullback phase, placing the market in a momentum assessment stage;
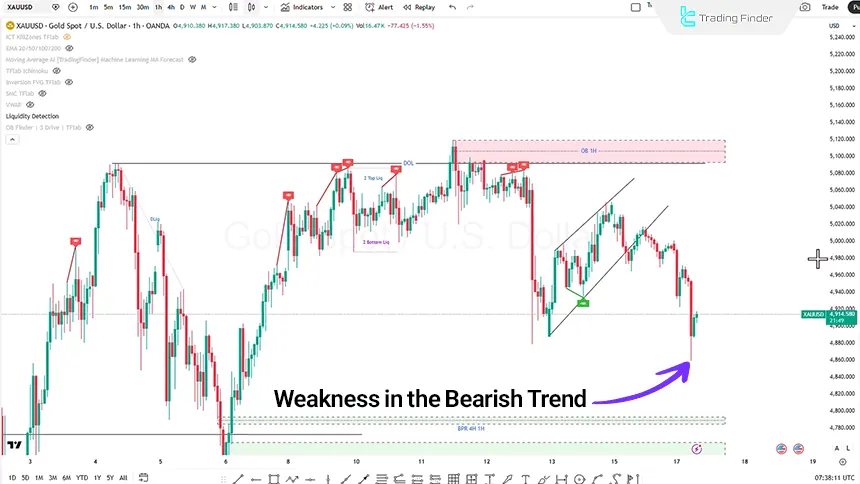
- In the 4-hour time frame, entry into the BPR or Rejection Block zone could serve as a potential bullish reversal area if seller weakness is observed;
- In the 1-hour time frame, the $4936 to $4965 range is a key reaction zone; a negative reaction to this level could trigger continuation of the decline;
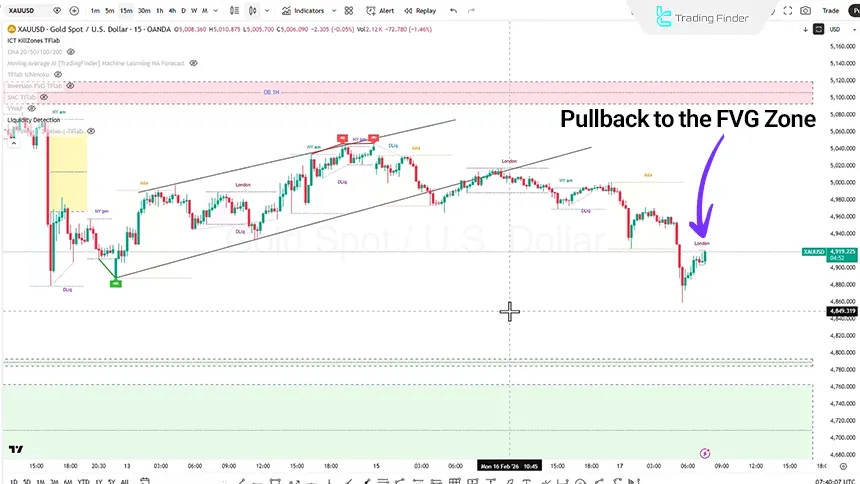
- In the 15-minute time frame, the accumulation structure and pullback to the Value Gap indicate that the next move depends on price behavior during the London session and the absorption of Buy Side Liquidity;
- The dominant short-term scenario is inclined toward buying on pullbacks, provided that a Market Structure Shift is confirmed and bearish momentum weakens.
During the previous trading session, simultaneous with the closure of the United States, Canada, and China markets, gold experienced a noticeable decline in liquidity and limited volatility.
With the start of Tuesday’s trading, selling pressure increased, and the price, while rebalancing the price gap, proceeded to collect sell-side liquidity.
The market is currently in a pullback phase, and upcoming scenarios can be evaluated based on price reactions to key zones and structural behavior in lower time frames.
Gold Analysis on the 4-Hour Time Frame (H4)
On the 4-hour time frame, after the initial selling pressure, price has rebalanced the gap and absorbed sell-side liquidity.
- Scenario One: If renewed supply emerges, there is potential for price to move toward lower levels and enter the BPR or Rejection Block In this case, price reaction and identification of weakness in the bearish trend could provide grounds for entering long positions;
- Scenario Two: If the current correction proves short-term and price re-enters the range, long positions can be defined based on a market-structure-driven trading strategy.
XAUUSD Analysis on the 1-Hour Timeframe (H1)
On the 1-hour time frame, price faced selling pressure after pulling back to the ascending trendline and entered a bearish phase. Subsequently, the market entered the Order Block zone and, after executing a stop hunt, is once again undergoing a bullish pullback.
Additionally, the $4936 to $4965 range is considered an important reaction zone, and in case of a negative reaction to this range, the continuation of the bearish trend is possible. At present, as long as a bearish structural shift is not firmly confirmed, focusing on identifying buying opportunities during pullbacks is assessed as more reasonable.
XAUUSD Analysis on the 15-Minute Time Frame (M15)
On the 15-minute time frame, using the Kill Zone indicator and trading sessions, signs of an accumulation phase have been observed.
After a downward move, price:
- Executed a pullback to the FVG zone;
- Then followed by a bearish displacement move.
In the London session movement scenario, there is potential for price to rise and enter the Unicorn zone. However, if momentum increases and buy-side liquidity is absorbed, should selling pressure dominate, there is a possibility that price will fail to hold at higher levels and revert to the bearish path.
Conclusion
The gold Symbol, after collecting sell-side liquidity, has entered a pullback phase, and on lower time frames signs of weakening bearish momentum are observed.
The prevailing view is currently inclined toward buying scenarios, provided that a market structure shift and weakness in the bearish trend are confirmed. Price reaction to the $4936 to $4965 range, as well as its behavior within the Balanced Price Range zone and Order Block, will play a significant role in determining the next direction.


