


Key Points:
- On the daily timeframe, Solana has formed a Morning Star pattern, signaling a weakening of selling pressure and the potential start of a short-term bullish correction;
- The $87.94 level, identified as the daily Rejection Block, represents the first major supply zone; price reaction at this level may determine whether the correction continues or a bearish reversal unfolds;
- On the 4-hour timeframe, following a Market Structure Break and a reaction to the FVG, an aggressive bullish move has developed; if price enters the Rejection Block zone and structural weakness is observed, the sell scenario will be activated;
- The next resistance levels are located at $89.17 – $89.18; a breakout and consolidation above these levels could confirm a shift in market bias;
- In the bearish scenario, failure to consolidate above the resistances could trigger a move back toward $81.19 and, in the event of intensified selling pressure, down to $76.60;
- From a sentiment perspective, the market remains in a Consolidation phase with a cautious bias; increasing liquidity and structural consolidation above resistance levels are prerequisites for confirming continuation of the bullish trend.
In yesterday’s trading session, Solana’s price was accompanied by a bullish bias, and the formation of a Morning Star pattern signaled a weakening of short-term selling pressure. At present, the market’s focus is on price reaction to the Rejection Block zones and key liquidity levels.
The upcoming scenarios will depend on price behavior around the $87.94, $86.09, and $89.17 areas, and whether these levels are broken or defended will determine the next directional move.
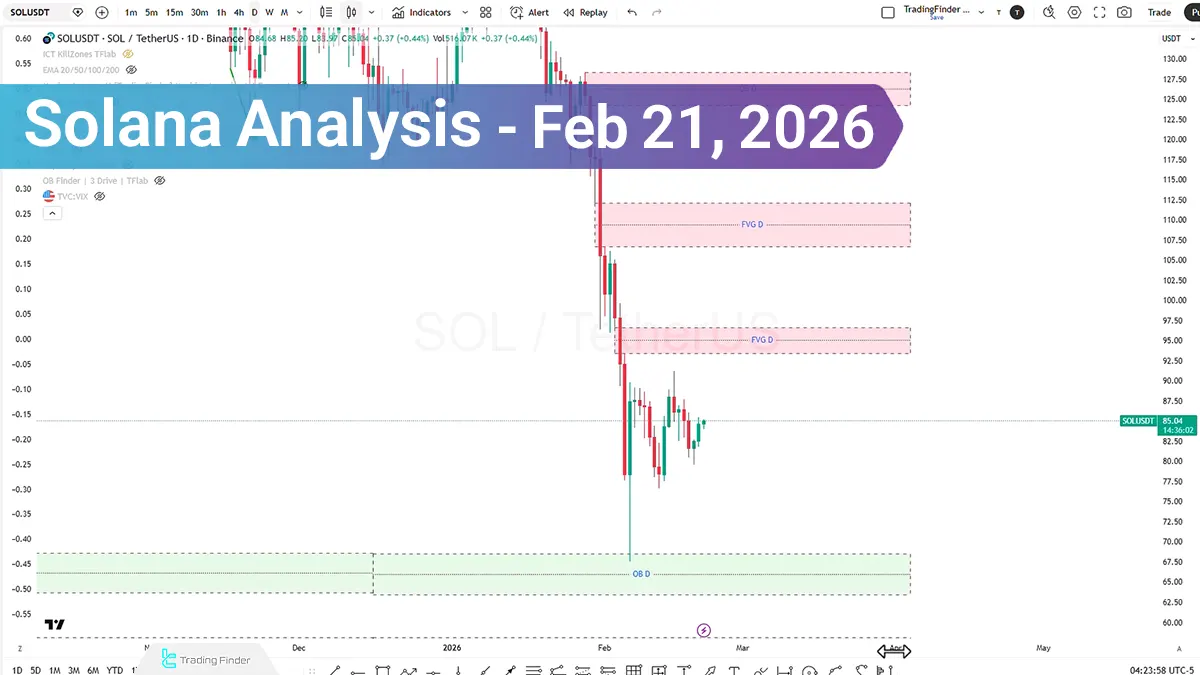
Solana Analysis on the Daily Time Frame (D1)
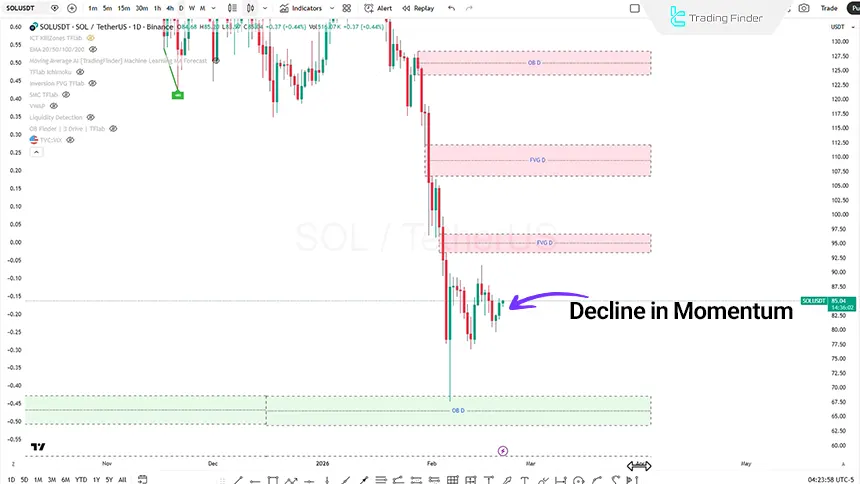
On the daily timeframe, the formation of a Morning Star pattern following a bearish phase indicates a reduction in negative Momentum and the potential beginning of a bullish corrective phase. Based on the current structure:
- If the bullish bias is maintained, price is expected to move toward the Rejection Block zone at $87.94;
- This level may act as a potential supply zone and reveal signs of weakness in the short-term bullish trend.
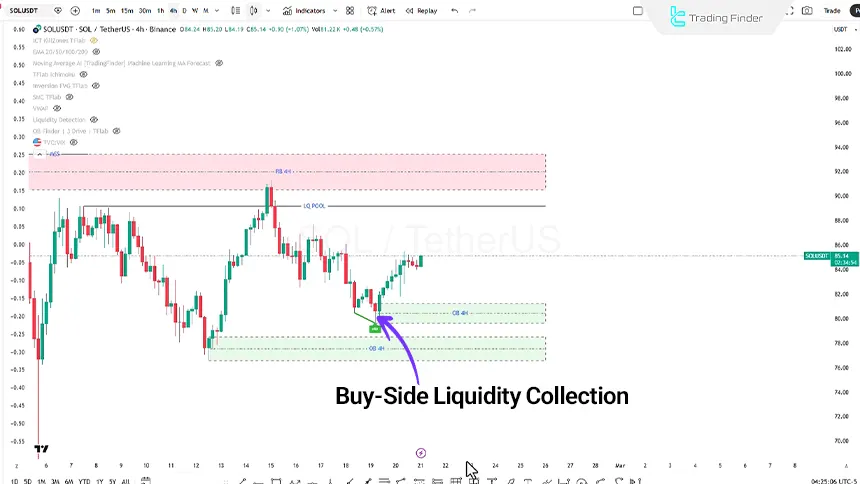
Solana Analysis on the 4-Hour Time Frame (H4)
On the 4-hour timeframe, following a Break of Structure, price entered the Fair Value Gap zone and reacted to this area. The inability to break this zone and the re-formation of a Morning Star pattern on H4 have paved the way for a high-momentum bullish move.
Currently, price is advancing upward with an Aggressive Move. If price continues to rise and enters the Rejection Block zone:
- Should Buy Side Liquidity be collected and a candle Close occur within this zone, accompanied by structural weakness;
- A short-entry scenario may be considered.
Solana Fundamental and Sentiment Analysis
Market Sentiment analysis indicates that Solana remains in a Consolidation phase with a negative outlook. However, if Clarity is confirmed and structural price consolidation occurs at higher levels, a shift in bias toward positive territory becomes possible.
An increase in liquidity percentage and the formation of positive Momentum could set the stage for continuation of the bullish move toward the $89.17 and $89.18 resistance levels. Conversely, failure to stabilize at key levels and increased selling pressure would strengthen the probability of a return to the $81.19 and even $76.60 zones.
Conclusion
Solana’s current structure reflects the market’s attempt to recover from a short-term bearish phase; however, the $87.94 and $89.17 levels function as key supply zones. Price reaction to these levels, along with candlestick behavior and the manner in which candles close, will determine the next directional move.
Until a decisive breakout and consolidation above the mentioned resistances occur, pullback and liquidity-collection scenarios will remain valid.


