


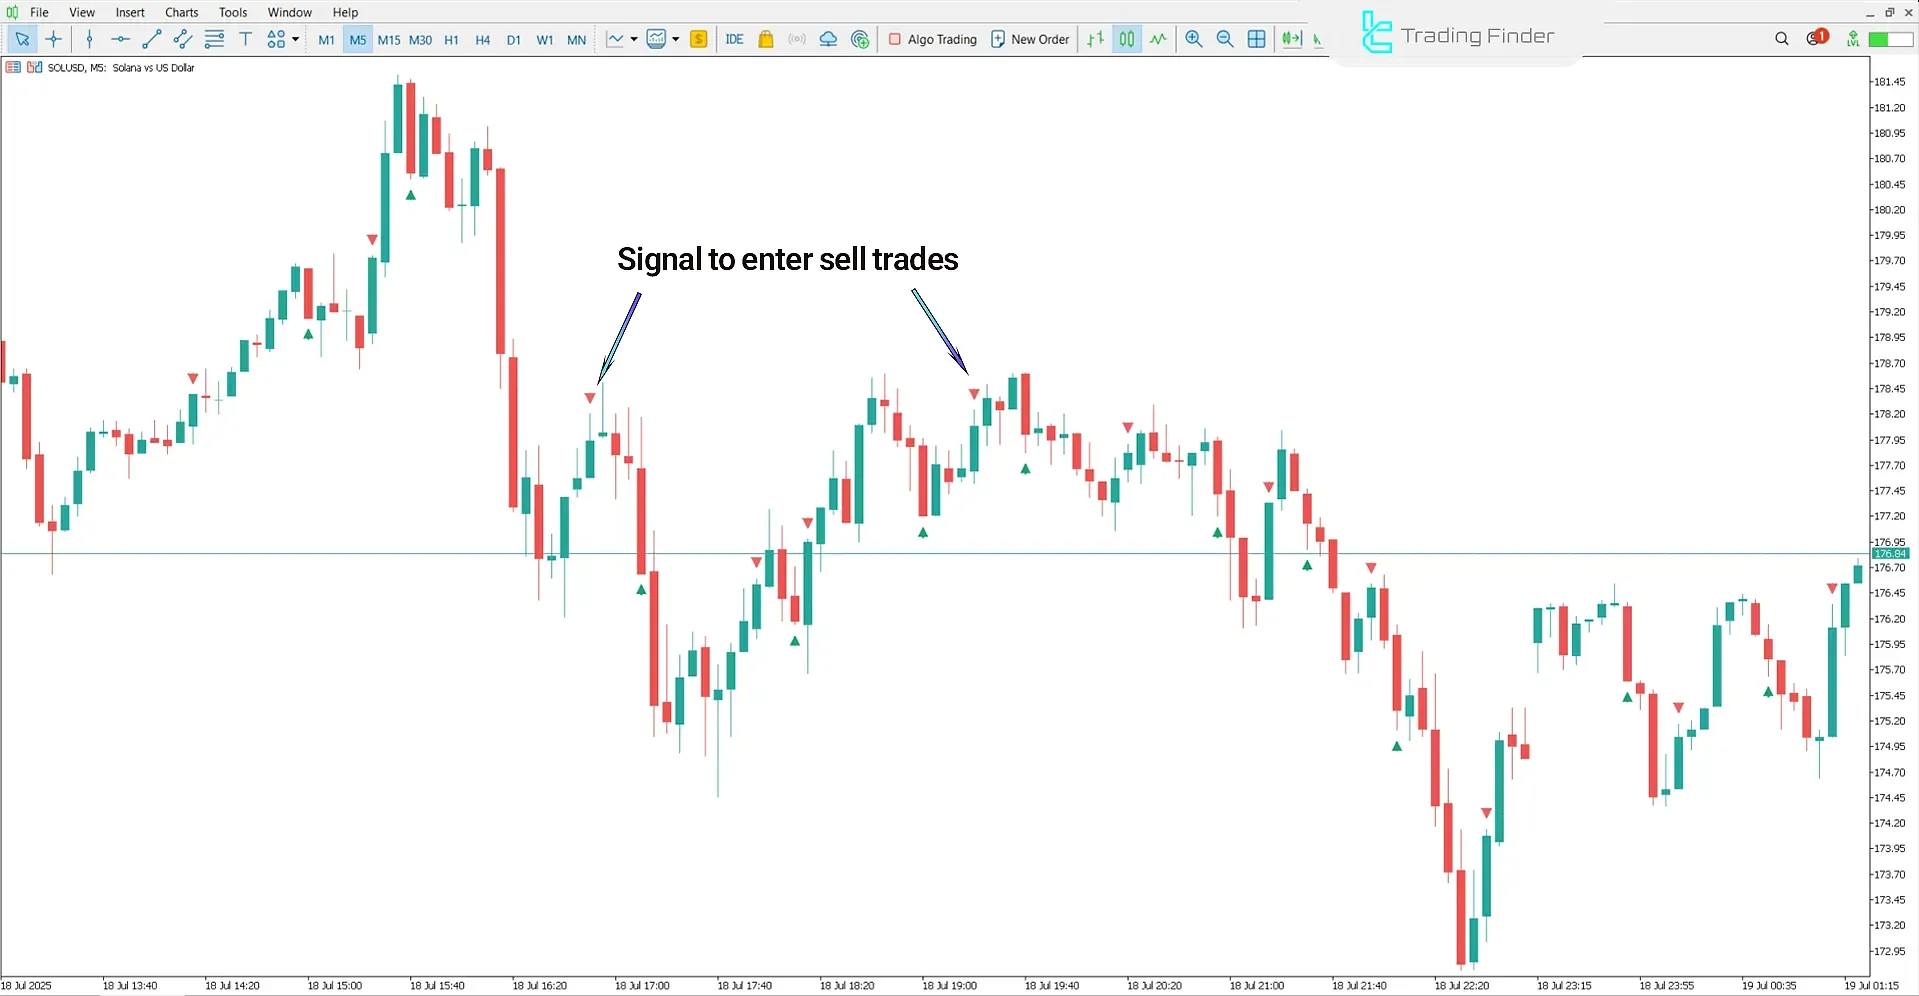
In binary options trading, by electing the right indicator, you can identify entry zones and choose the appropriate expiration time. The use of indicators in binary options differs from other trading methods.
For instance, the RSI indicator is used in binary options to detect quick entries for short-term trades, whereas in other methods, it's often applied to identify long-term trands. Some of the best indicators for binary options include CCI, MACD, RSI, and ATR.
What Is a Binary Option Indicator?
Most binary option indicators rely [either directly or indirectly] on simple and exponential moving averages to analyze the market and generate signals.
Training on 5 of the Best Binary Options Indicators as Introduced by binaryoptions.com
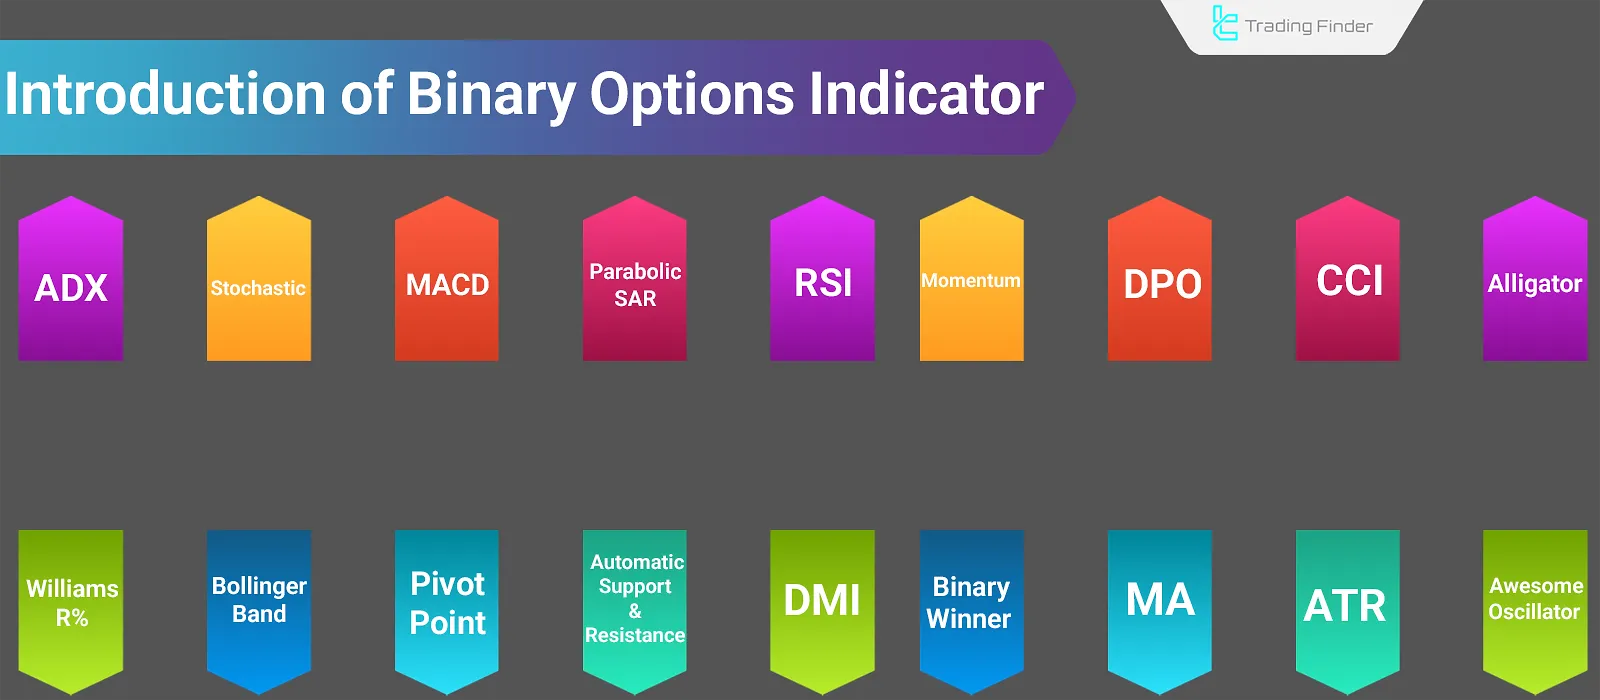
Introducing 20 Suitable Indicators for Binary Options Trading
In binary options, indicators are used across various analysis segments, including trend confirmation, reversal points, trend strength, breakout detection, identifying overbought and oversold zones.
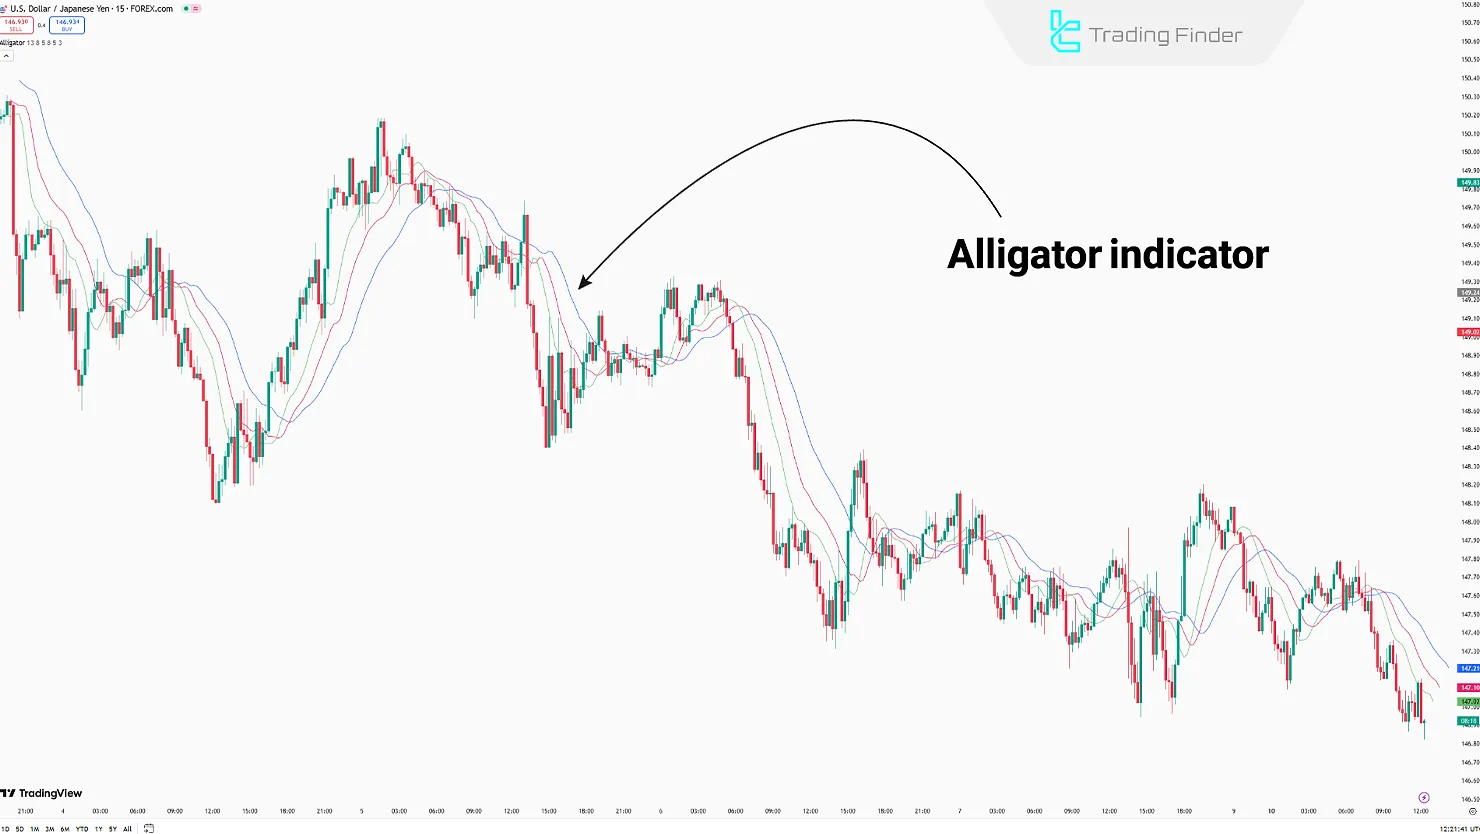
Alligator
The Alligator indicator performs better in trending markets like Forex and commodities.
As the gap between the indicator’s lines opens or closes, the market trend is identified to determine the optimaltime for entering binary option trades.
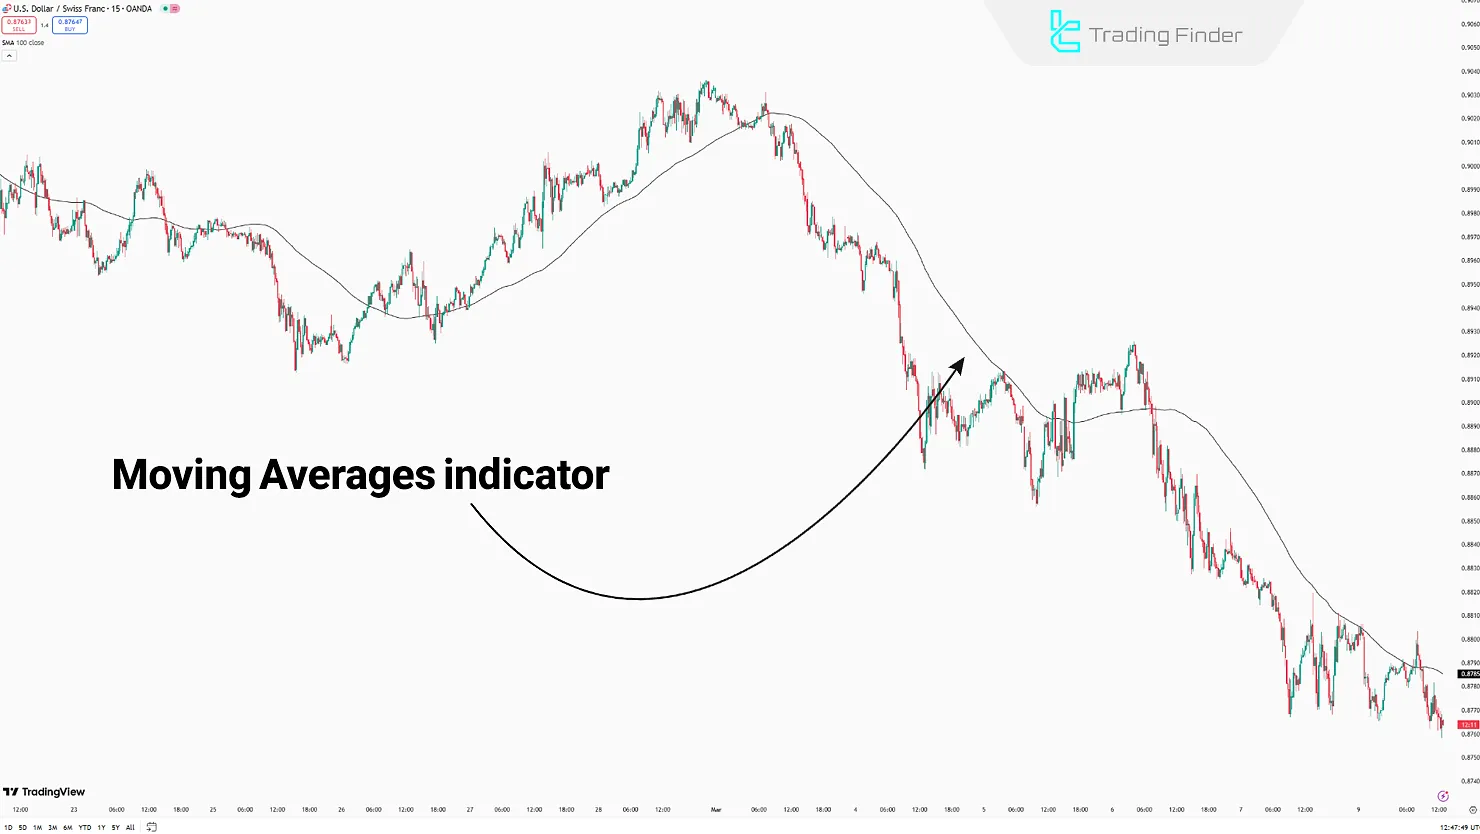
Moving Averages
Unlike Forex market, theMoving Average indicator in binary options is mainly used for generating fastentry and exitsignals.
The crossing of moving averages provides a clear signal for executing trades.
Binary Winner indicator
The Binary Winner indicator is recognized as one of the most widely used tools in the binary options market.
With its internal algorithms, this indicator focuses primarily on identifying price reversal points and visually marks entry and exit conditions using green and red arrows.
This tool falls into the category of reversal and signal-generating indicators, and due to the simplicity and clarity of its signals, it is also suitable for beginner traders.
Its functionality is based on multi-timeframe analysis, and besides Forex, it can also be used in the stock market, commodities , indices, and cryptocurrencies.
In an uptrend, by combining price data and candlestick patterns, areas with potential for renewed growth are identified, and the indicator issues a buy signal with a green arrow.
Conversely, under bearish conditions and when the trend weakens, the display of a red arrow serves as a sell warning.
In terms of settings, the indicator provides various options such as defining the maximum bars (MAX BARS), enabling alerts (ALERT), notifications (NOTIFICATION), and sending messages via email. This flexibility allows the trader to manage the execution of a strategy according to their needs.
Another important feature of Binary Winner is that it is No Repaint, meaning that signals generated do not change after the candlestick is formed, which gives greater credibility to entries.
Ultimately, by focusing on trend structure analysis and reversal levels, this indicator is considered a practical option for daily strategies in both the binary options market and other financial assets.
Download links for the Binary Winner indicator:
- Download Binary Winner Indicator for MetaTrader 5
- Download Binary Winner Indicator for MetaTrader 4
- Download Binary Winner Indicator for TradingView
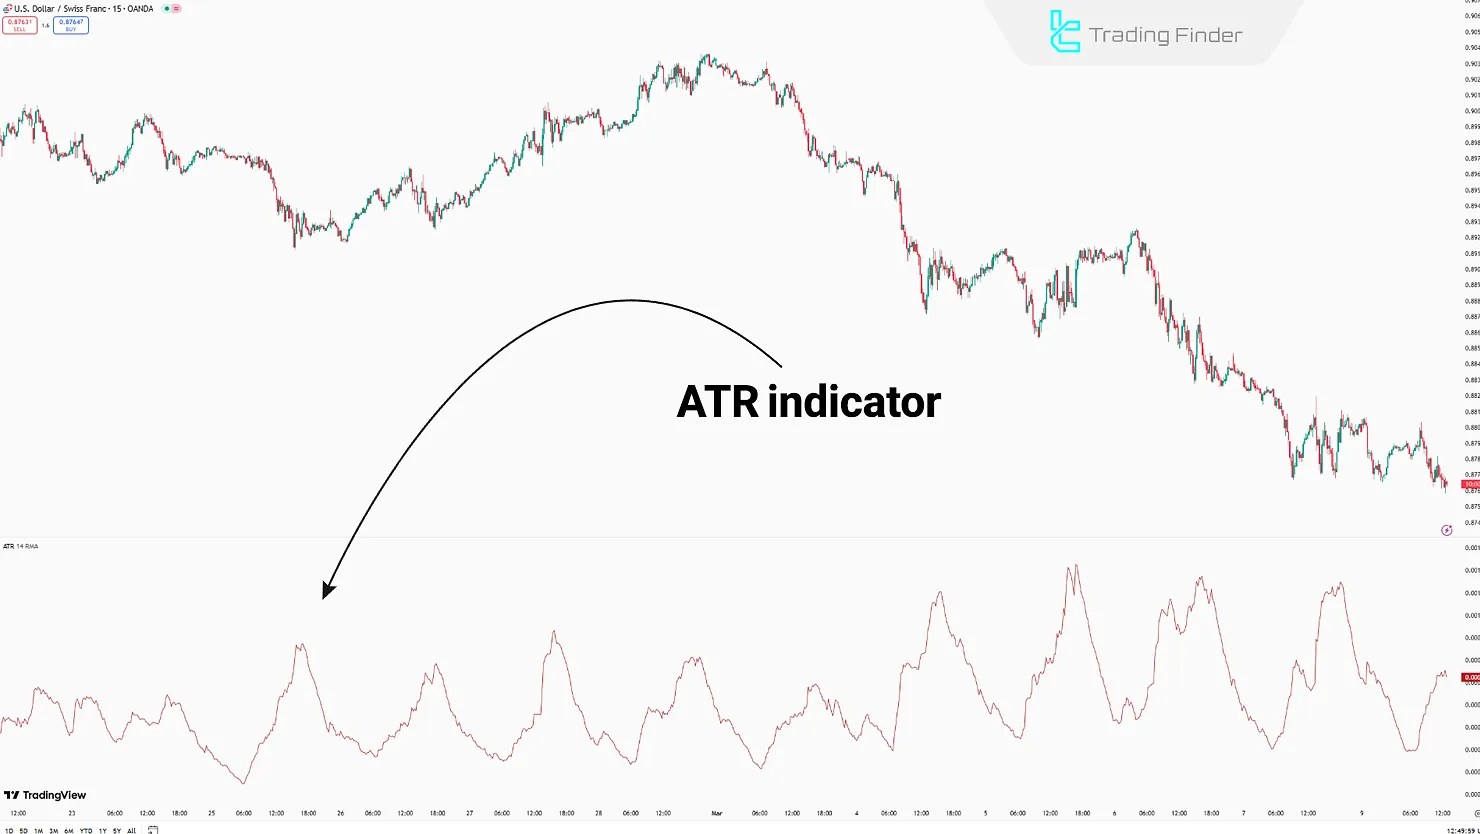
ATR
The ATR indicator performs better in highly volatile markets like cryptocurrency and commodities.
In binary options, the market’s real-time volatility is a critical factor in choosing the right moment to enter a trade. ATR measures volatility strength, making it useful for timing.
This indicator was introduced in the article Training on Binary Options Indicators byTraders Union.
This indicator reflects market volatility, which is why ATR (Average True Range) is useful for selecting the expiration time in binary options trading.
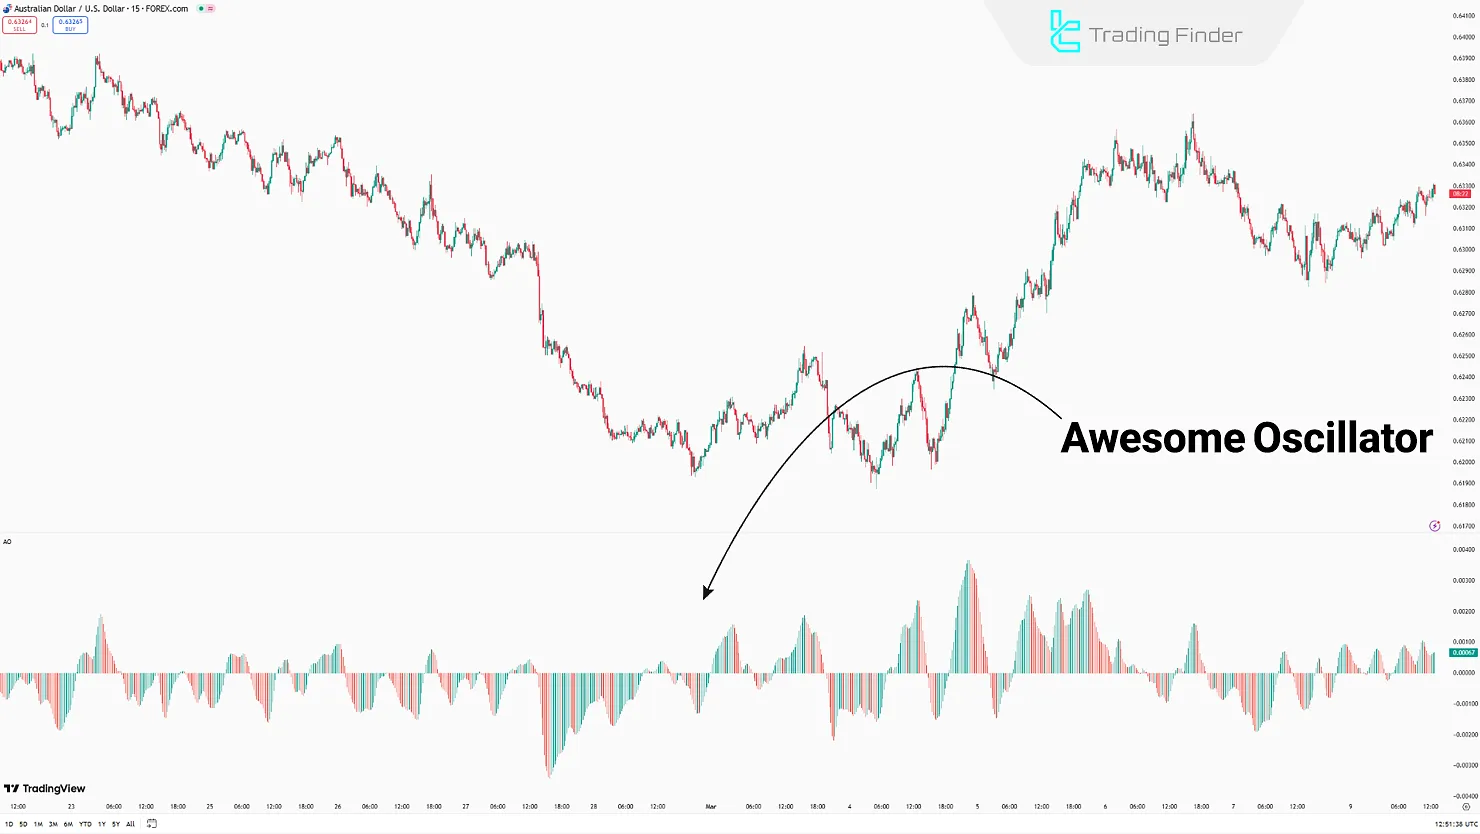
Awesome Oscillator
The Awesome Oscillator is effective for early trend reversal detection. When the AO line crosses above the zero line, it gives a strong entry signal.
Unlike other trading strategies where this indicator is used for long-term trades, in binary options, it's applied to short-term trades.
ADX
In binary options, trading in a range-bound or trendless market has a very low success rate. When the ADX shows a value above 25, it indicates a strong trend and a suitable time for trading.
Note that ADX is only used to identify trend strength not to provide entry signals. The ADX indicator is used to identify market trends in binary options.
Directional Movement Index (DMI)
lines (-DI, +DI, and ADX) and is applied to measure both the strength and the direction of a trend. When +DI is above -DI, it indicates bullish strength, while if -DI is higher than +DI, bearish strength is confirmed.
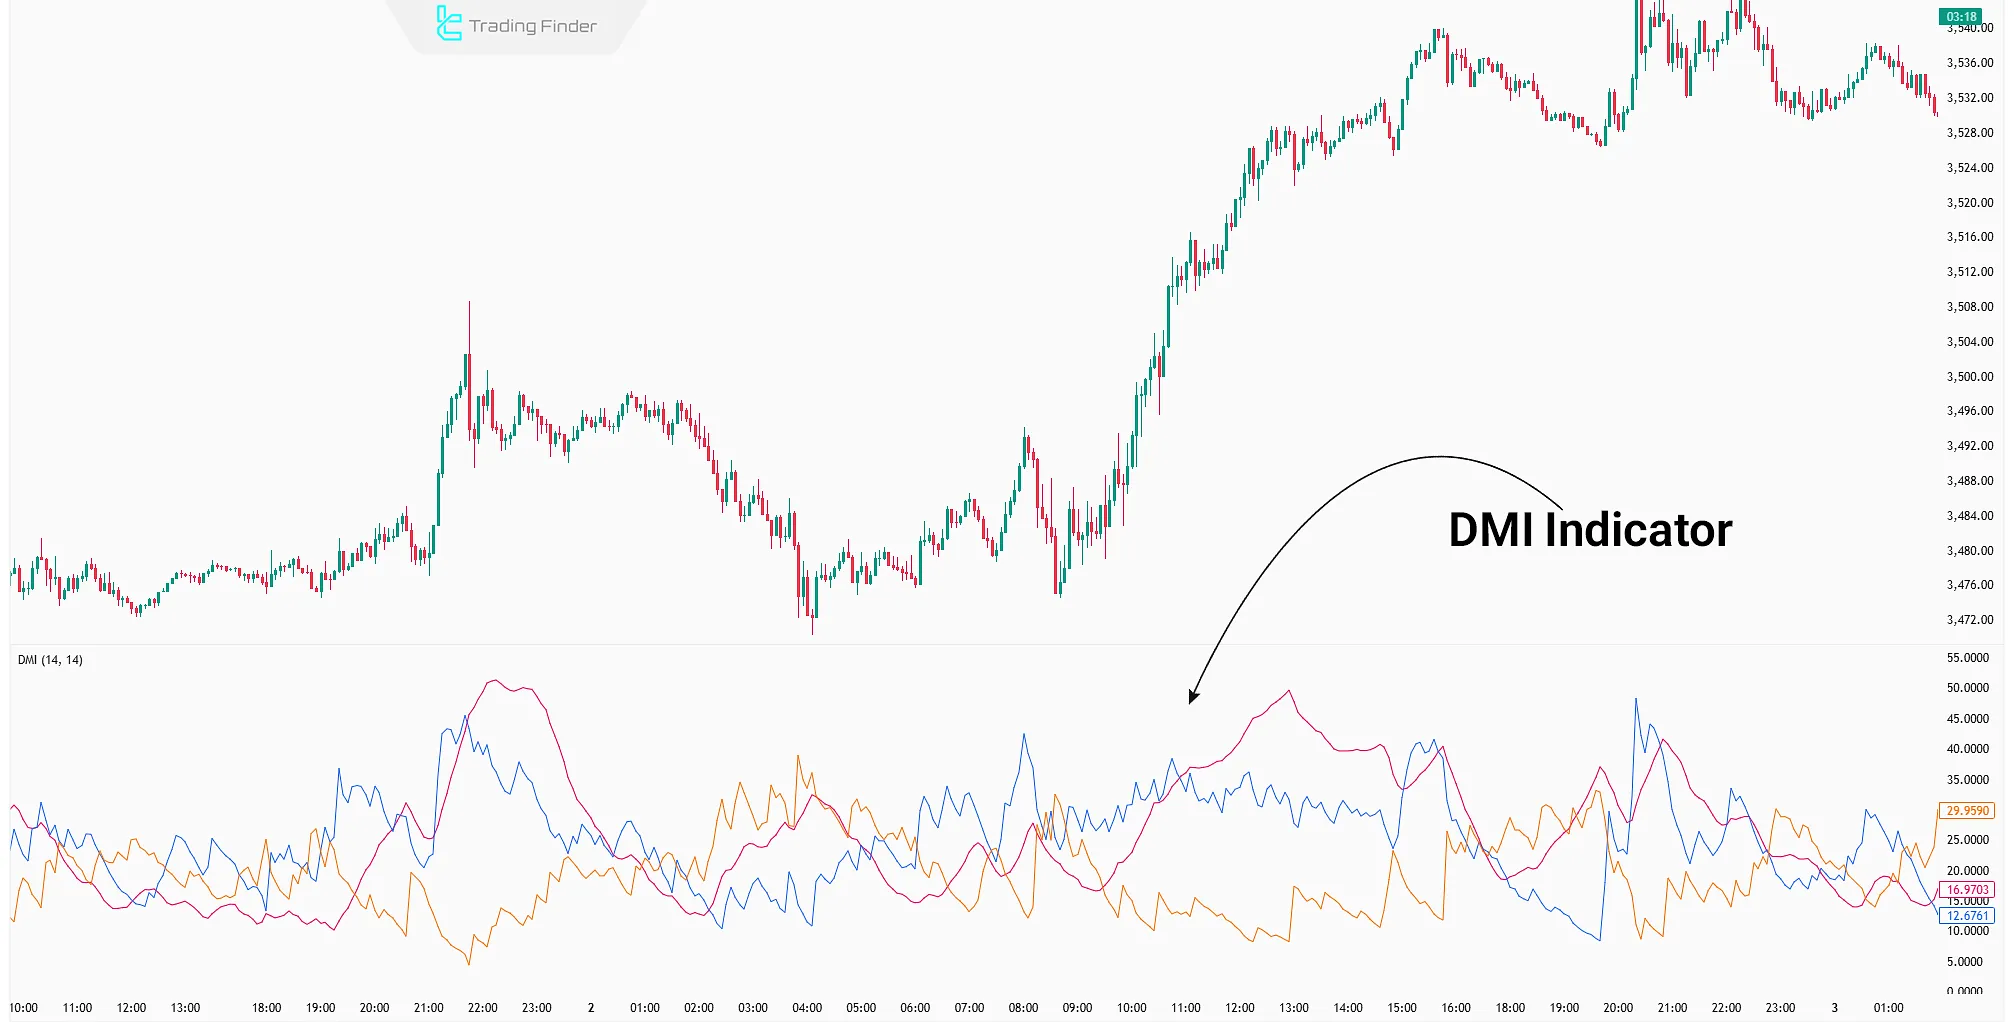
Combining this information with the ADX line can help determine trend strength and identify binary entry points during price breakouts.
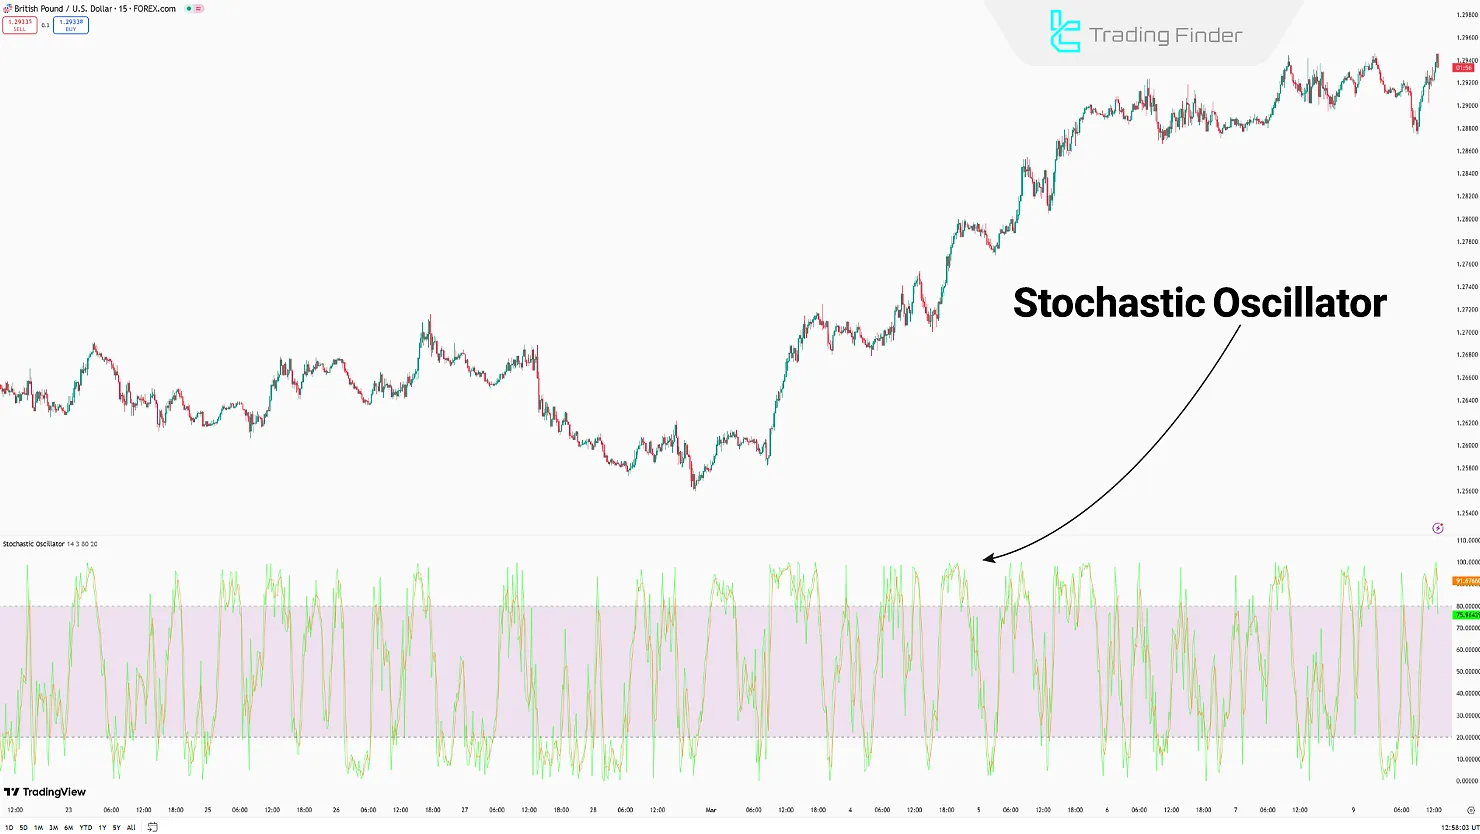
Stochastic Oscillator
The Stochastic Oscillator is fast in detecting overbought and oversold levels on lower timeframes.
In ranging markets, oscillations between levels 80 and 20 generate good entry signals. This indicator is valuable for identifying short-term reversal moves.
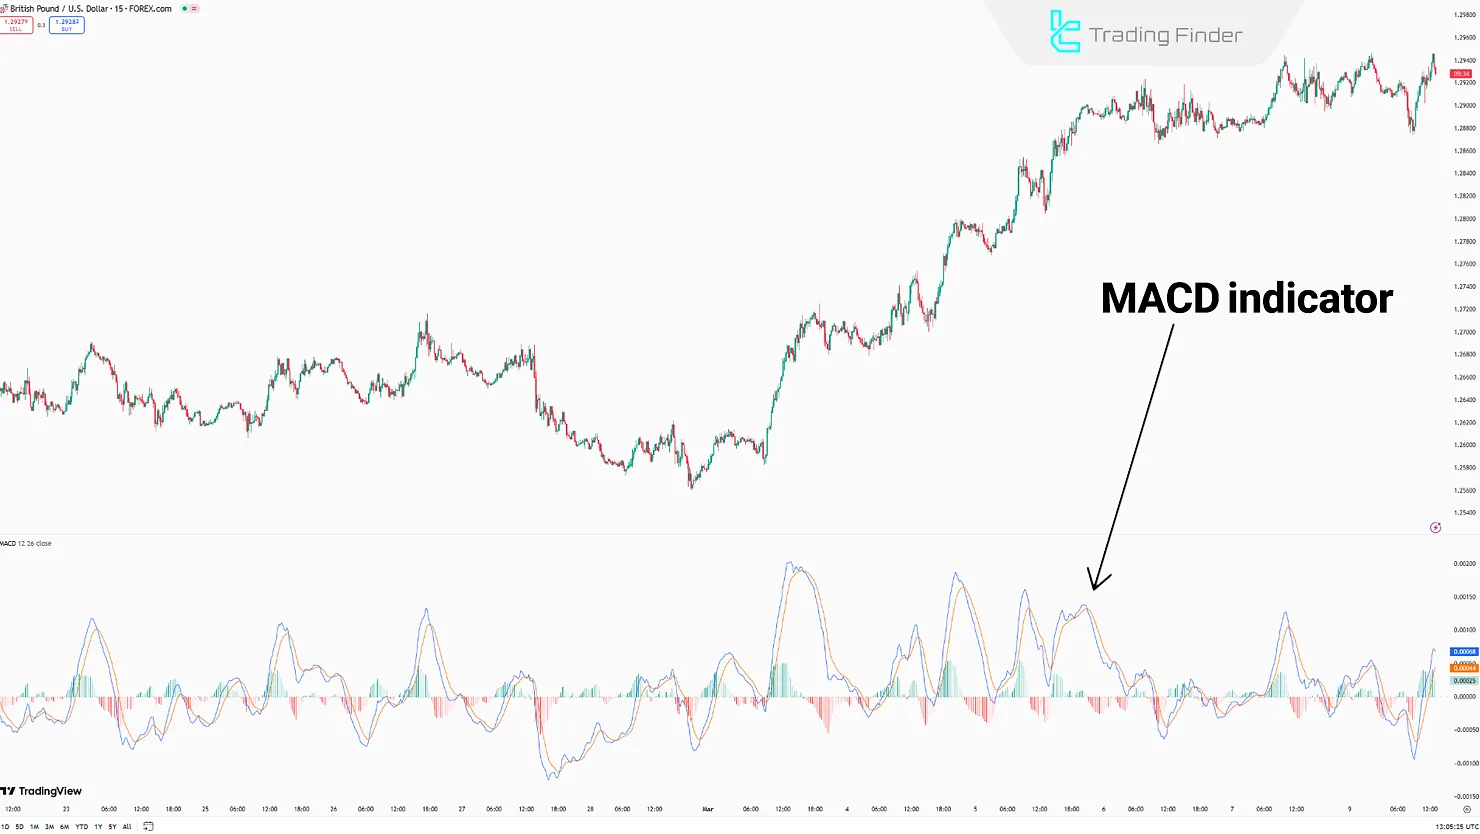
MACD
Trading with the MACD strategy in binary options becomes possible by observing the crossover between the MACD line and the signal line in the MACD indicator.
The crossover of the MACD line and the signal line provides strong entry signals in binary options.
It can also be used to identify overbought and oversold conditions and issue entry signals accordingly.
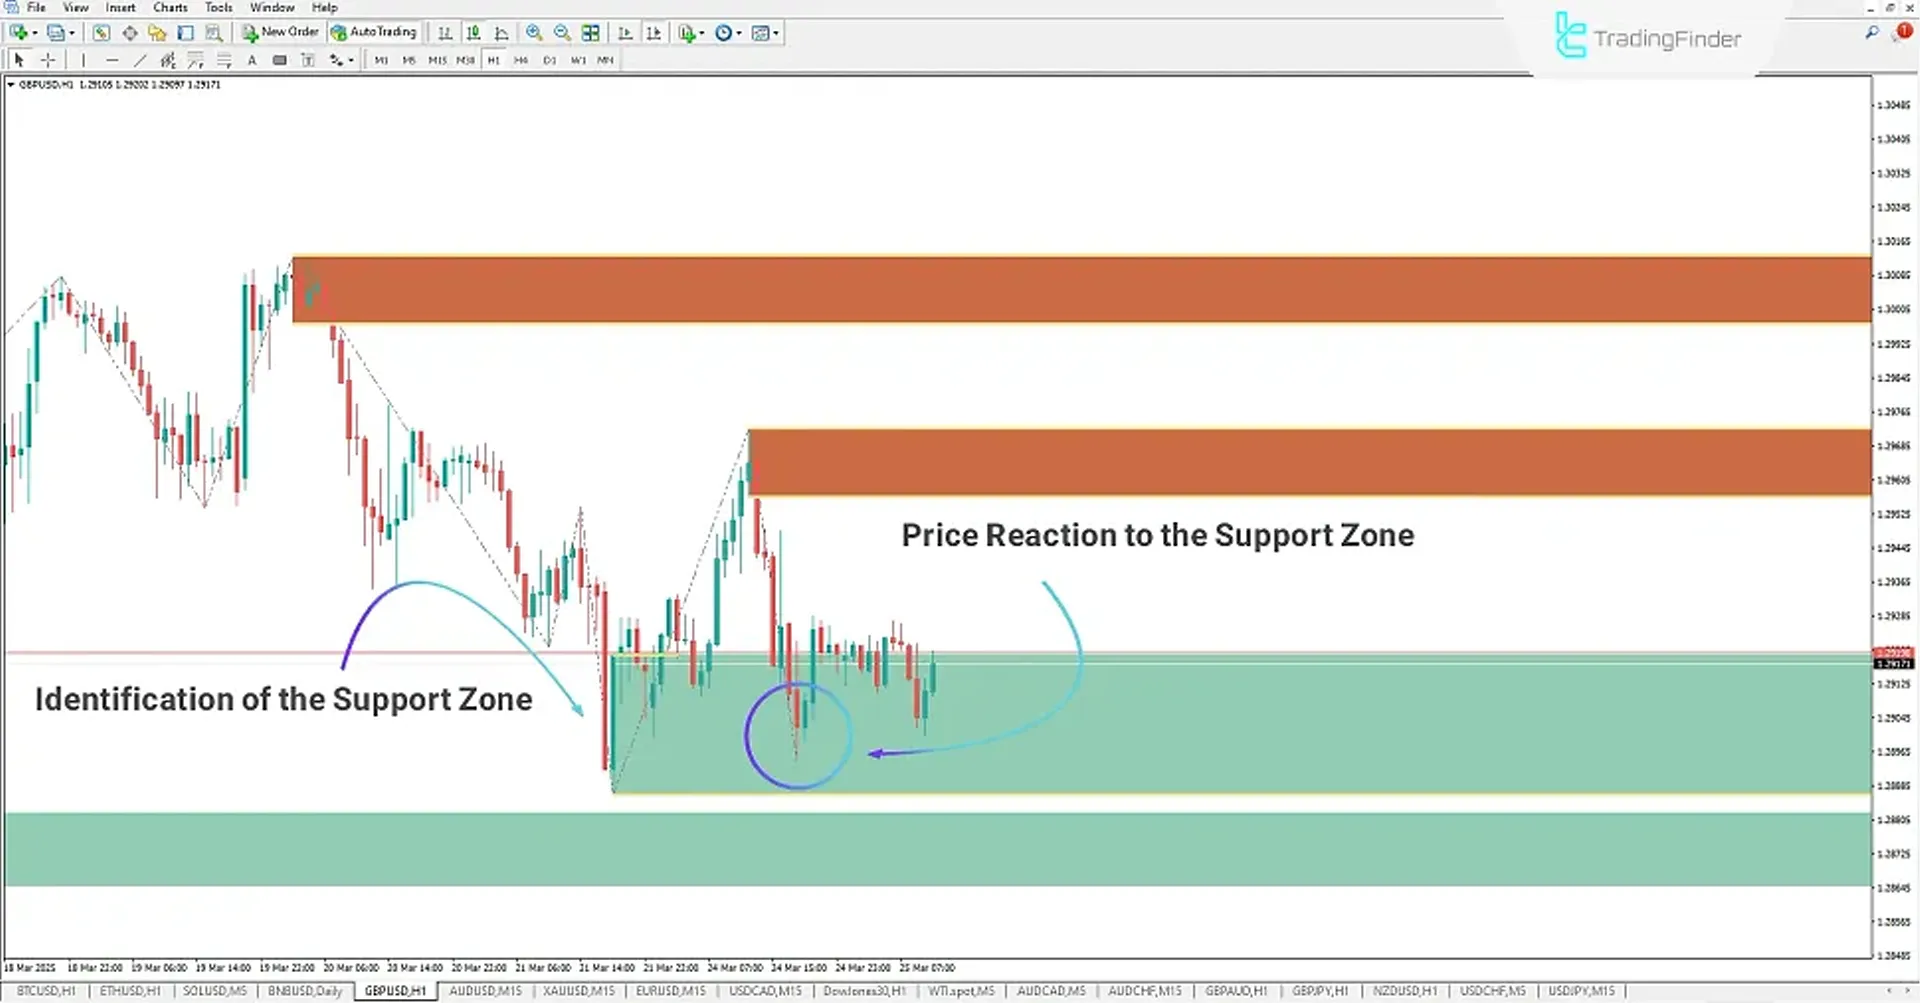
Automatic Support & Resistance Indicator
identifying key market levels that automatically draws support and resistance zones. This indicator uses colored boxes, showing support areas in green and resistance areas in brown; newly formed levels appear in darker shades, while tested levels are displayed in lighter tones.
This feature allows traders to quickly evaluate the reliability of a level and select more optimal entry or exit points.
In markets such as Forex , stocks, or indices, this indicator is particularly valuable for price action traders, as it provides a precise evaluation of price reactions to both past and present levels.
For example, in the GBP/USD pair on a 15-minute timeframe, identifying a valid support zone resulted in the formation of an uptrend after touching the key level.
Conversely, on a one-minute EUR / USD chart, resistance areas were highlighted in brown, providing opportunities for sell positions.
In addition to identifying reversal points, this indicator is also applicable in various strategies such as scalping and day trading. Moreover, with customizable colors for tested and untested levels, it offers the flexibility traders need to personalize their chart display.
Ultimately, the Automatic Support & Resistance indicator in MetaTrader 5 stands out as one of the efficient tools for managing trading positions and gaining a better understanding of market structure.
When combined with other analytical indicators such as supply and demand tools or risk management instruments, it provides a more comprehensive outlook of price behavior for traders.
Download links for the Automatic Support & Resistance Indicator:
- Download Automatic Support & Resistance Indicator for MetaTrader 5
- Download Automatic Support & Resistance Indicator for MetaTrader 4
- Download Automatic Support & Resistance Indicator for TradingView
RSI
In binary options, the RSI indicator is mostly used on 1 to 5-minute timeframes. If RSI moves above 70, it generates a sell signal. If it drops below 20, it provides a buy signal.
Combining this indicator with other technical analysis methods, such as classical chart patterns, increases the reliability of trade signals.
To obtain binary options signals with RSI, the movement of the indicator’s moving average relative to price action must be analyzed.
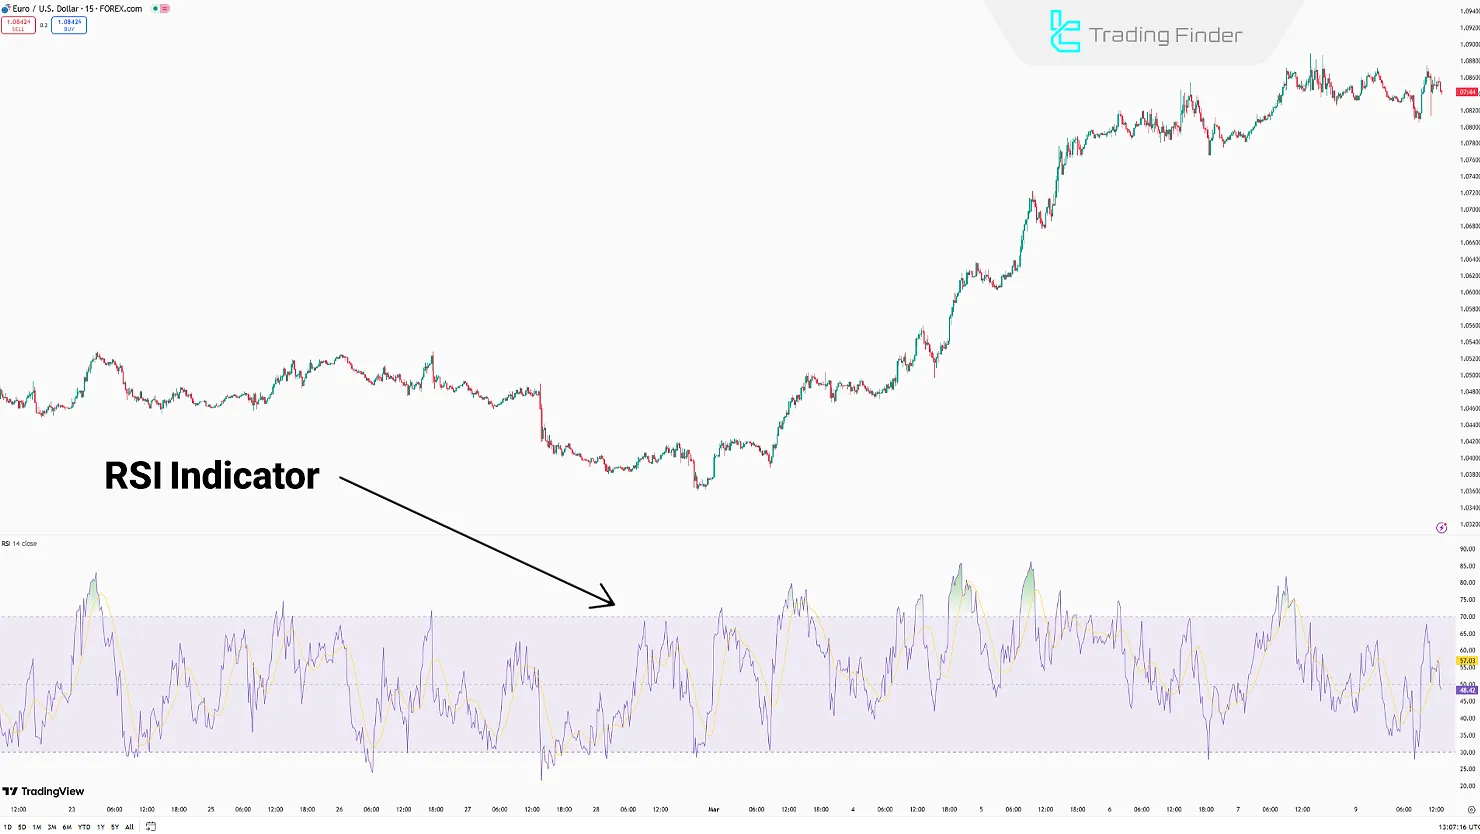
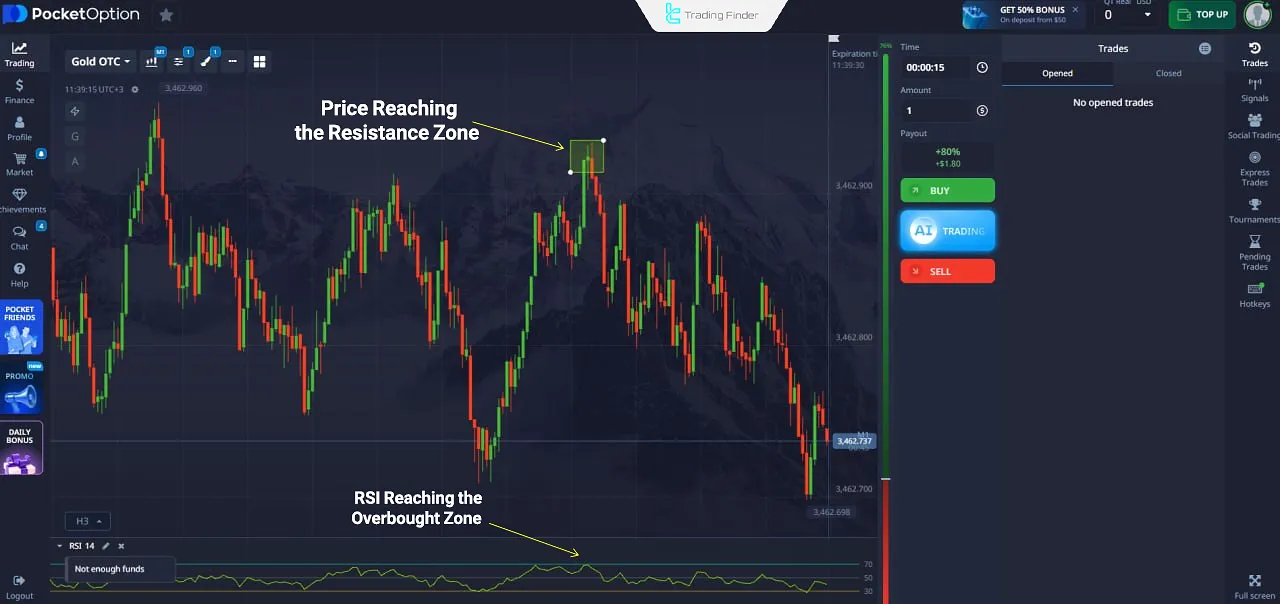
Example of using the RSI indicator in binary options trading
For instance, when the price reaches a resistance zone and the RSI indicator shows overbought conditions, a PUT trade has a higher probability of success compared to a CALL trade.
Therefore, as shown in the chart below, when entering a trade simultaneously with RSI reaching the overbought zone, the trade ended in profit.
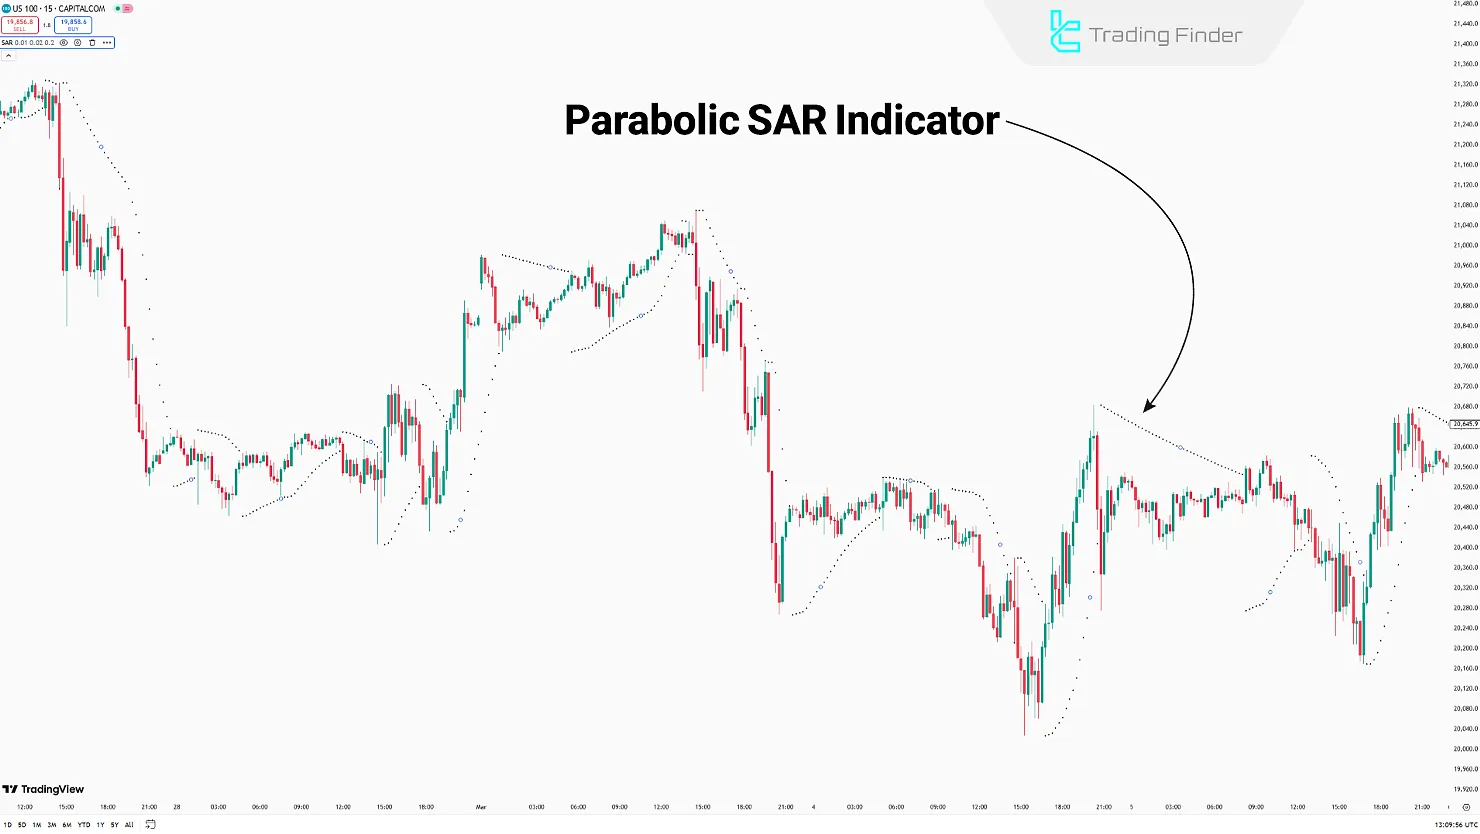
Parabolic SAR
In binary options, the Parabolic SAR is used as a trend-confirmation indicator.
When the indicator's dots shift from top to bottom, it gives a Call signal. If they move from bottom to top, a Put signal is generated.
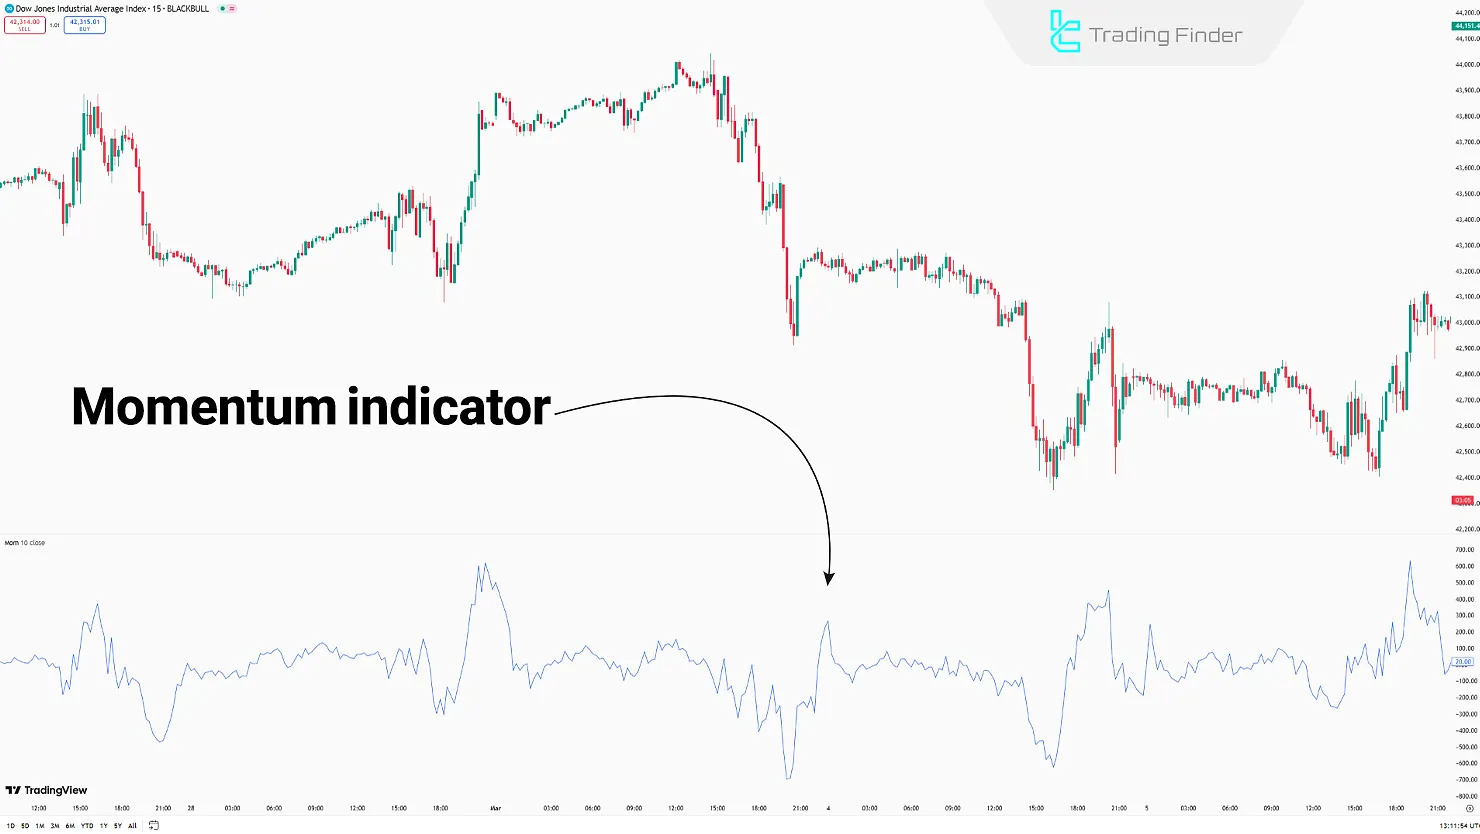
Momentum
When the Momentum indicator crosses above the 100 level, it signals the start of a strong move.
In binary options, it is favored for fast entries, especially on low timeframes, due to its minimal lag. It performs better in volatile markets like Forex and cryptocurrency.
Momentum Indicator Formula
To better understand how the Momentum indicator functions and how it generates signals for binary options, reviewing its calculation formula is essential:
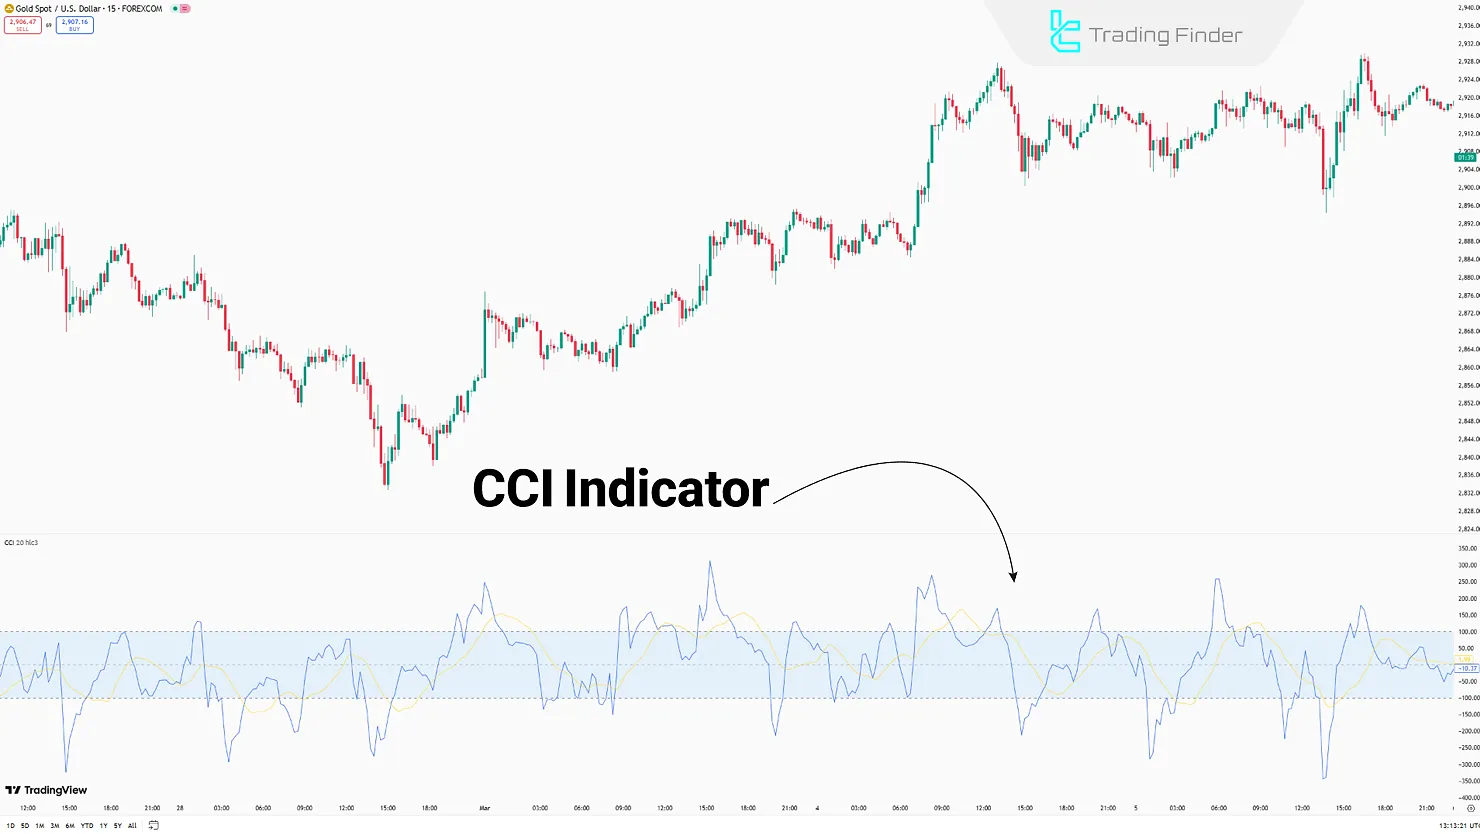
CCI
When the CCI indicator moves above the +100 level, it indicates overbought conditions and gives a PUT signal.
If it drops below -100, it signals oversold conditions and suggests a CALL trade. This indicator is more effective on 1 to 15-minute timeframes compared to longer ones.
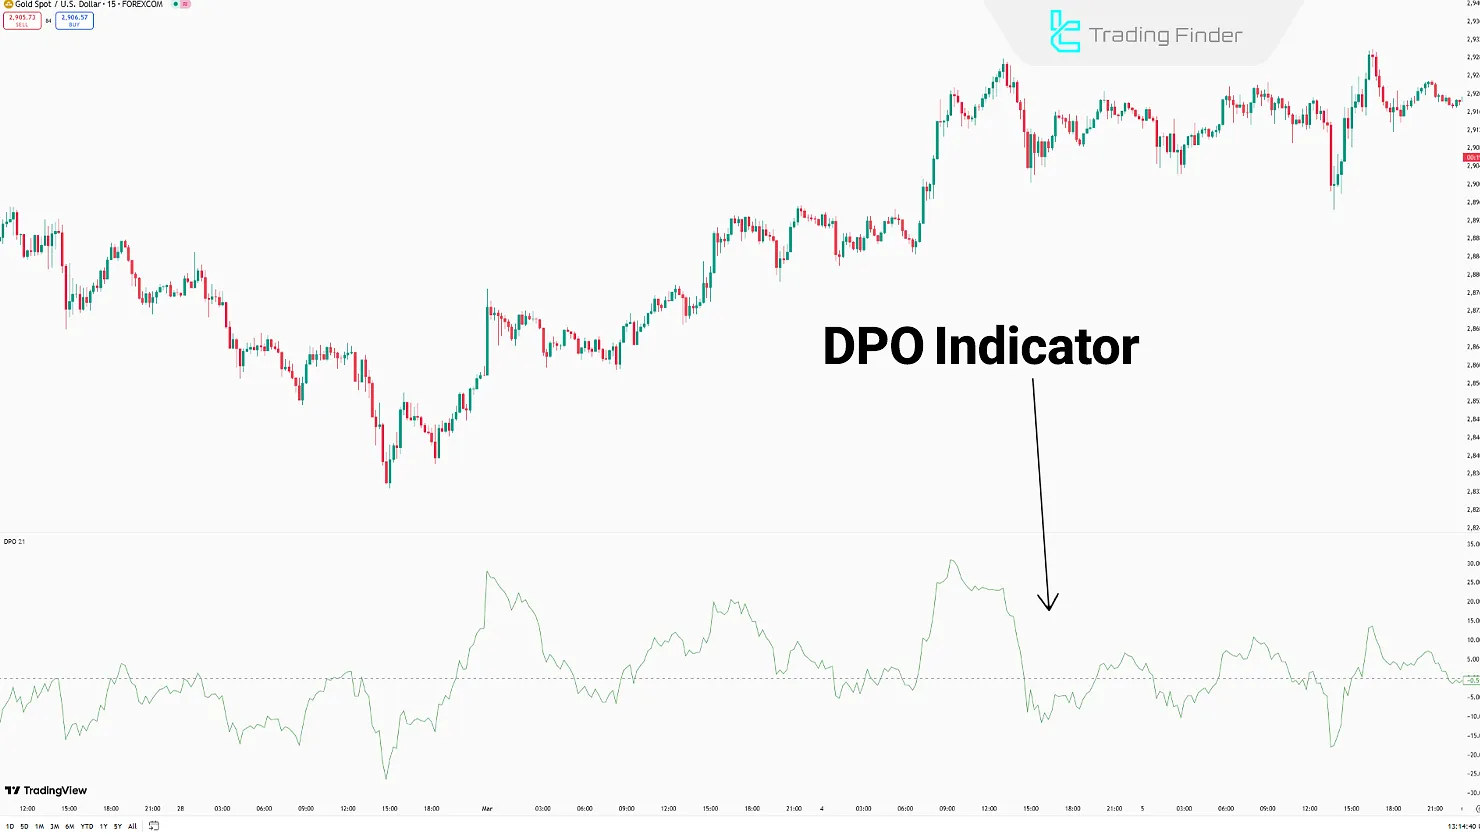
DPO
TheDetrended Price Oscillator (DPO) eliminates long-term trends and focuses on short-term cycles, making it suitable for short-term binary option trades.
When the DPO reaches high positive levels, it signals overbought conditions and a PUT signal. It indicates oversold conditions and a CALL signal when it goes to low harmful levels.
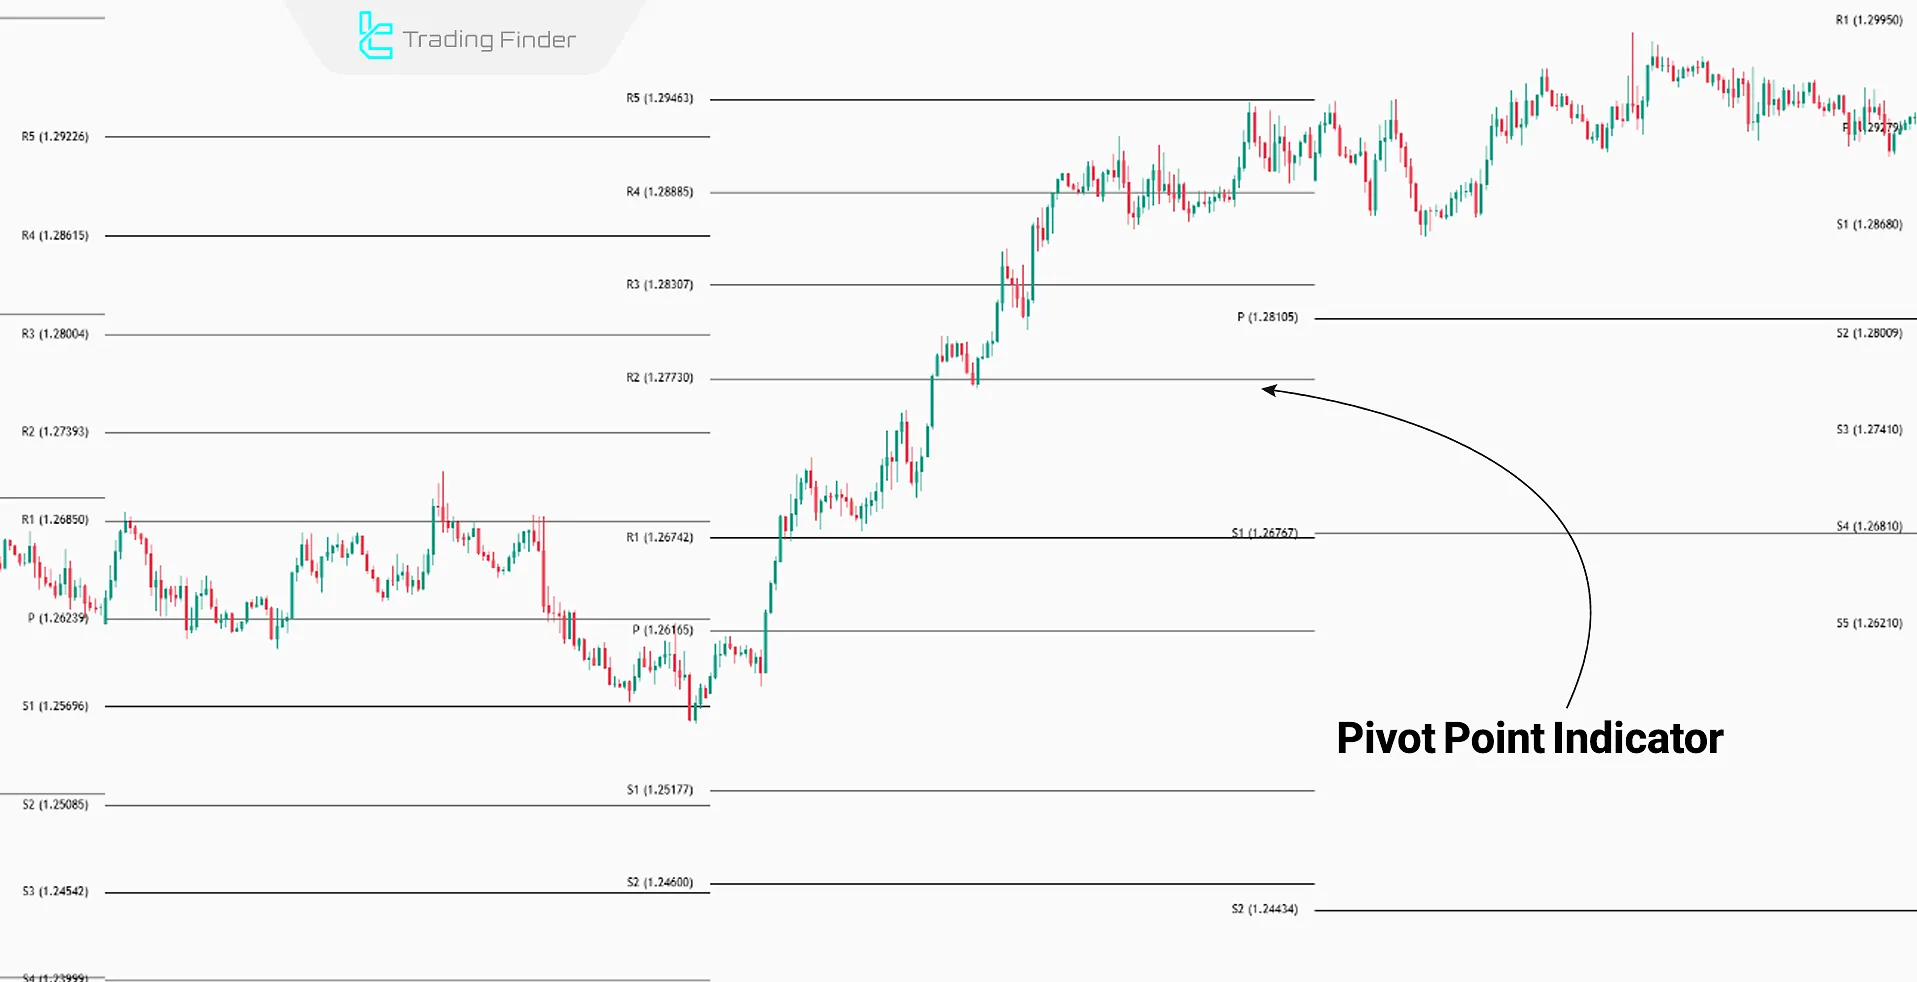
Pivot Point
This indicator calculatessupport and resistance levels based on previous candle data, helping to identify potential reversal zones.
When the price approaches the main Pivot level and is accompanied by reversal candles, it signals either a CALL or PUT trade depending on direction.
Touching R1 or R2 levels in an uptrend usually triggers a PUT signal, while touching S1 or S2 levels in a downtrend typically leads to a CALL signal.
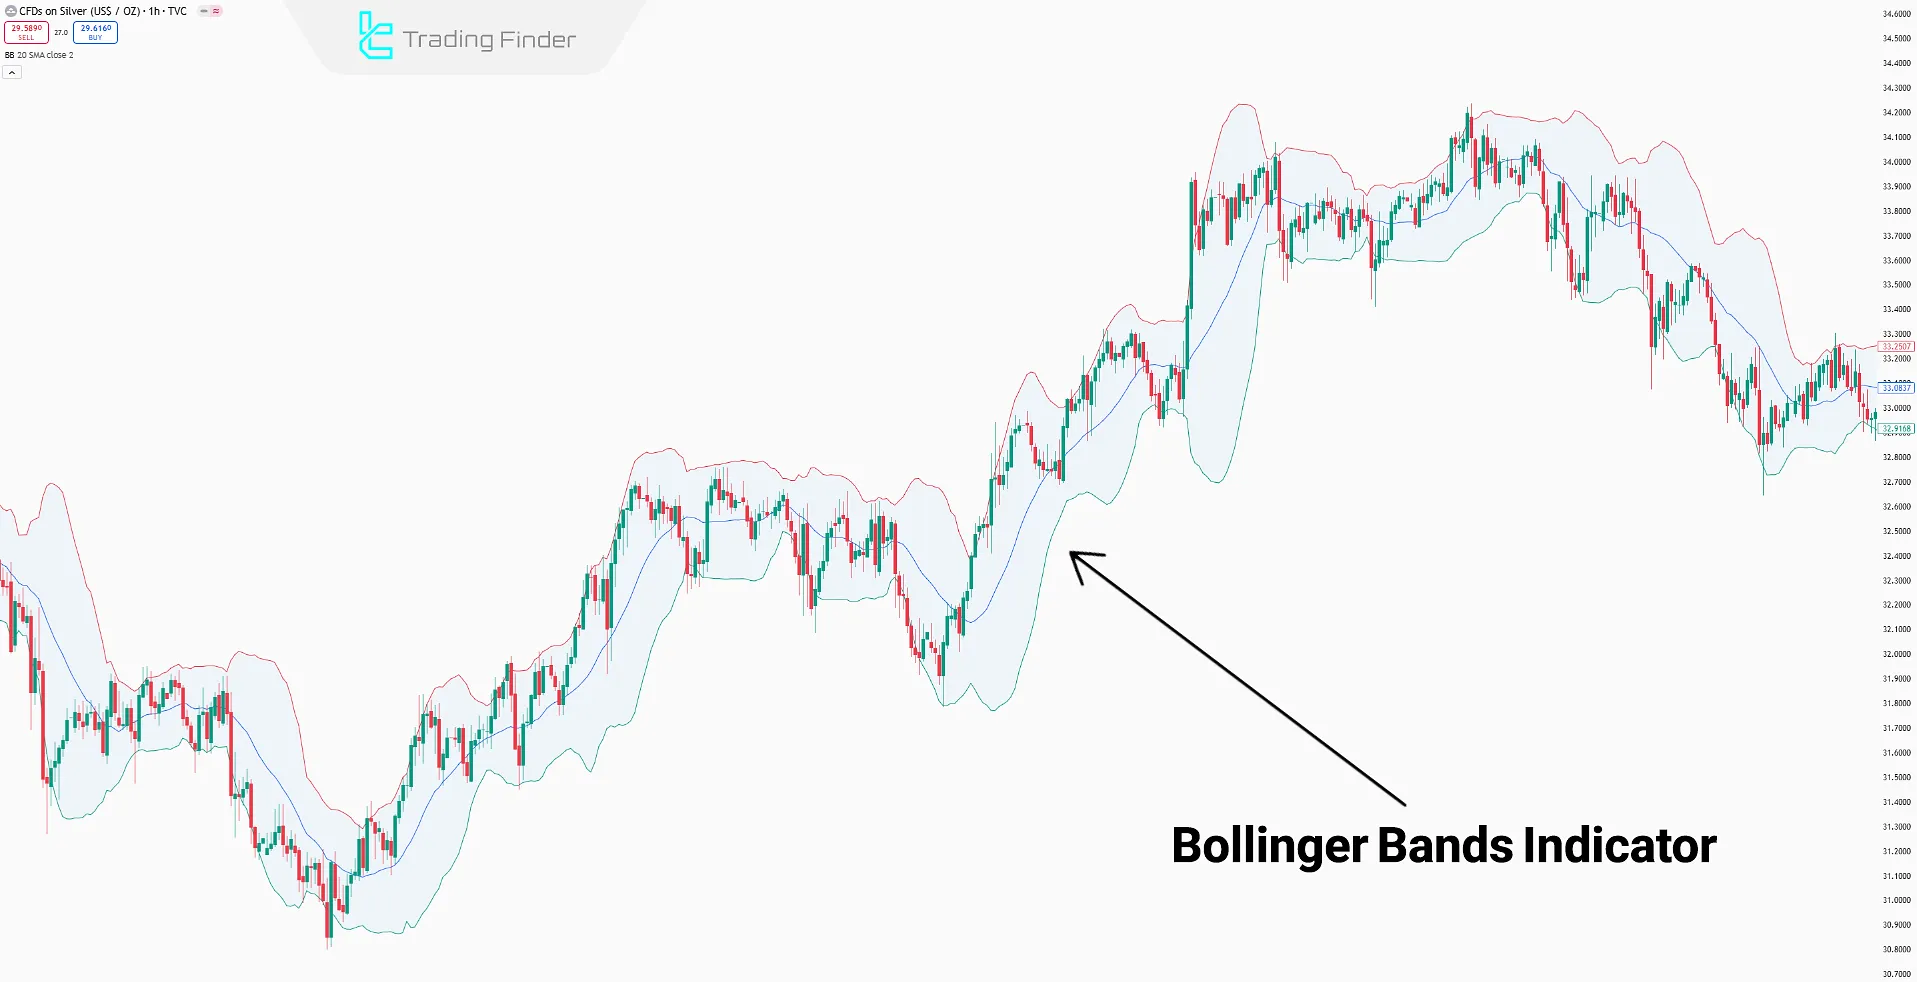
Bollinger Bands
This indicator forms two bands around the price using two moving averages and is commonly used to identify overbought and oversold conditions in binary options.
When the price touches or breaks above the upper band, it signals overbought conditions and a PUT trade. If it touches or breaks below the lower band, it indicates oversold conditions and a CALL trade.
Bollinger Bands settings for binary options do not differ from the indicator’s default settings. Only if this indicator is part of a trader’s personal strategy should specific adjustments be applied.
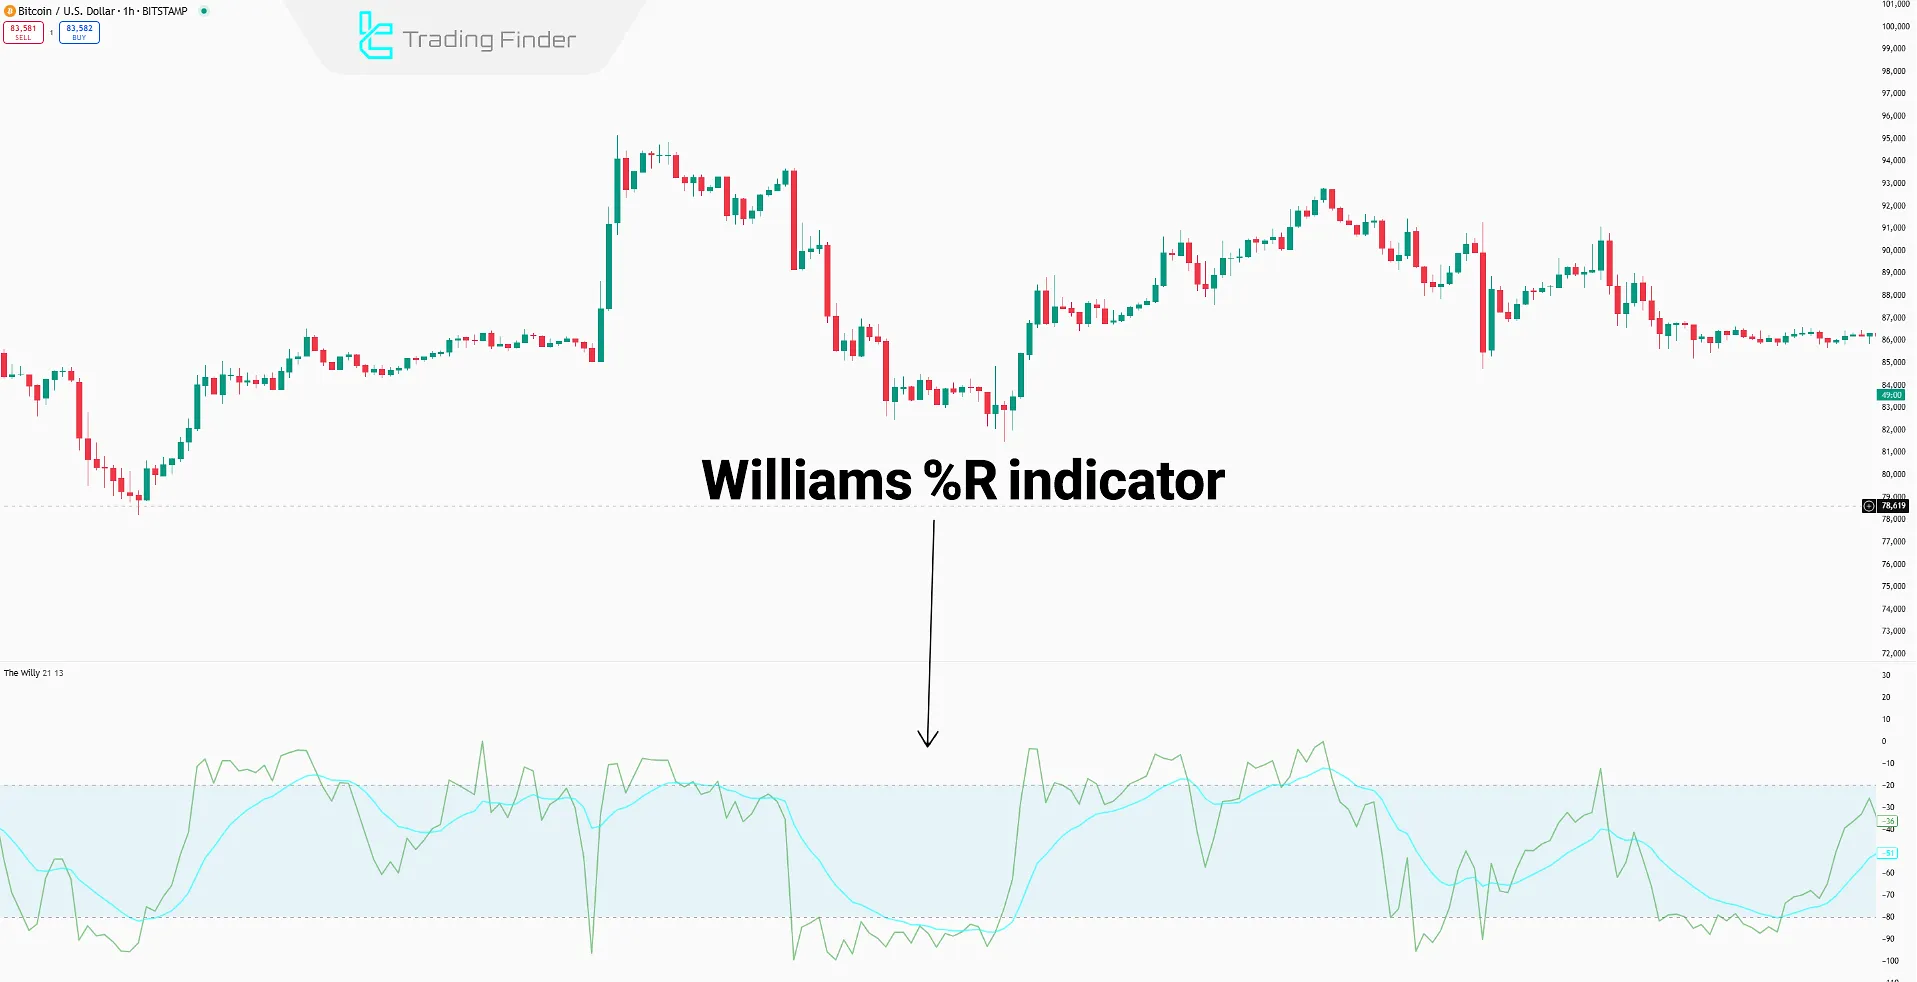
Williams %R
This indicator evaluates price fluctuations based on the highest and lowest prices over a specific period.
When the value drops below -80, it indicates oversold conditions and triggers a CALL signal. If it rises above -20, it reflects overbought conditions and signals a PUT trade.
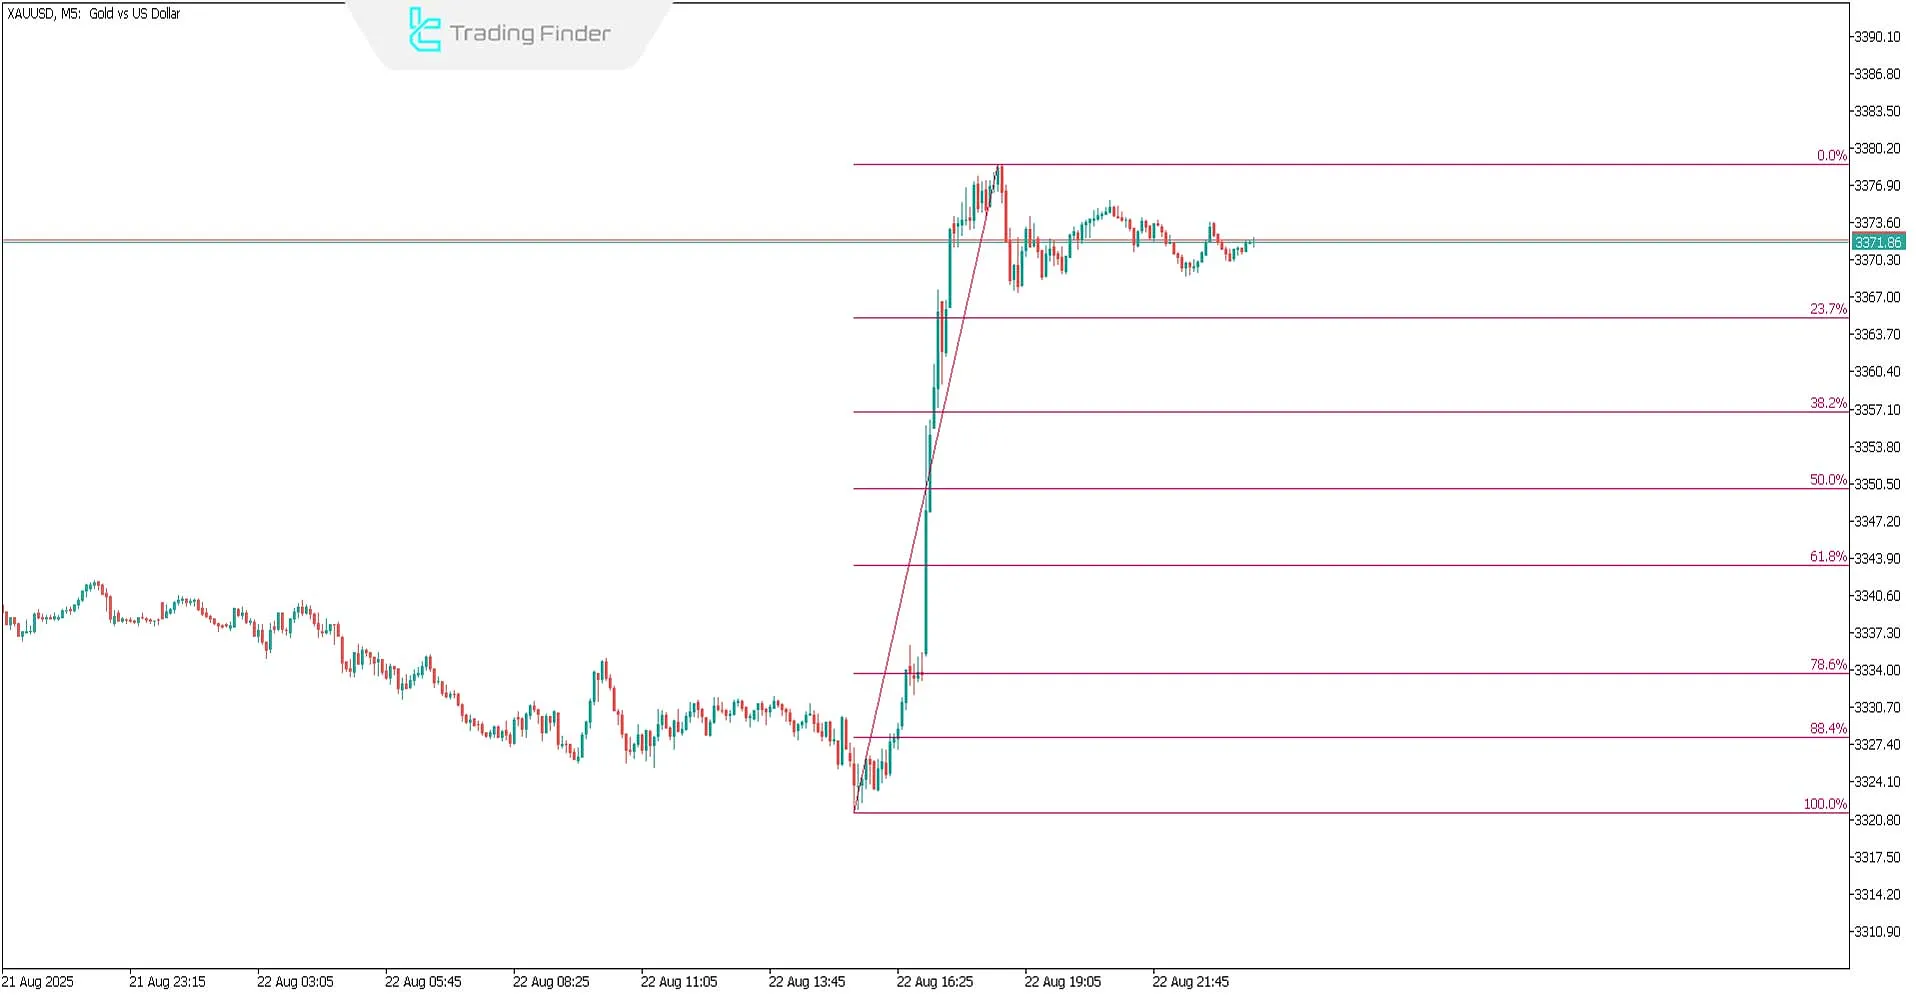
Fibonacci Indicator
The Fibonacci tool is used to identify potential levels of retracement or trend continuation. Key Fibonacci ratios such as 38.2%, 50%, and 61.8% are commonly recognized as points where the price tends to react after a strong movement.
In binary options trading, these levels serve as ideal zones for entering reversal or continuation trades. For instance, if the price corrects to the 61.8% level after a powerful bullish move and bullish signals appear, it creates favorable conditions to enter a Call trade.
For quick and easy application of Fibonacci levels, traders can use the Auto Fibonacci Indicator (Auto Fibo) by TradingFinder available on the MetaTrader platform.
- Download Auto Fibonacci Indicator (Auto Fibo) for MetaTrader 5
- Download Auto Fibonacci Indicator (Auto Fibo) for MetaTrader 4
Accumulation/Distribution Indicator (A/D)
The Accumulation/Distribution Indicator (A/D) is a volume-based indicator that analyzes the inflow and outflow of capital by examining the relationship between price and volume.
In binary options trading, if the price is rising while the A/D indicator shows a downward movement, a divergence occurs, increasing the likelihood of a trend reversal.
Conversely, when the indicator moves in the same direction as the price trend, the current trend is confirmed, allowing traders to enter Call or Put positions with greater confidence.
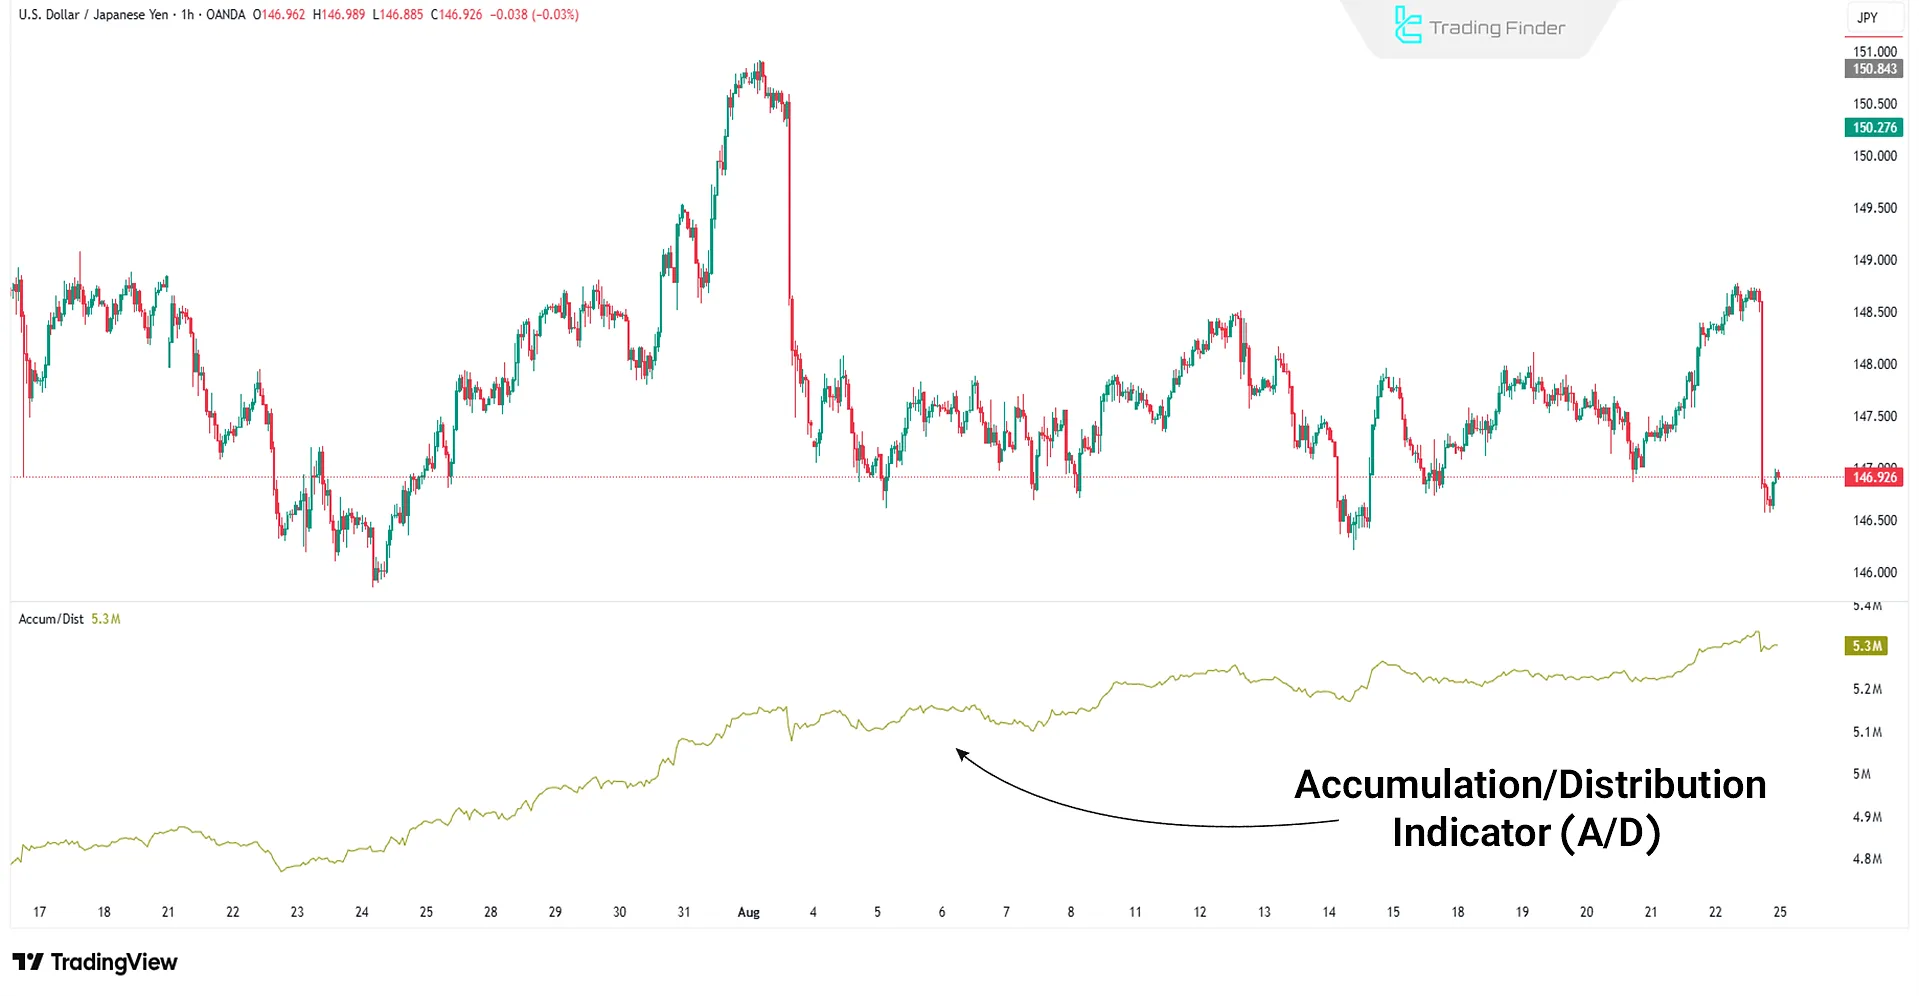
Table of Binary Options Indicator Settings and Entry/Exit Checklist
To properly use indicators in binary options trading, it is essential to be familiar with their appropriate settings.
For example, the recommended settings of RSI/MACD/Bollinger Bands for 1–5 minutes help traders benefit from more accurate signals on short timeframes.
Alongside this, having an entry/exit checklist ensures that signals are only considered valid when they align with technical conditions and reversal candlesticks.
For quick access, all these details are summarized in the table below, allowing you to review the settings of various indicators in one place:
Indicator Name | Recommended Settings | Suitable Timeframe | Application in PUT/CALL |
Alligator | Default | 5 minutes and above | The opening and closing of the lines indicate trend changes and suitable entry timing |
Moving Averages | MA 50/100 or short-term vs. long-term crossovers | 1–5 minutes | Crossovers provide buy/sell entry or exit signals |
Binary Winner | MAX BARS, ALERT, NOTIFICATION | 1–5 minutes | Green arrow = buy signal, Red arrow = sell signal |
ATR (Average True Range) | Period: 14 | Any timeframe | Measures market volatility to determine the best expiration time |
Awesome Oscillator | Default (34/5) | 1–5 minutes | Crossing the zero line indicates a price direction change |
ADX | Period: 14 | Above 5 minutes | Values above 25 confirm strong trends and favorable trading conditions |
DMI (Directional Movement Index) | +DI, -DI, ADX | 5 minutes and above | +DI above -DI = bullish confirmation, -DI above +DI = bearish confirmation |
Stochastic Oscillator | 14,3,3 with 20/80 levels | 1–5 minutes | Below 20 = buy signal, Above 80 = sell signal |
MACD | EMA 12/26 + Signal 9 | 5 minutes | MACD line crossing the signal line indicates trade entry/exit |
Automatic Support & Resistance | Default; customizable color settings | Any timeframe | Touching valid support = buy opportunity, touching valid resistance = sell opportunity |
RSI (Relative Strength Index) | Levels: 20/70 | 1–5 minutes | Above 70 = sell condition, Below 20 = buy condition |
Parabolic SAR | Default | 1–5 minutes | Switching from above to below candles = bullish confirmation; reverse = bearish confirmation |
Momentum | Period: 10 | 1–5 minutes | Crossing 100 signals the start of strong market movement |
CCI (Commodity Channel Index) | Level ±100 | 1–15 minutes | Above +100 = sell, Below -100 = buy |
DPO (Detrended Price Oscillator) | Period: 20 | 5 minutes | Strong positive = overbought, Strong negative = oversold |
Pivot Point | Daily levels | Any timeframe | Price nearing pivot levels with reversal candlesticks = buy/sell signals |
Bollinger Bands | Period: 20, Deviation: 2 | 1–15 minutes | Touching upper band = overbought, Touching lower band = oversold |
Williams %R | Levels −20/−80 | 1–5 minutes | Below −80 = buy signal, Above −20 = sell signal |
Fibonacci | Key ratios: 38.2%, 50%, 61.8% | Any timeframe | Identifies retracement or continuation levels; a bullish reaction at 61.8% can signal a Call, while a bearish reaction at the same level can signal a Put |
Accumulation/Distribution (A/D) | Default (calculated based on price and volume) | Any timeframe | Alignment of the indicator with the trend confirms continuation; divergence with price indicates a potential trend reversal, suitable for Put or Call trades |
Advantages and Disadvantages of Using Indicators in Binary Options
Using indicators in binary options helps generate quick entry and exit signals. However, there is always the possibility of signal errors. The table below compares the pros and cons of using indicators in binary trading:
Disadvantages | Advantages |
Signal delays | Filters out price noise |
False signals in ranging markets | Enables fast and simple decision-making |
Requires combination with other tools | Optimizes trade expiration timing |
Dependency on default settings | Identifies market trends |
Confusion from conflicting signals | Highly compatible with other tools |
Comparison of Indicators for Binary Options Trading
Binary options indicators differ not only in name and appearance but also in how they behave under specific market conditions.
For example, DMI is more effective in identifying strong trends, whereas Pivot Point focuses directly on key price levels.
The table below highlights these differences along with the strengths and weaknesses of each tool in binary options:
Indicator | Type of Indicator | Main Application in Binary Options |
Alligator | Trend-following | Identifies market trends via line spacing; entry during the “mouth opening/closing” |
Moving Average (MA) | Trend-following | Determines market direction; fast entry/exit signals via MA crossovers |
ATR (Average True Range) | Volatility | Measures real-time volatility and helps select the best expiration time |
Awesome Oscillator | Momentum | AO crossing zero = trend reversal signal; quick entry opportunity |
ADX | Trend Strength | Values above 25 confirm strong trends; filters for optimal trade timing |
Stochastic | Oscillator | Detects overbought/oversold at 20/80 levels; short-term PUT/CALL signals |
MACD | Trend + Momentum | Crossover of MACD and signal line indicates entry; detects overbought/oversold |
RSI | Oscillator | Below 30 = buy, Above 70 = sell; most effective on 1–5 minute timeframes |
Parabolic SAR | Trend-following | Point switch signals CALL or PUT entries |
Momentum | Momentum | Crossing 100 indicates strong moves; useful in volatile markets |
CCI | Oscillator | Above +100 = PUT, Below −100 = CALL; effective on 1–15 minute charts |
DPO | Detrending | Focuses on short-term cycles; positive = PUT, negative = CALL |
Pivot Point | Support/Resistance | Price reaction at main levels or R1/S1 provides CALL/PUT opportunities |
Bollinger Bands | Volatility | Touching upper band = PUT, lower band = CALL |
Williams %R | Oscillator | Below −80 = CALL (oversold), Above −20 = PUT (overbought) |
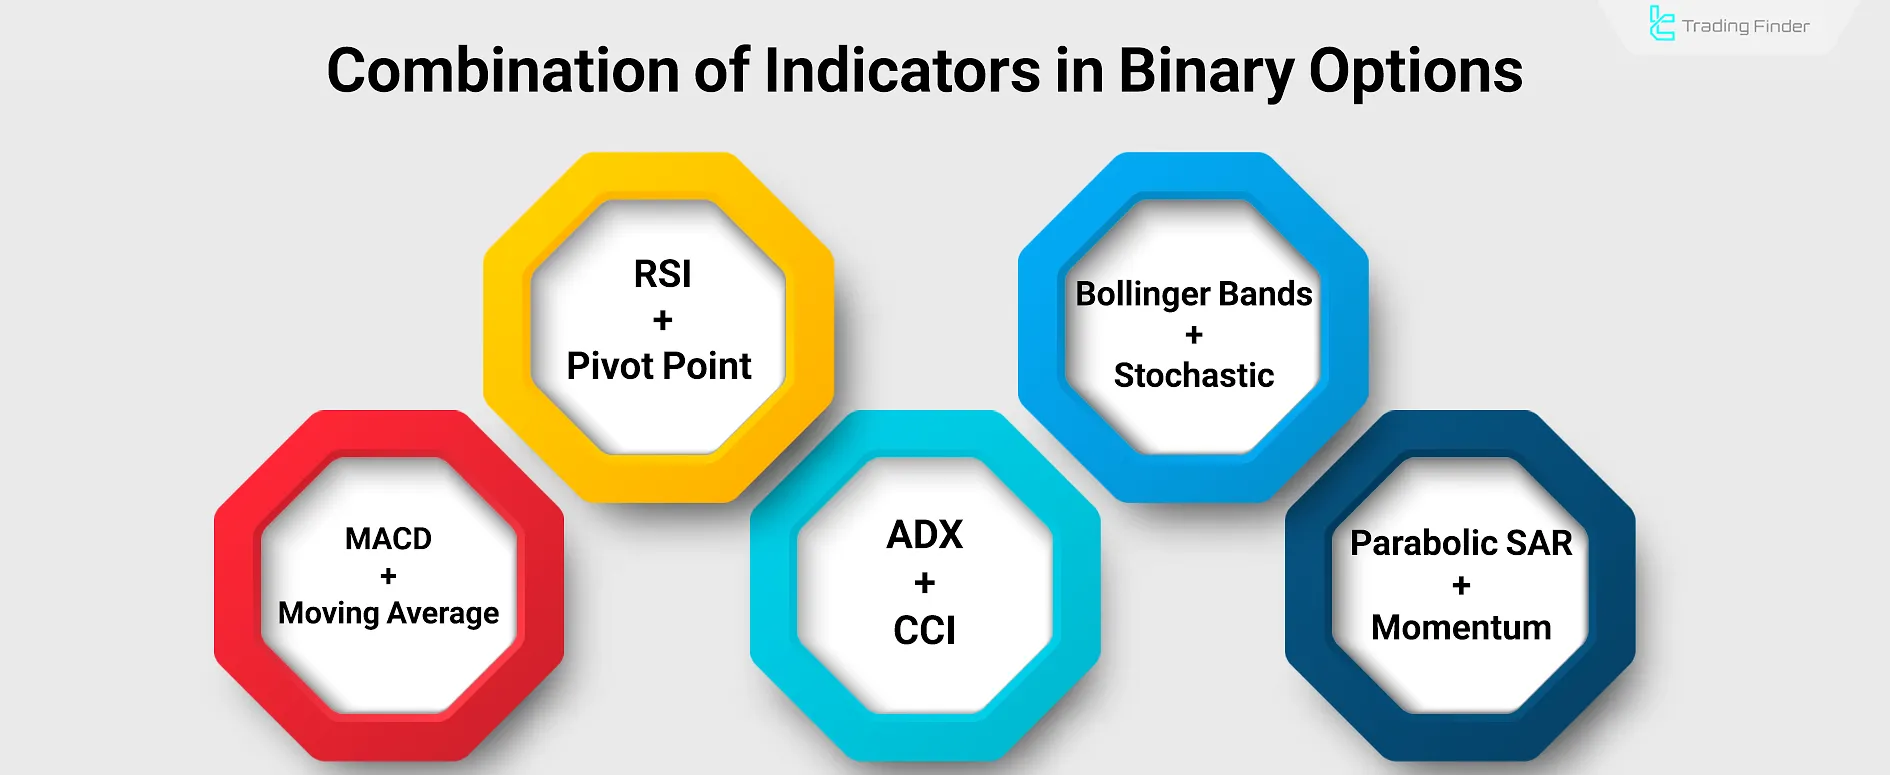
Combination of Indicators in Binary Options
Using only one indicator in binary options usually results in weaker signals and reduces the win rate of trades. Therefore, combining the best binary options indicators such as momentum tools with key price levels reduces market noise and filters out false signals.
- Bollinger Bands + Stochastic: Bollinger Bands display market volatility, while Stochastic identifies reversal points. In the EUR/USD market, simultaneous contact with the lower band and Stochastic entering the oversold zone generates a strong CALL signal;
- RSI + Pivot Point: When RSI reaches the overbought zone while price approaches a Pivot resistance, the likelihood of a bearish reversal increases. In gold (XAU/USD), this combination often signals a PUT entry;
- MACD + Moving Average: A MACD signal line crossover combined with the MA20 and MA50 crossover confirms a trend reversal. For example, in GBP/USD, this alignment suggests the start of a short-term uptrend;
- ADX + CCI: ADX measures trend strength, while CCI identifies entry/exit points. In the NASDAQ index, when ADX is above 25 and CCI exits oversold conditions, a CALL trade has higher probability;
- Parabolic SAR + Momentum: Parabolic SAR shows price reversal points, while Momentum confirms movement strength. In the WTI oil market, when SAR points appear below candles and Momentum rises positively, a reliable bullish binary signal is generated.
The Role of Market Psychology in Using Indicators for Binary Options Trading
Indicators in binary options are only effective when the trader also considers market psychology and emotional reactions.
For example, during moments when the release of an economic news event creates sudden excitement, signals from RSI or Stochastic may lead to either premature or delayed entries.
A trader who acts without risk management and without controlling emotions often falls into the trap of these false signals. Managing factors such as Fear of Missing Out (FOMO) or insistence on Revenge Trading helps traders interpret indicator signals more rationally.
In other words, market psychology plays the role of a “second filter,” ensuring that indicators alone do not misguide the decision-making process.
Guide to Choosing Indicators Based on Trading Strategy and Personality
One of the common misconceptions in financial markets is the attempt to find “the best indicator” as an absolute tool. No single indicator can address all market conditions, and the right choice should be made based on the trader’s strategy and personality traits:
- Short-term and risk-taking traders: Momentum indicators such as Stochastic and similar tools are effective for capturing rapid market movements;
- Trend-following and long-term traders: Trend-following indicators such as the Moving Average (MA) and the Average Directional Index (ADX) help identify the dominant market direction;
- Conservative traders: Combining a trend indicator with an oscillator, such as Exponential Moving Average (EMA) with the Relative Strength Index (RSI), is ideal for filtering signals.
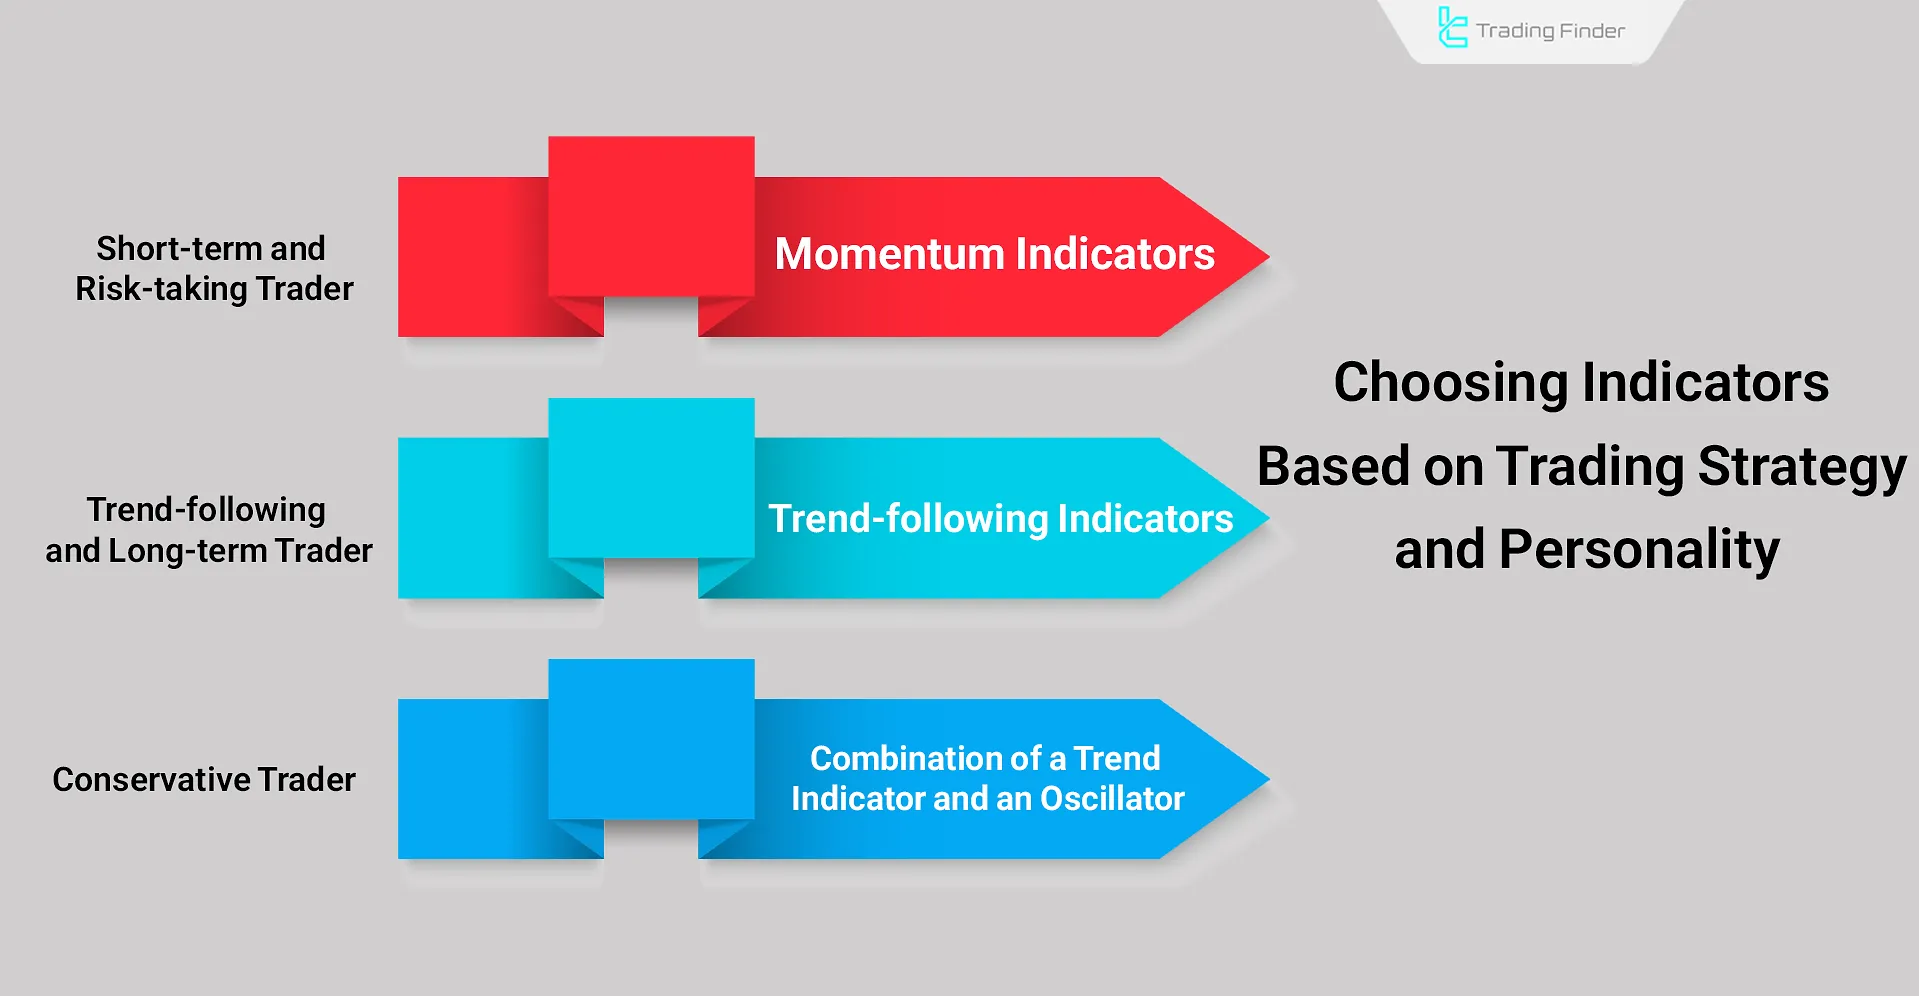
The final selection of indicators depends on the trading strategy, risk tolerance, investment horizon, and individual experience of the trader.
A logical combination of tools can enhance decision quality, but excessive use may lead to analysis paralysis and confusion.
Example of Choosing Indicators Based on Strategy and Trader Personality
Suppose three traders with different trading styles plan to operate on the EUR/USD pair:
- Trader 1 (Short-term and high-risk): Uses the 15-minute timeframe and relies on Stochastic, interpreting a rebound from the area below 20 in an uptrend as a quick entry signal;
- Trader 2 (Long-term and trend-based): Works on the daily timeframe, using the 50-day and 200-day Moving Averages to identify golden or death crosses as entry/exit signals and avoids ranging markets using ADX;
- Trader 3 (Conservative): Trades on the 4-hour timeframe, identifies trend direction using the EMA 50, and only enters buy positions when the price is above the EMA 50 and the RSI recovers from the oversold zone.
These three approaches demonstrate that indicator selection must align with the trader’s strategy, time horizon, and risk tolerance.
Conclusion
Filtering out price noise is one of the main benefits of using indicators in binary options. However, their performance varies depending on market conditions.
For example, trend-following indicators like Moving Averages perform faster and more effectively in trending markets, making them suitable for determining optimal entry times in binary trading. In contrast, oscillators like RSI are more effective in range-bound markets.


