


In technical analysis, support and resistance levels represent zones of supply and demand where significant price reactions often occur.
A Support and Resistance Indicator for Trading helps identify these zones and pinpoints key price levels.
Support and Resistance Indicators not only display static levels but also, through dynamic algorithms, identify psychological zones and reversal points across different timeframes.
Combining Volume Indicators and Oscillators enhances the reliability of these levels and provides more accurate entry and exit signals.
Introduction to 13 Support and Resistance Indicators
Indicators for Support and Resistance are tools used to detect price reversal zones. These indicators analyze price structure and levels to determine optimal entry, exit, stop-loss, and take-profit conditions with greater accuracy.
Best Support and Resistance Indicators:
- Auto Fibonacci Retracement Indicator
- Trendlines Indicator
- Ichimoku Cloud Indicator
- Support Resistance Major/Minor Indicator
- Linear Regression Channel Indicator
- Zone Indicator
- Pivot Point All-in-One Indicator
- Key Price Action Level Indicator
- Moving Average Indicator
- Donchian Channel Indicator
- VWAP Indicator (Volume Weighted Average Price)
- Camarilla Pivot Indicator
- Murrey Math Lines Indicator
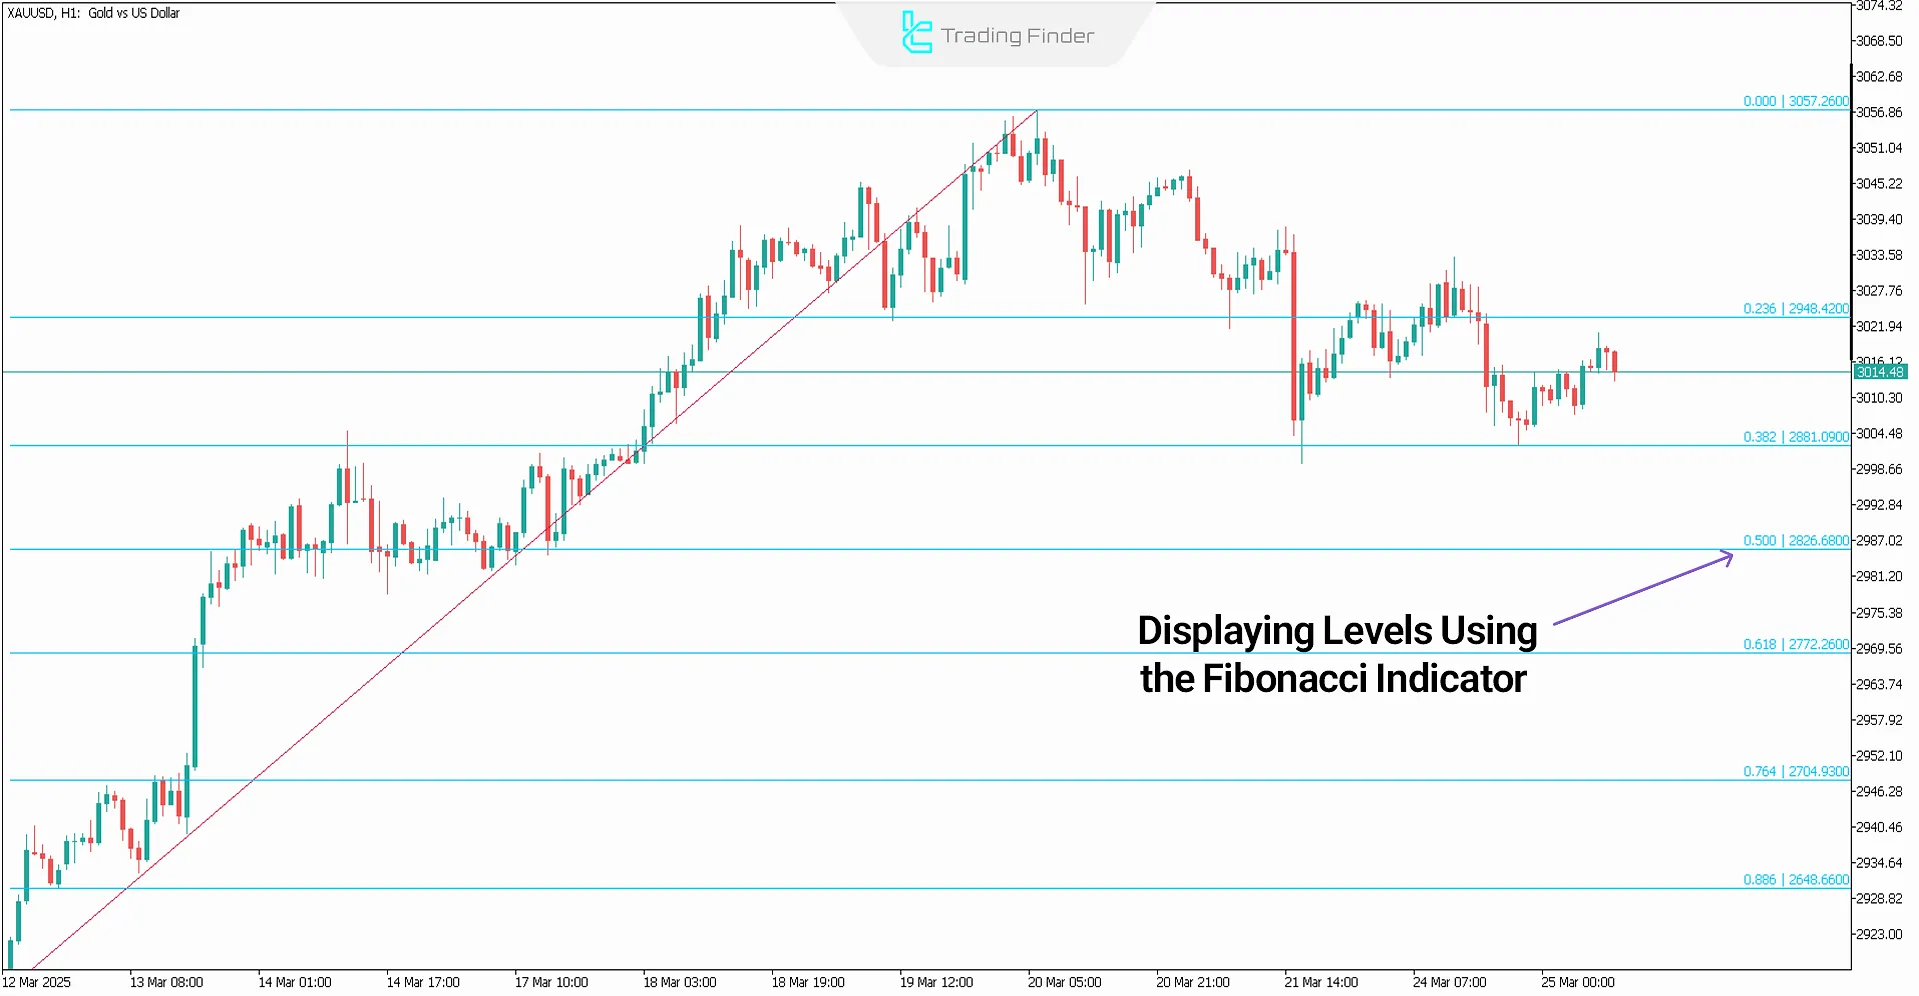
Auto Fibonacci Retracement Indicator
Fibonacci levels act as hidden zones of support and resistance within trend structures. By identifying key retracement points, they offer accurate entry and exit opportunities.
The Auto Fibonacci Indicator enhances this process by detecting these levels automatically.
Available on:
- Auto Fibonacci Retracement Indicator for MetaTrader 4
- Auto Fibonacci Retracement Indicator for MetaTrader 5
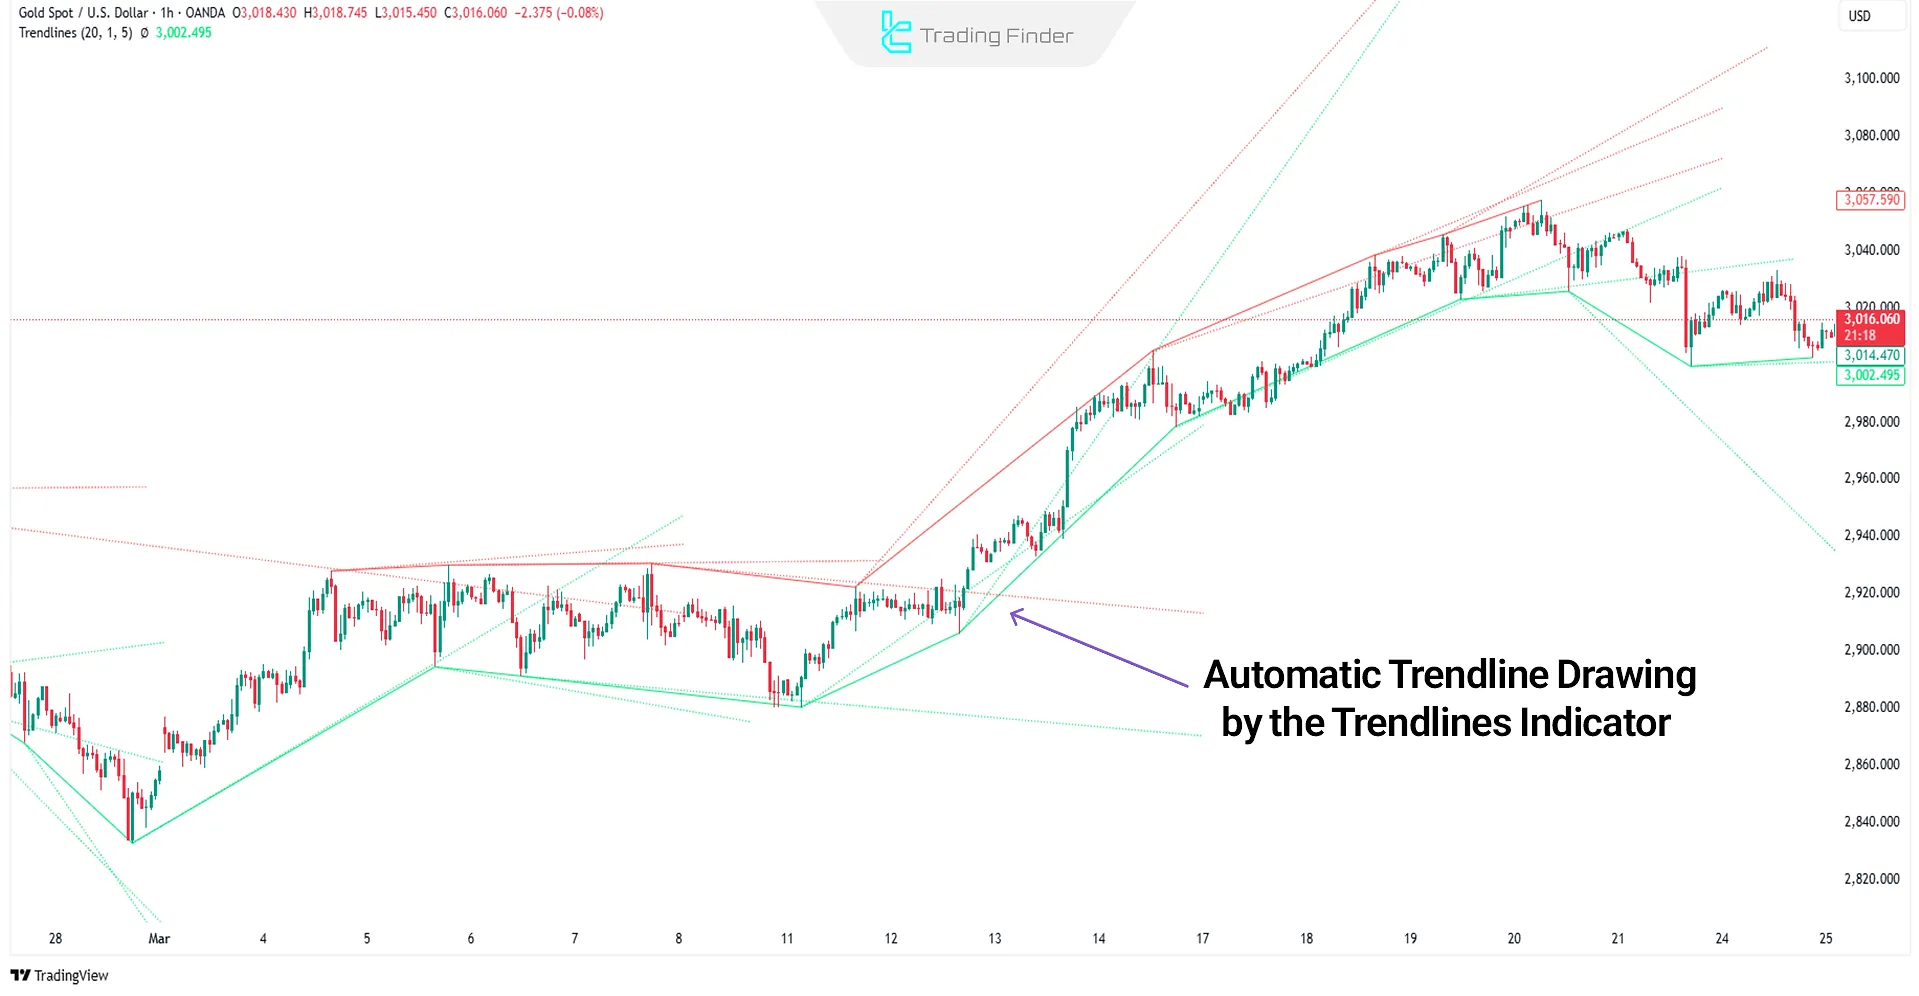
Trendlines Indicator
In technical analysis, trendlines represent dynamic support and resistance levels and are vital for determining trend direction.
The Trendlines Indicator on TradingView offers automatic trendline plotting to simplify market structure analysis.
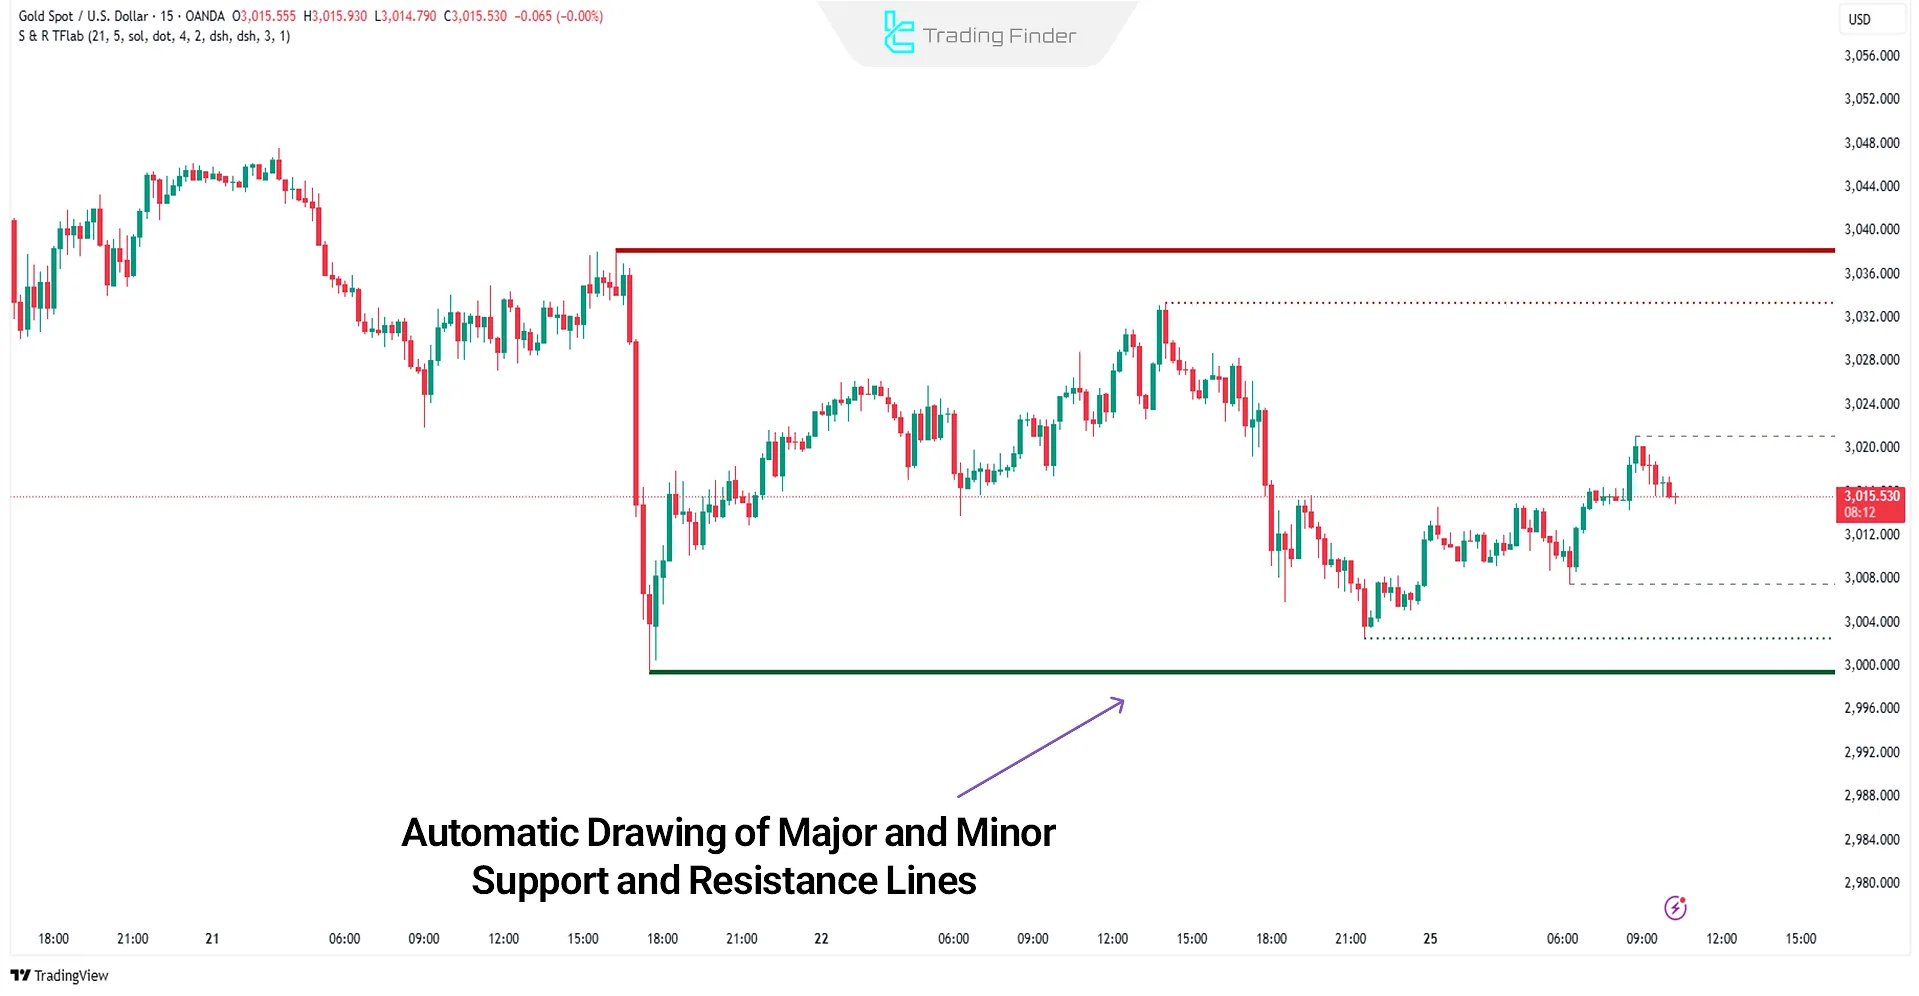
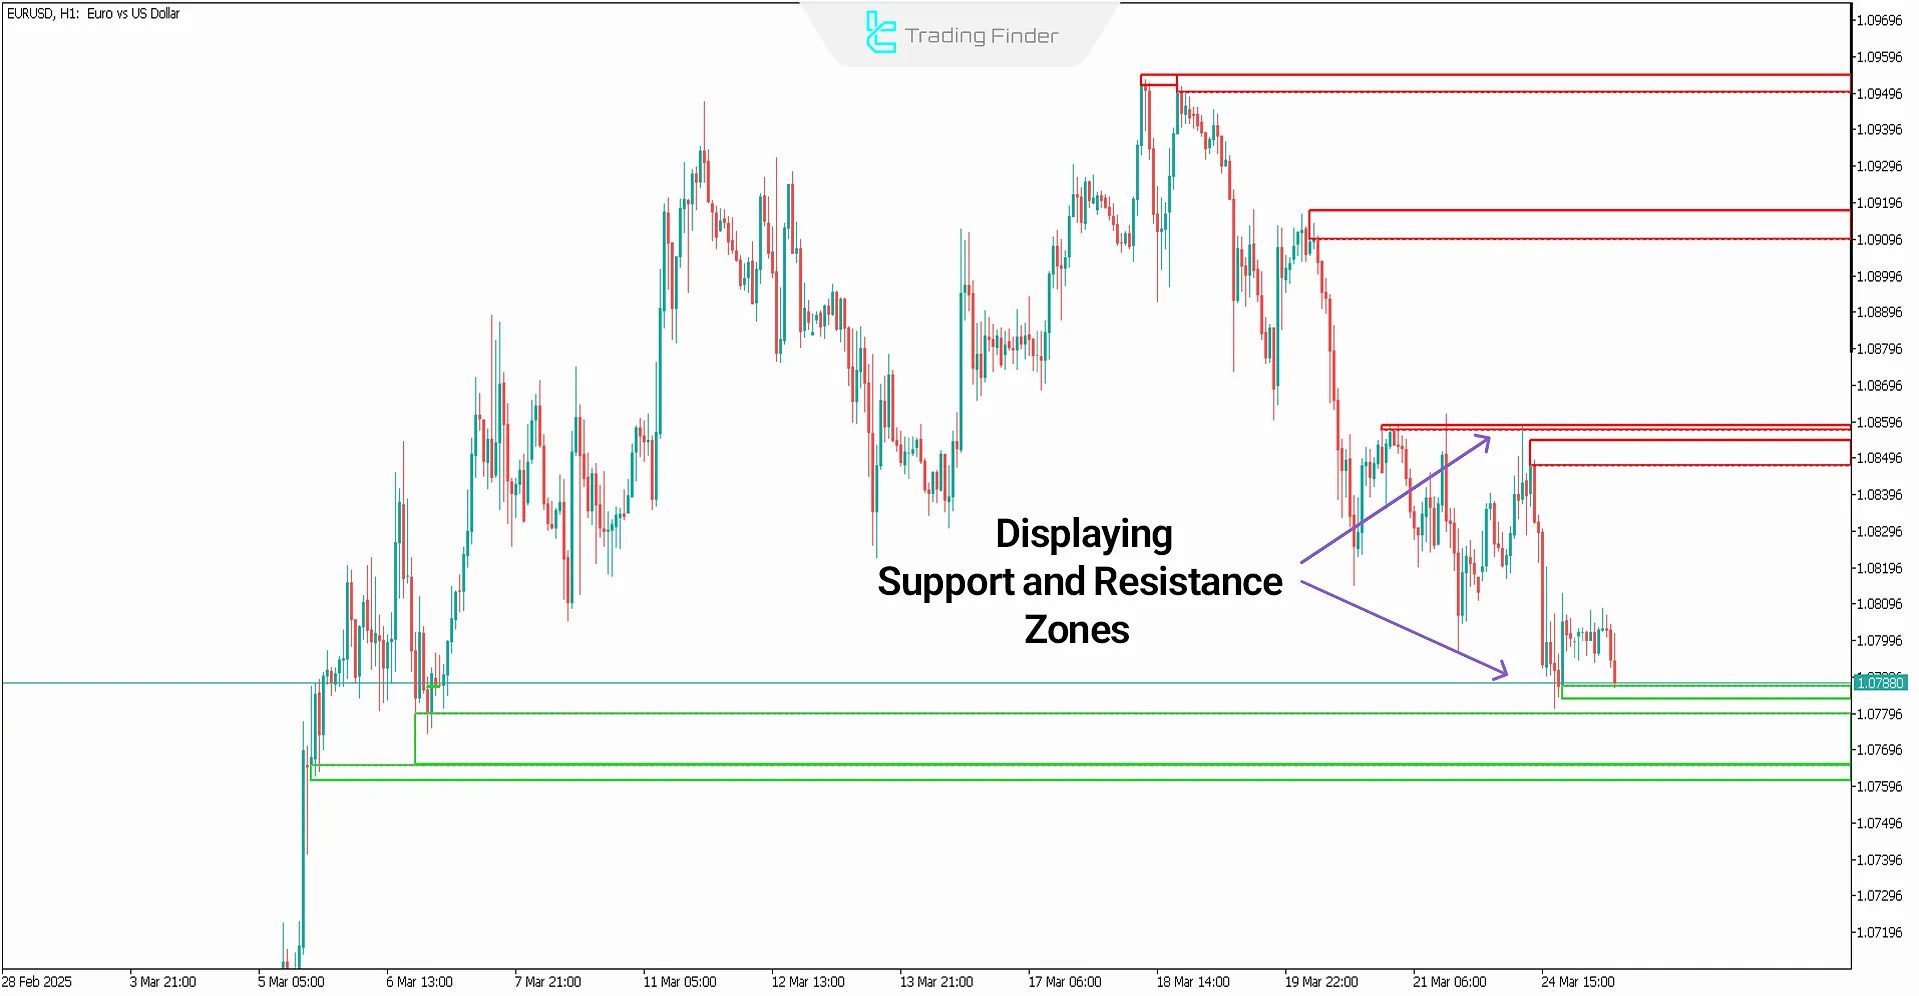
Support Resistance Major/Minor Indicator
Major and Minor support and resistance levels form around significant highs and lows where orders are likely to be executed.
The Support Resistance Major/Minor Indicator for TradingView highlights these zones clearly for quick analysis.
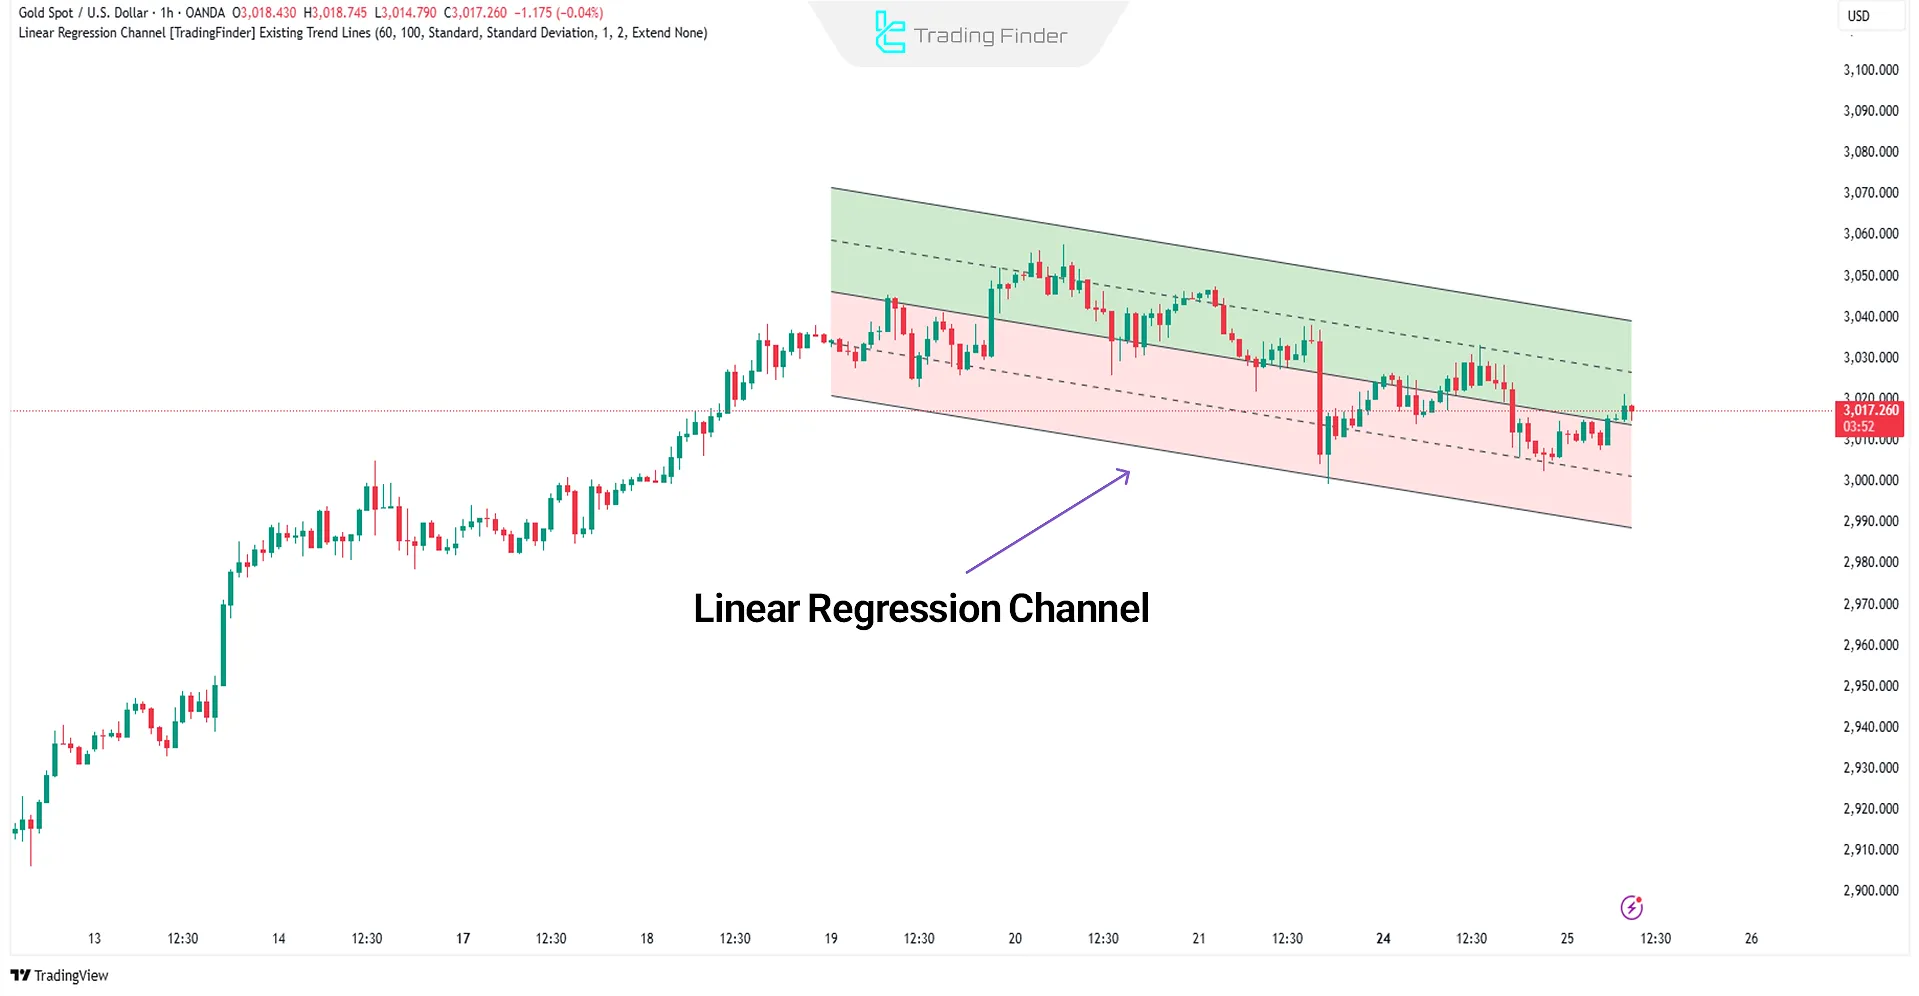
Linear Regression Channel Indicator
Price channels display dynamic support and resistance zones within market trends.
The Linear Regression Channel Indicator auto-plots parallel lines to outline the current price channel, aiding in volatility analysis.
This indicator is Available on:
- Linear Regression Channel Indicator on TradingView
- Linear Regression Channel Indicator for MetaTrader 4
- Linear Regression Channel Indicator for MetaTrader 5
Zone Indicator
The Zone Indicator identifies support and resistance zones based on historical price behavior.
It highlights key areas with green for support and red for resistance, offering enhanced clarity of sensitive market levels. Available on:
- Zone Indicator for MetaTrader 4
- Zone Indicator for MetaTrader 5
- Zone Indicator for TradingView
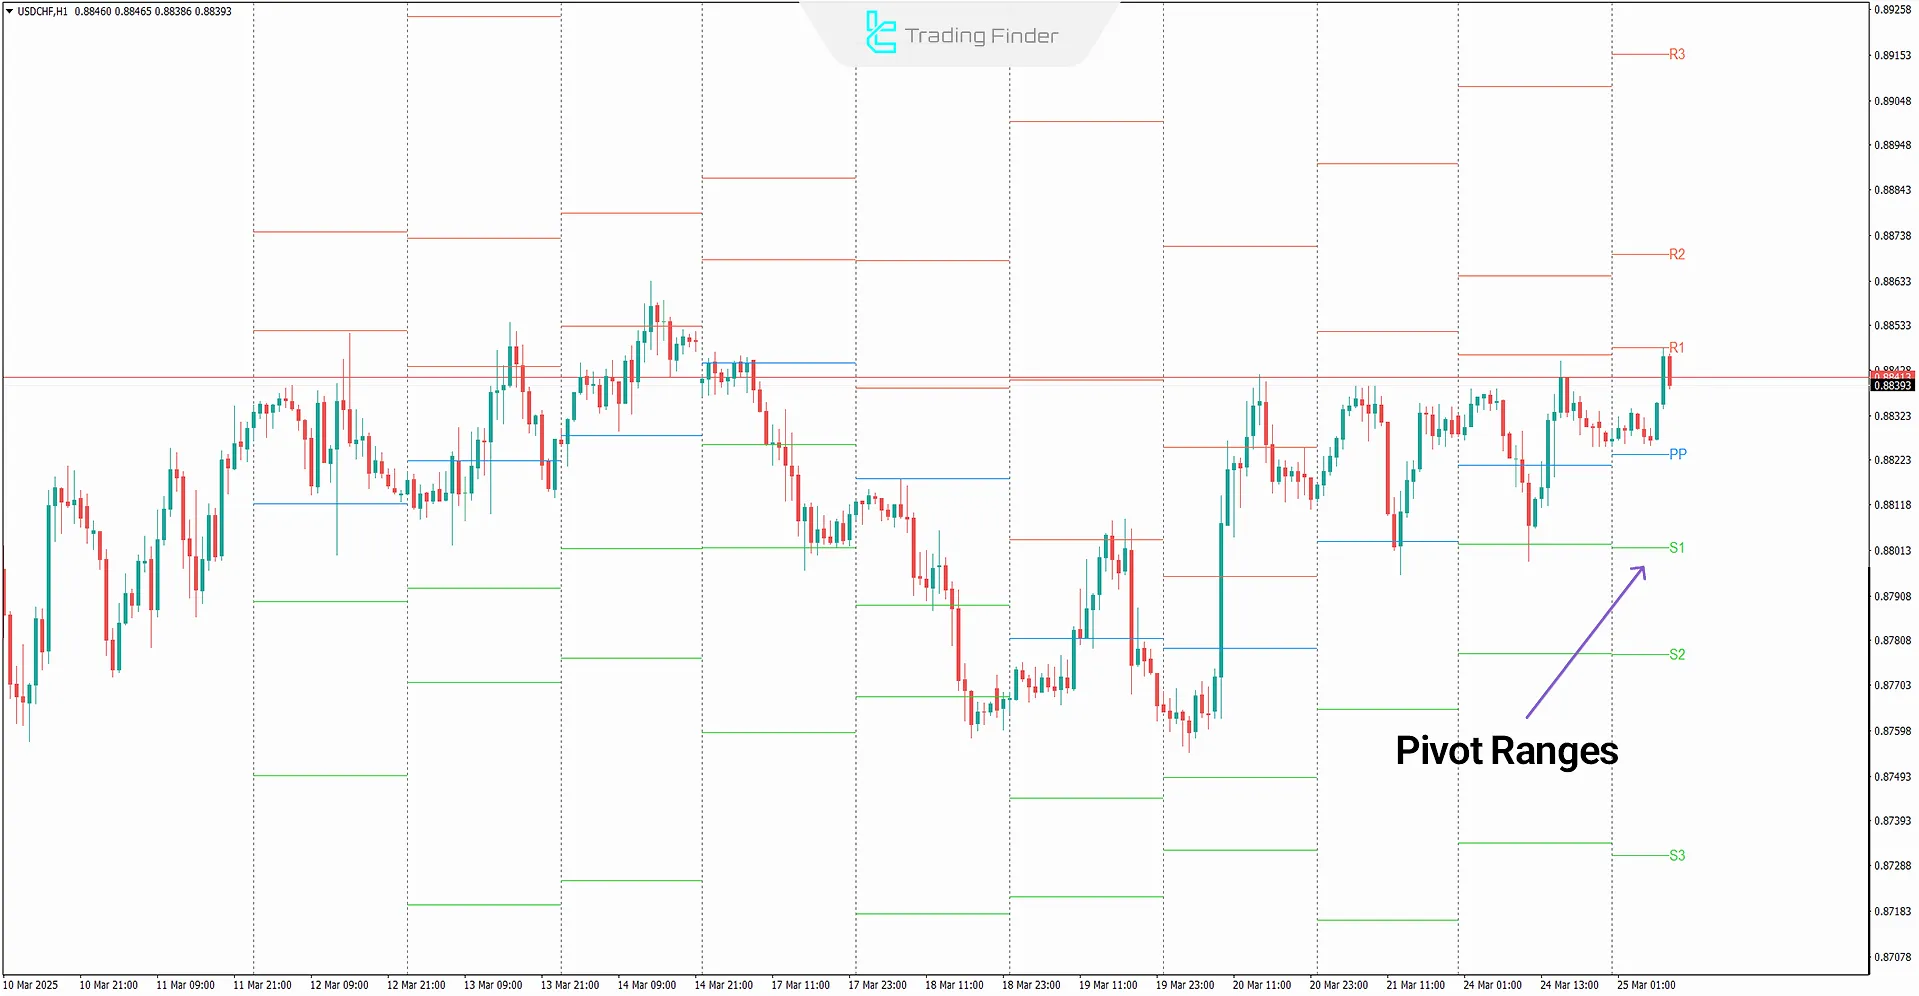
Pivot Point All-in-One Indicator
Pivot Points are vital support and resistance zones based on previous price data, widely used to determine entry, exit, and reversal levels.
The Forex Pivot Points Calculator Tool by TradingFinder is available for free on:
- Pivot Point All-in-One Indicator for MetaTrader 4
- Pivot Point All-in-One Indicator for MetaTrader 5
- Pivot Point All-in-One Indicator for TradingView
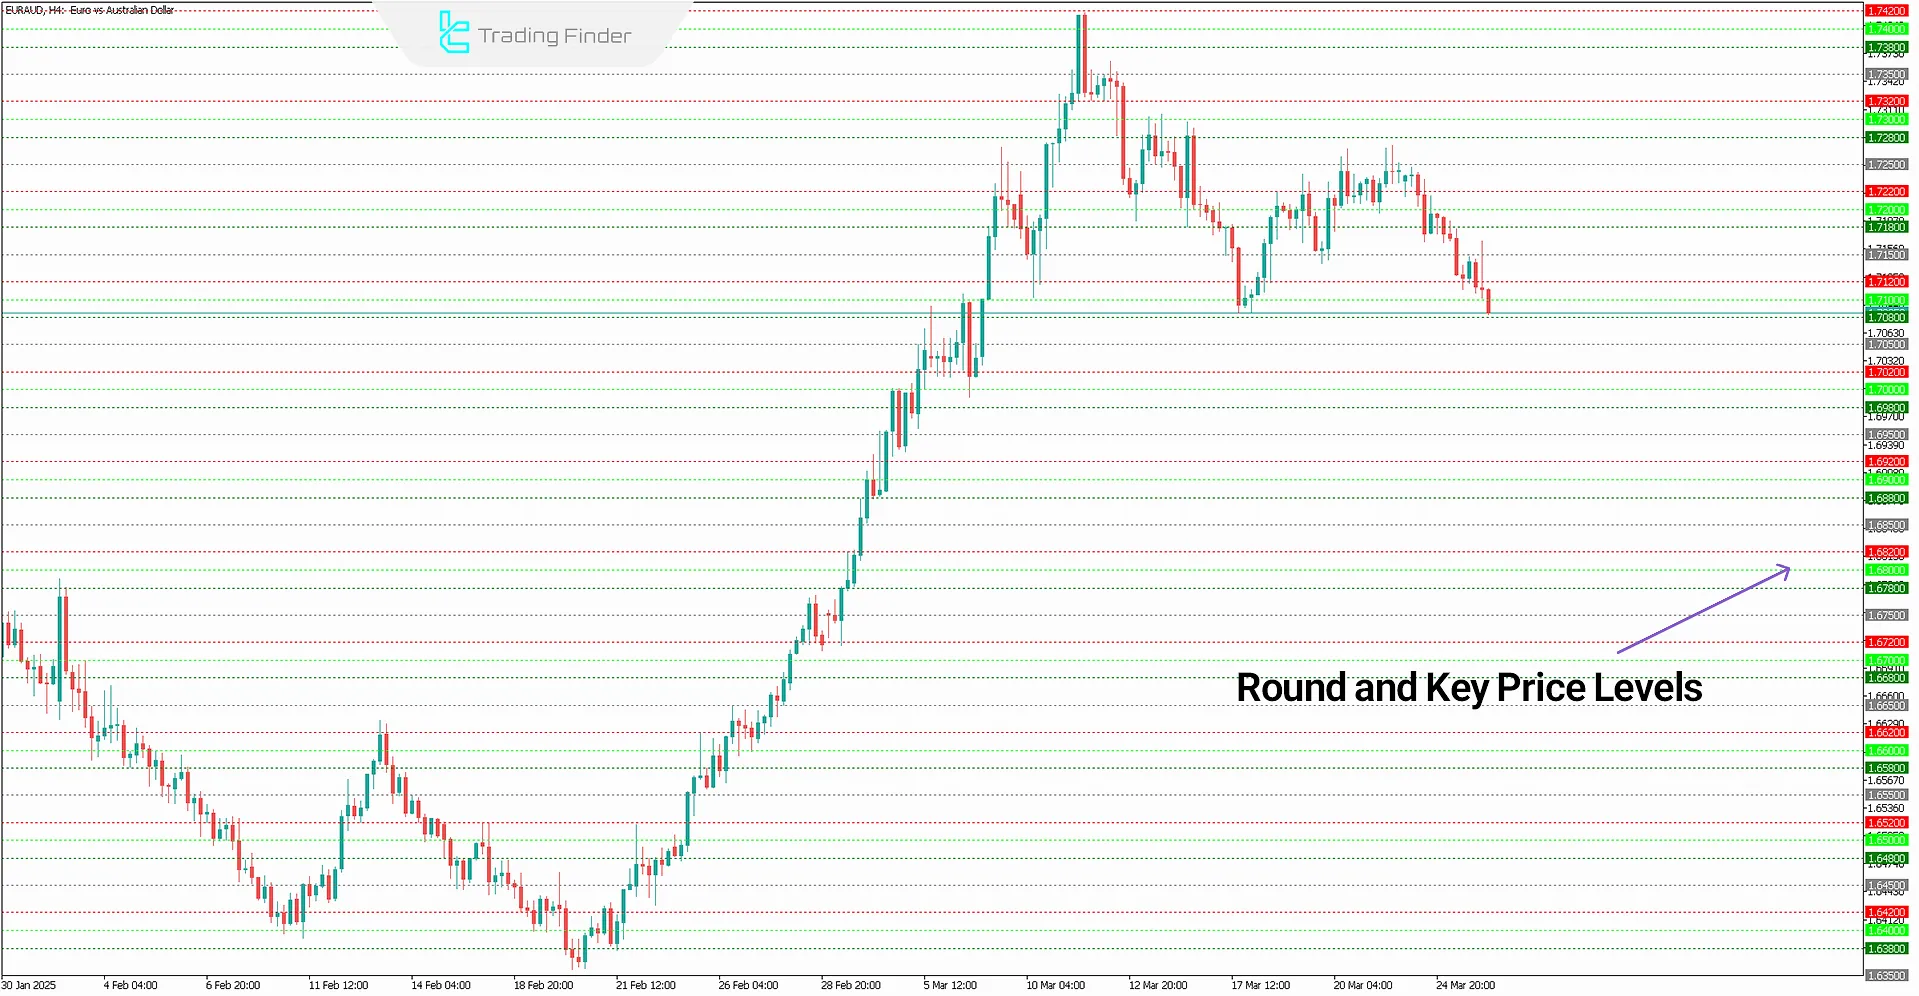
Key Price Action Level Indicator
This indicator detects round-number levels and price action zones, helping traders identify where historical price activity occurred.
It acts as a supply and demand indicator; Available on:
- Key Price Action Level Indicator for MetaTrader 4
- Key Price Action Level Indicator for MetaTrader 5
- Key Price Action Level Indicator for TradingView
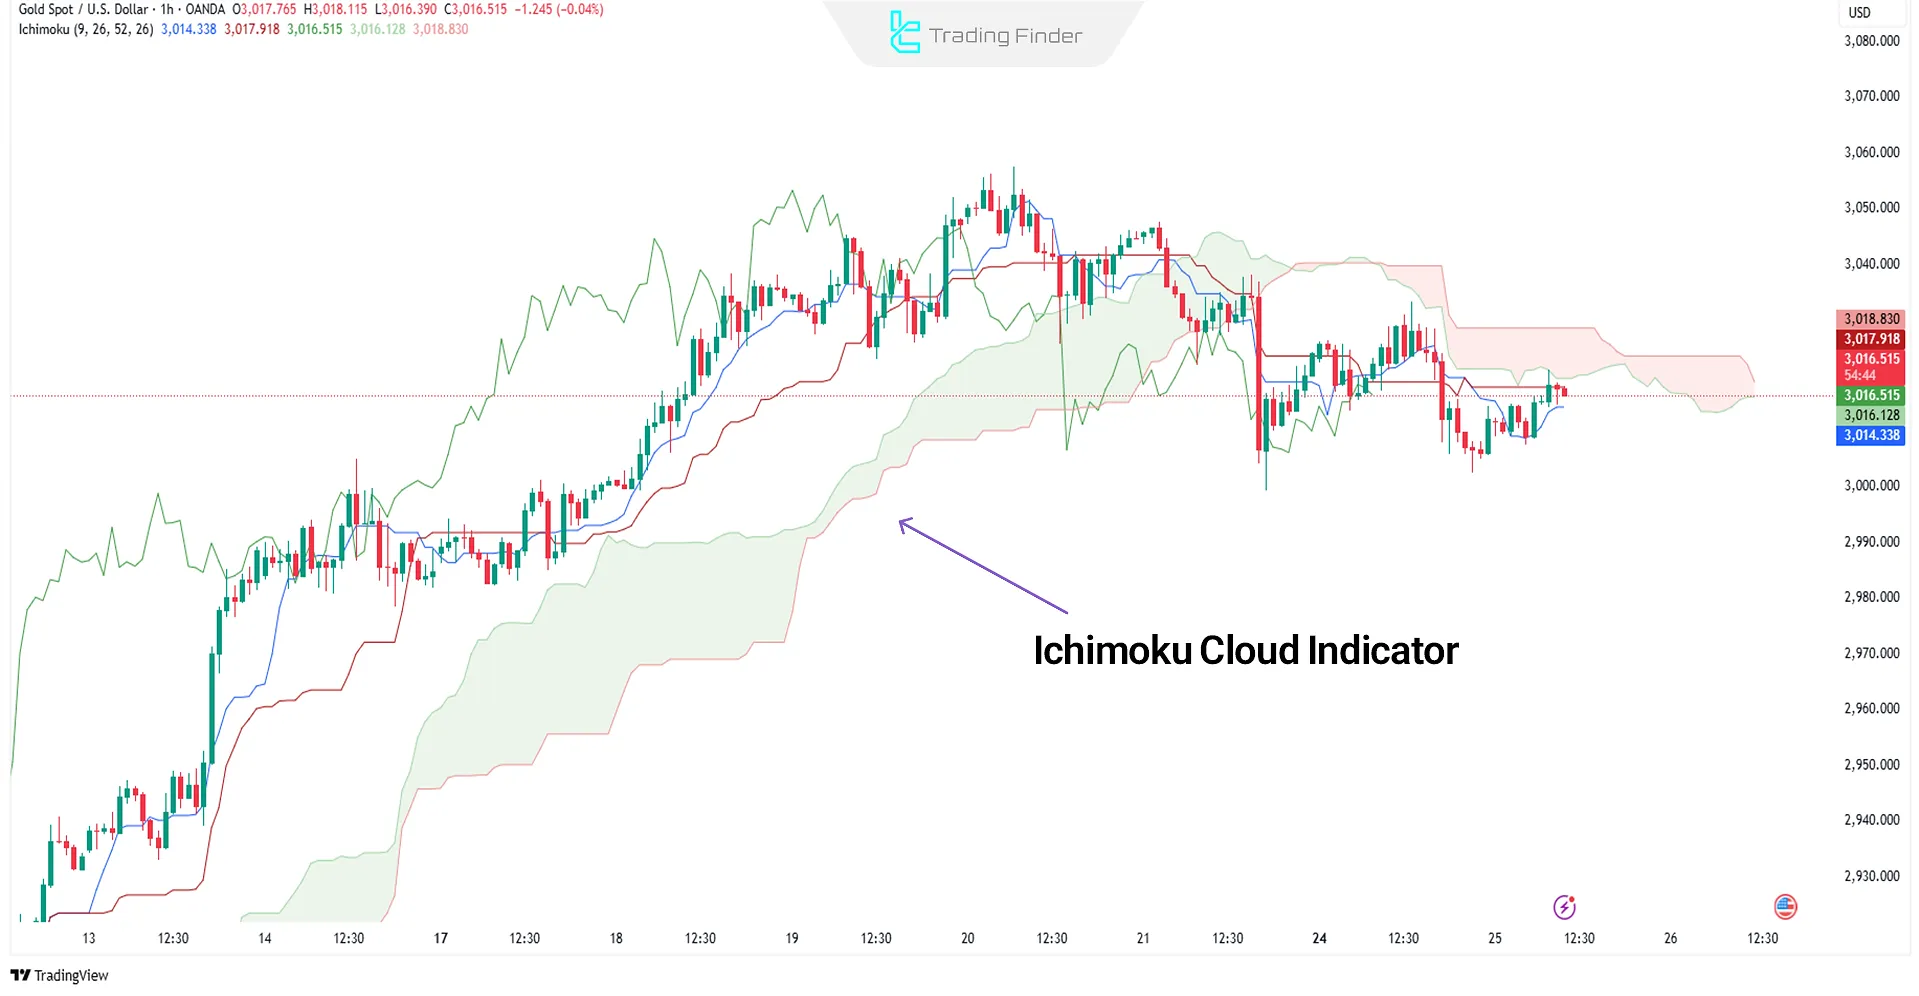
Ichimoku Cloud Indicator
The Ichimoku Cloud indicator is an advanced tool for precise analysis of supply and demand zones. It consists of several components, each capable of generating signals independently.
The combination of these elements forms a comprehensive trading system that integrates both dynamic and static support and resistance levels, providing a cohesive view of overall market conditions.
For more information and guidance on using the Ichimoku indicator, you can refer to the article Technical Analysis Education with the Ichimoku Indicator on theinvestopedia.com website.
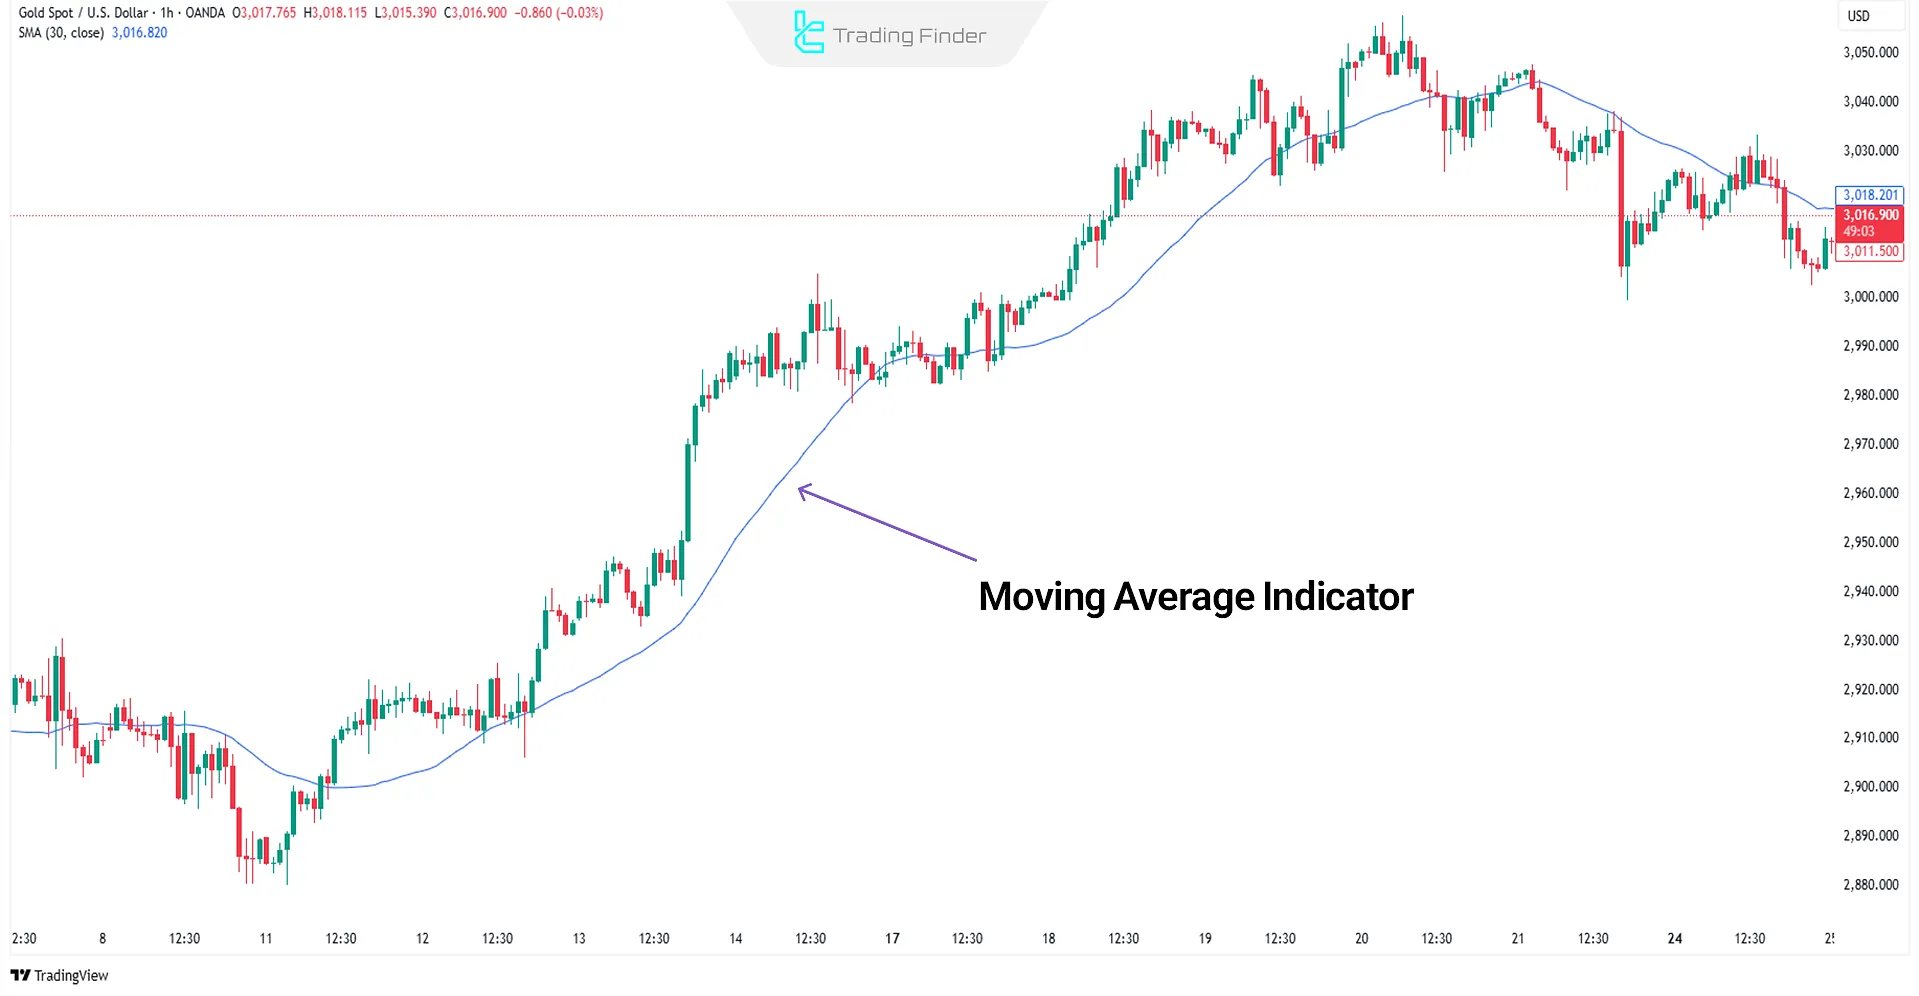
Moving Average Indicator
The Moving Average is one of the most common dynamic support/resistance tools in trading.
Available as Simple (SMA) and Exponential (EMA) versions, it can be tailored to any timeframe and market condition.
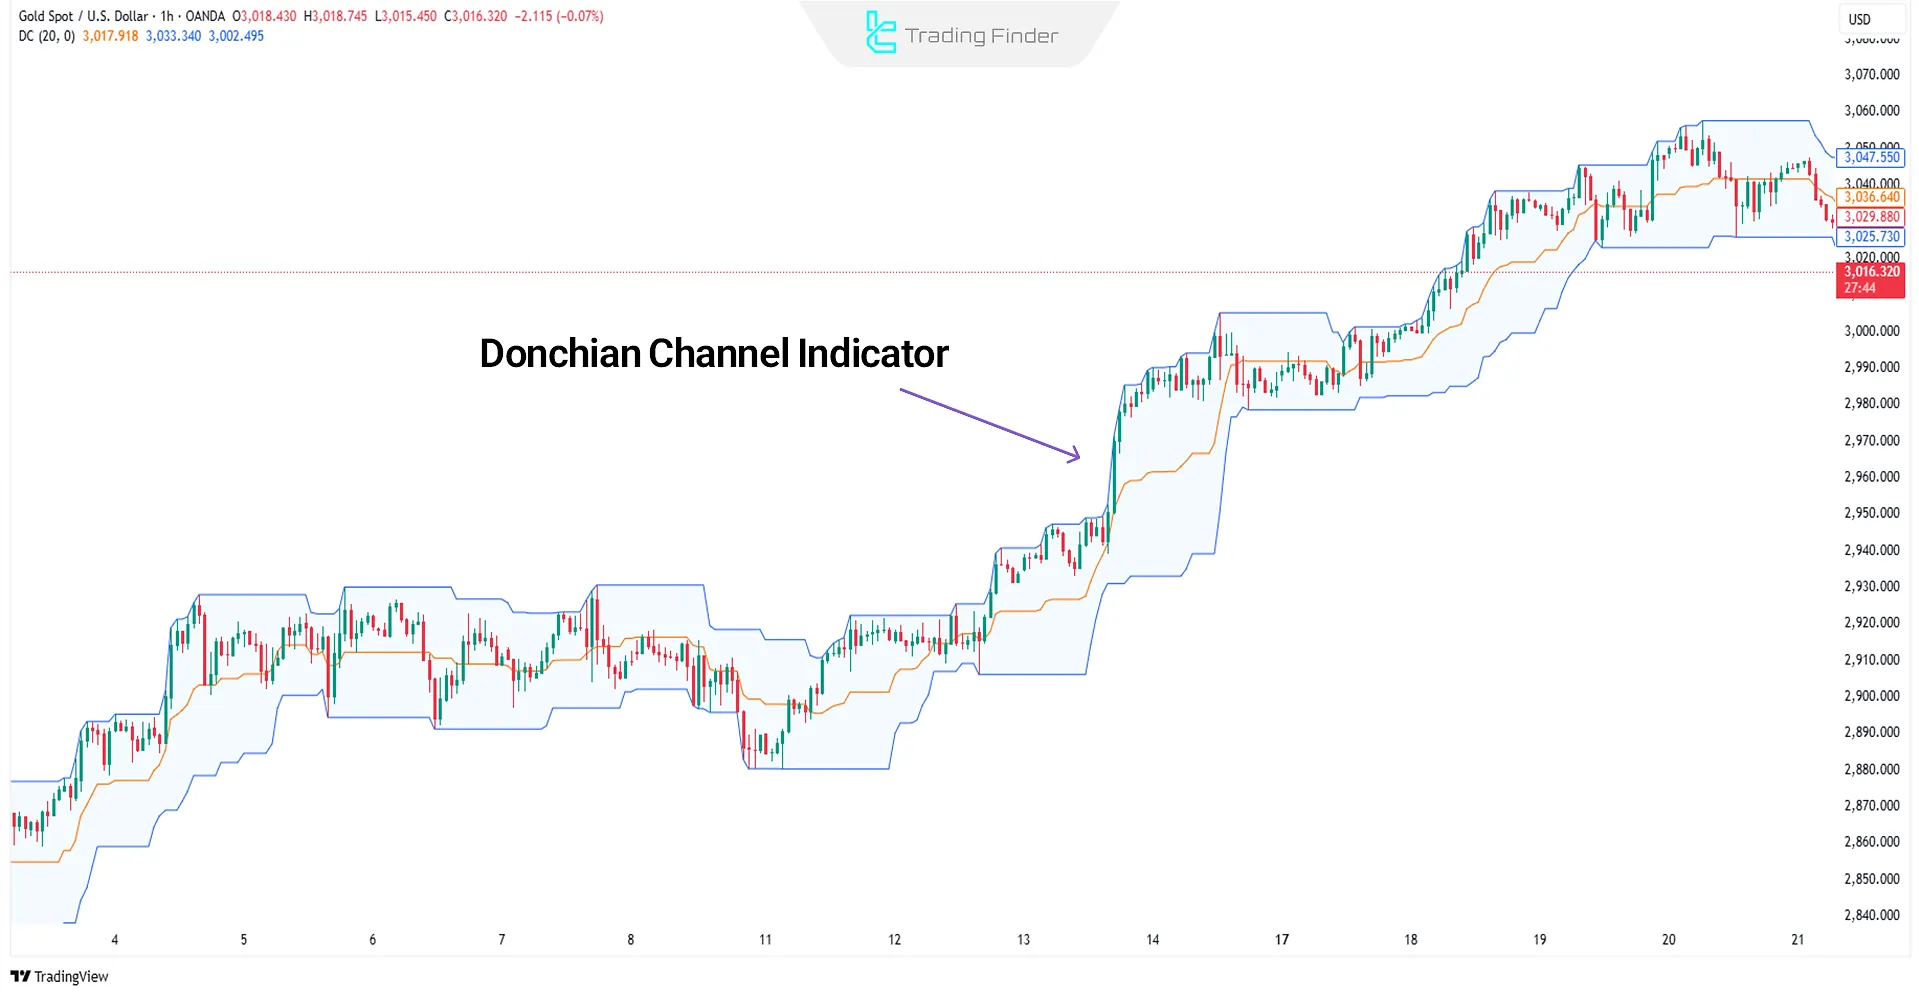
Donchian Channel Indicator
The Donchian Channel identifies dynamic support and resistance zones based on highest highs and lowest lows over a defined period.
It's especially effective for breakout and trend-following strategies, with greater accuracy in higher timeframes.
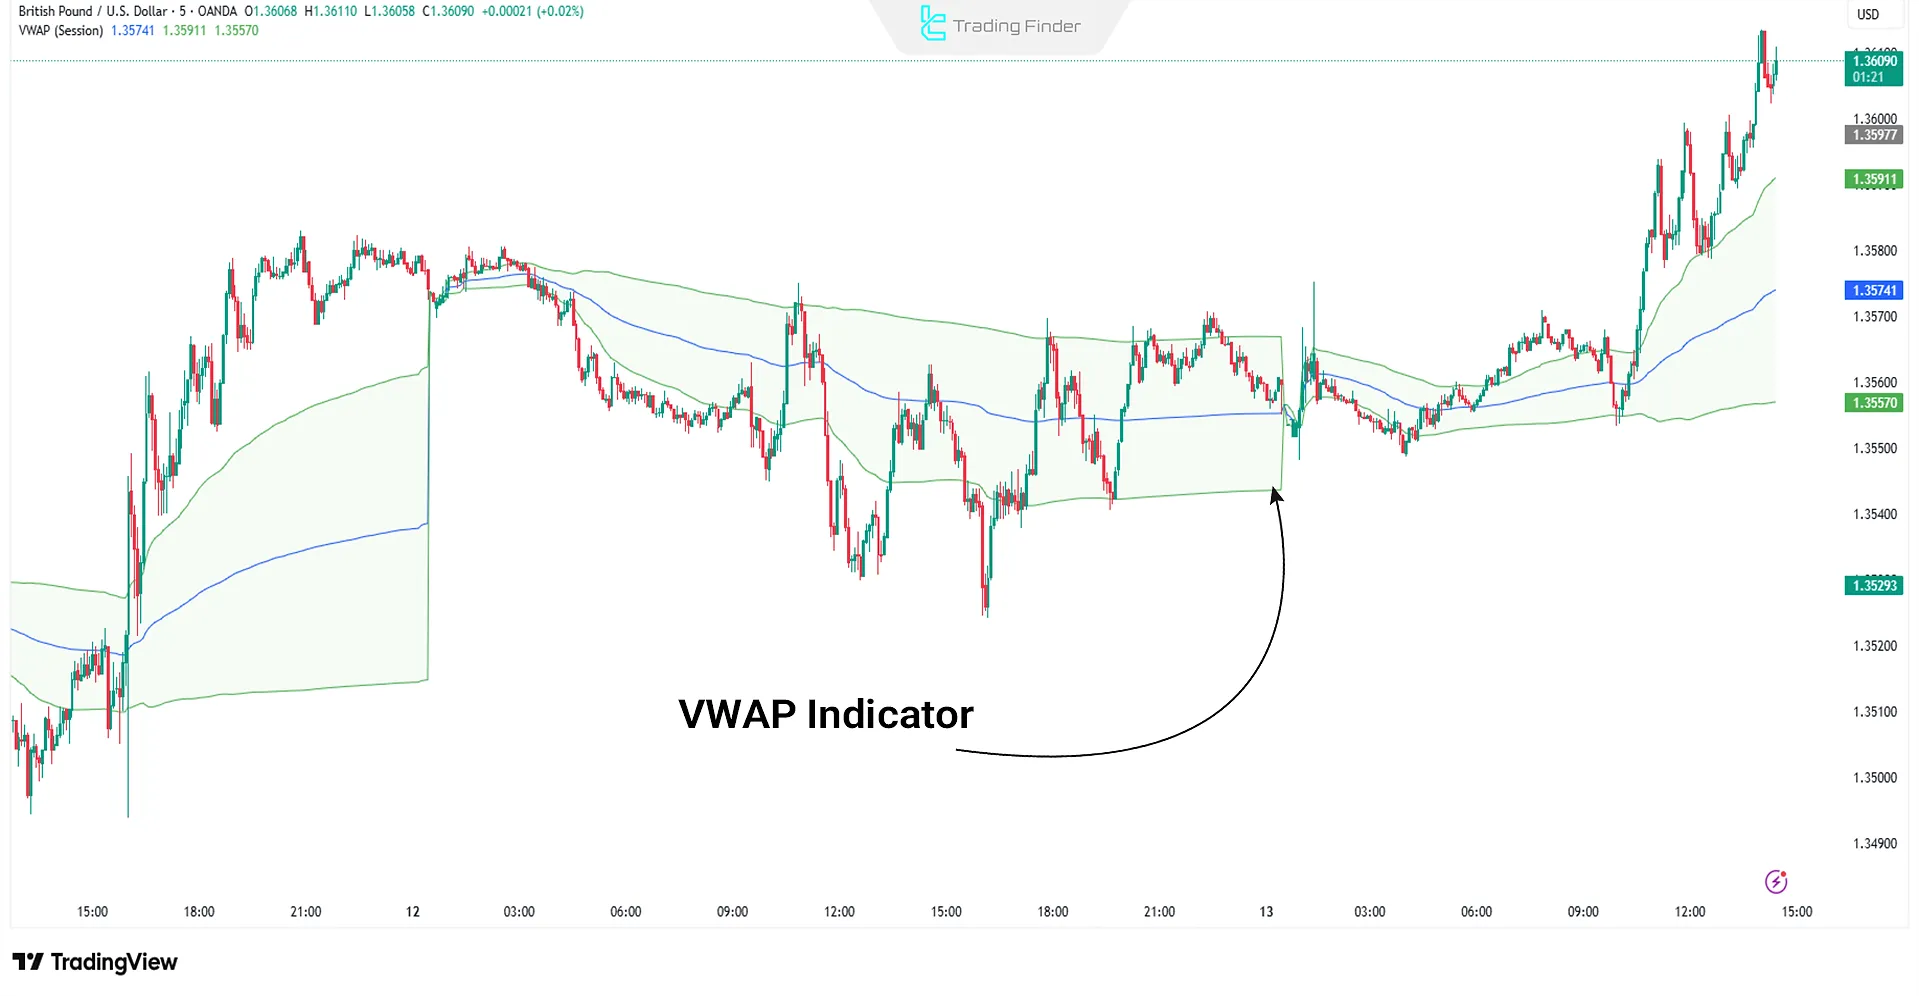
VWAP Indicator (Volume Weighted Average Price)
The VWAP (Volume Weighted Average Price) indicator calculates the weighted average price based on volume and serves as one of the key tools for identifying dynamic support and resistance levels.
It highlights high-volume market areas and provides precise entry and exit points for intraday trades.
In addition, the VWAP indicator enables the analysis of order flow and the identification of accumulation and distribution zones, revealing institutional traders’ behavior.
For more information and instructions on how to use the VWAP indicator, you can refer to the educational video on Tom Crown’s YouTube channel:
Combining VWAP with multiple timeframes and Volume Indicators enhances the accuracy of entry and exit signals and reduces trading risk.
A price crossover above or below the VWAP line can signal a trend reversal or confirm continuation, forming a solid foundation for scalping and intraday trading strategies.
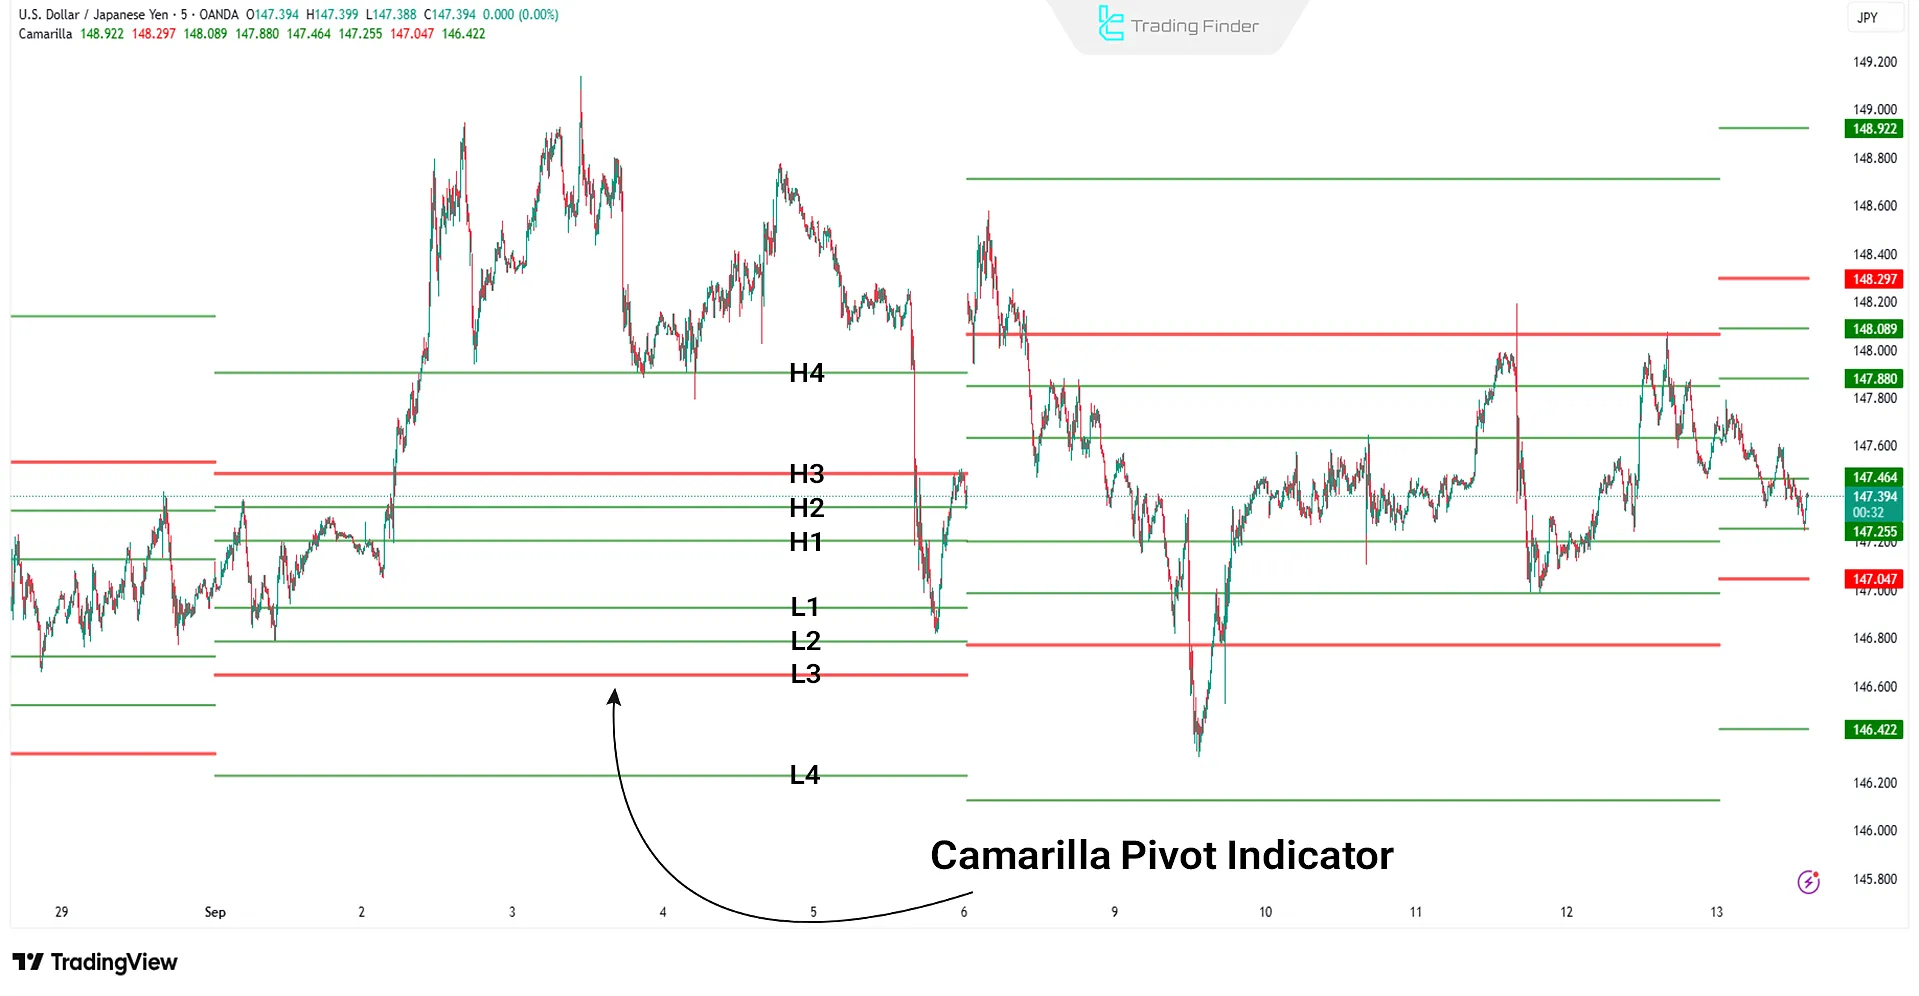
Camarilla Pivot Indicator
The Camarilla Pivot indicator is an advanced version of the traditional Pivot Point that, in addition to the classic levels, calculates four key levels: H3, H4, L3, and L4.
These levels pinpoint precise price reversal or breakout zones in scalping trades and allow entries and exits based on psychological market areas.
A common strategy involves buying near the L3 zone and selling around the H3 zone, while a valid breakout above H4 or below L4 is considered a signal for a new trend initiation.
Combining the Camarilla Pivot with momentum and volume indicators filters out false signals and significantly enhances the accuracy of technical analysis.
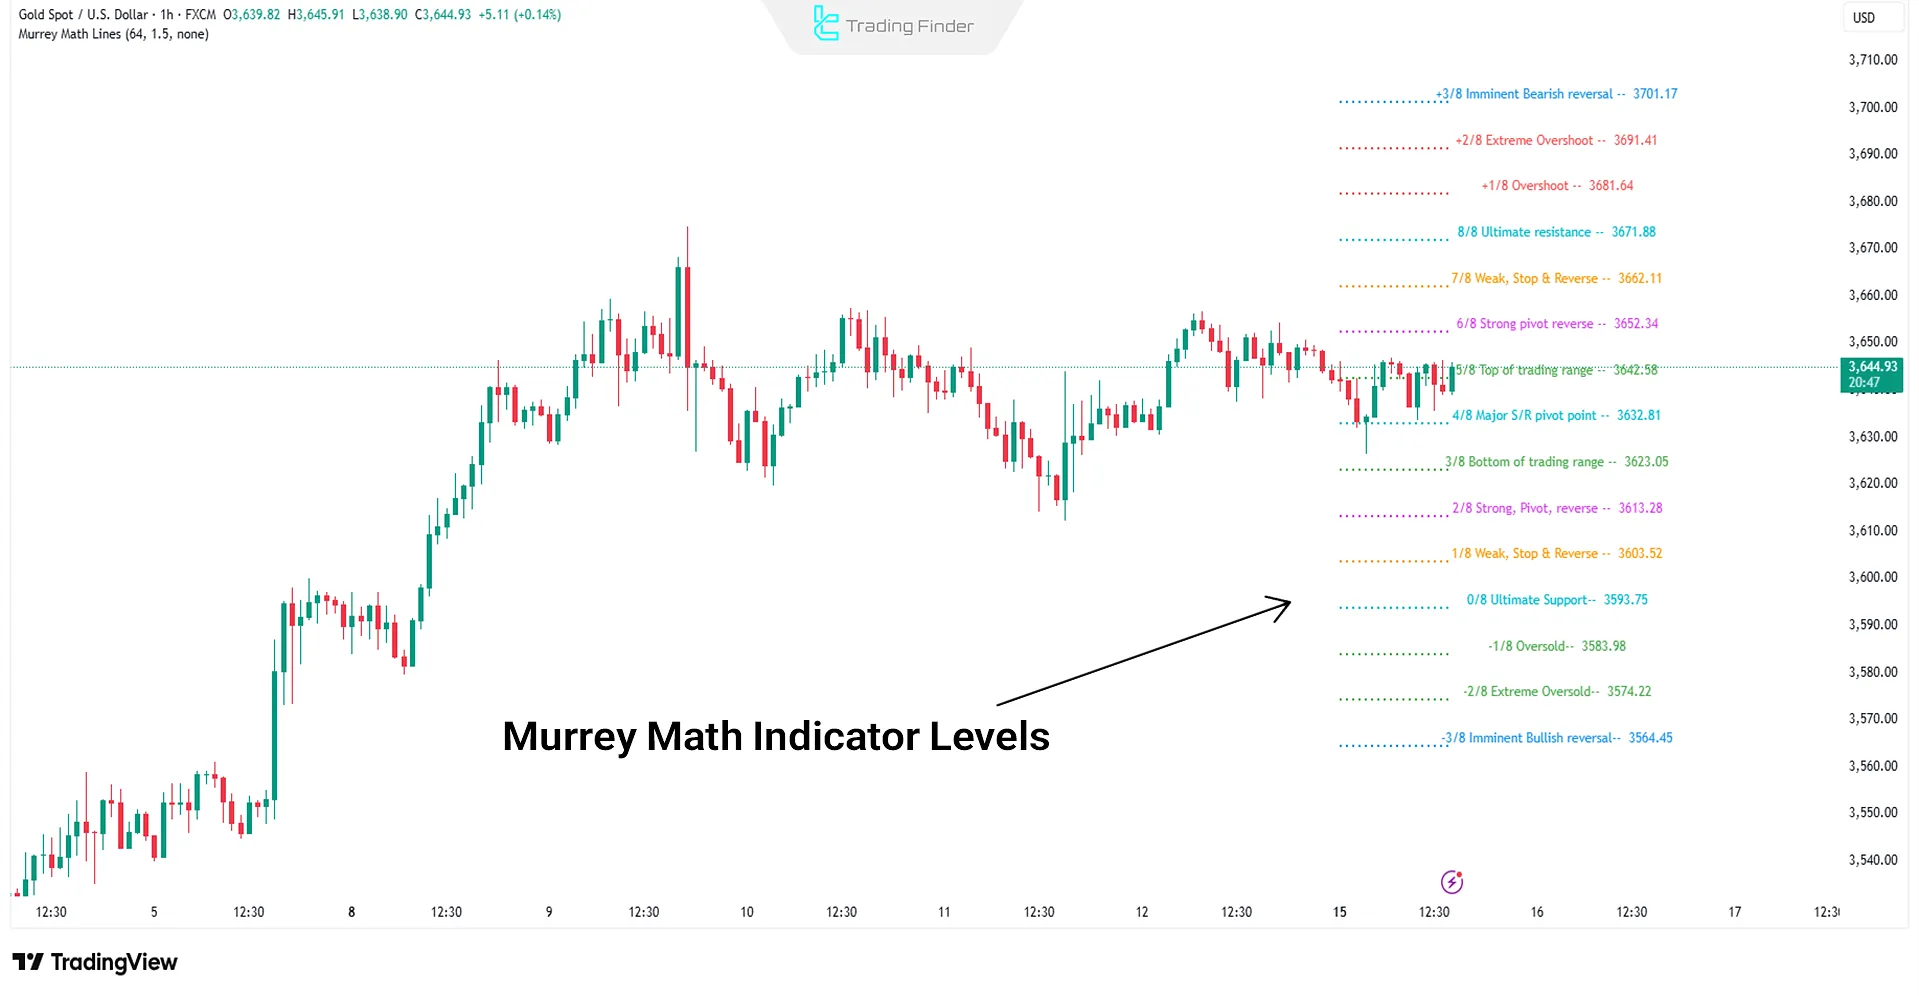
Murrey Math Levels Indicator
The Murrey Math Lines indicator divides the price chart into eight levels and identifies key reversal points. The 8/8 and 0/8 lines represent the strongest support and resistance levels and are highly significant for trend traders.
This tool, based on mathematical and geometric principles, provides a structured framework for analyzing price movements and anticipates potential market reactions at mid-levels such as 4/8 and 2/8.
Professional traders use these levels to identify overbought and oversold zones, select entry and exit points, and manage risk effectively.
Combining Murrey Math lines with confirming indicators such as the Relative Strength Index (RSI) or Moving Average Convergence Divergence (MACD) enhances signal accuracy and optimizes trading strategies for volatile markets.
Comparison of Support and Resistance Indicators
Choosing the right support and resistance indicator ensures analytical accuracy, reduces false signals, and optimizes trade entries and exits.
The table below compares these indicators in terms of accuracy, timeframe suitability, analytical complexity, and adaptability to trading styles.
Indicator | Signal Accuracy | Suitable Timeframe | Analytical Complexity |
Auto Fibonacci Retracement | High (especially during deep corrections) | Short and long; most effective in swing trading | Medium; requires identifying the main trend |
Trendlines | Medium to high (depends on correct drawing) | Short and long; applicable in all markets | Low to medium; depends on user skill |
Ichimoku Cloud | High (multi-layered support/resistance signals) | Mainly medium to long-term timeframes | High; multi-component analysis |
Major/Minor Support & Resistance | High (frequent and static levels) | All timeframes | Low; simple interpretation |
Linear Regression Channel | Medium to high (excellent for trending markets) | Medium and long-term | Medium; requires basic statistical understanding |
Zone Indicator | High (designed for detecting supply/demand zones) | Short and medium-term | Medium; requires experience in zone confirmation |
Pivot Point (All Types) | Medium (best suited for range markets) | Short-term (daily/weekly) | Low; straightforward calculations |
Key Price Action Levels (Key PA Levels) | High (validated by price behavior) | All timeframes, especially scalping | Medium to high; requires price action knowledge |
Moving Average | Medium (better for dynamic support) | Short and long; more effective in trending markets | Low; very simple |
Donchian Channel | Medium to high (highly accurate in breakouts) | Short and medium-term | Low to medium; direct interpretation |
VWAP | Very high in liquid markets (stocks/crypto) | Short-term | Low; single numerical value, easy to interpret |
Camarilla Pivot | High in volatile markets | Short-term; ideal for scalping and day trading | Medium; specific but ready-made calculations |
Murrey Math Levels | High (advanced mathematical levels) | Medium and long-term | High; requires understanding of Murrey theory |
How to Choose the Best Support and Resistance Indicators?
In technical analysis, accurately identifying support and resistance levels is only valid when the selected tool aligns with the timeframe, strategy, and trading style.
The effectiveness of Support and Resistance Indicators in highlighting sensitive price zones depends on their signal precision, ease of interpretation, and compatibility with market structure.
Professional traders can refer to the article “Trading Support and Resistance Levels Tutorial” on the website priceactionninja.com for further study and to help select the best support and resistance indicators.
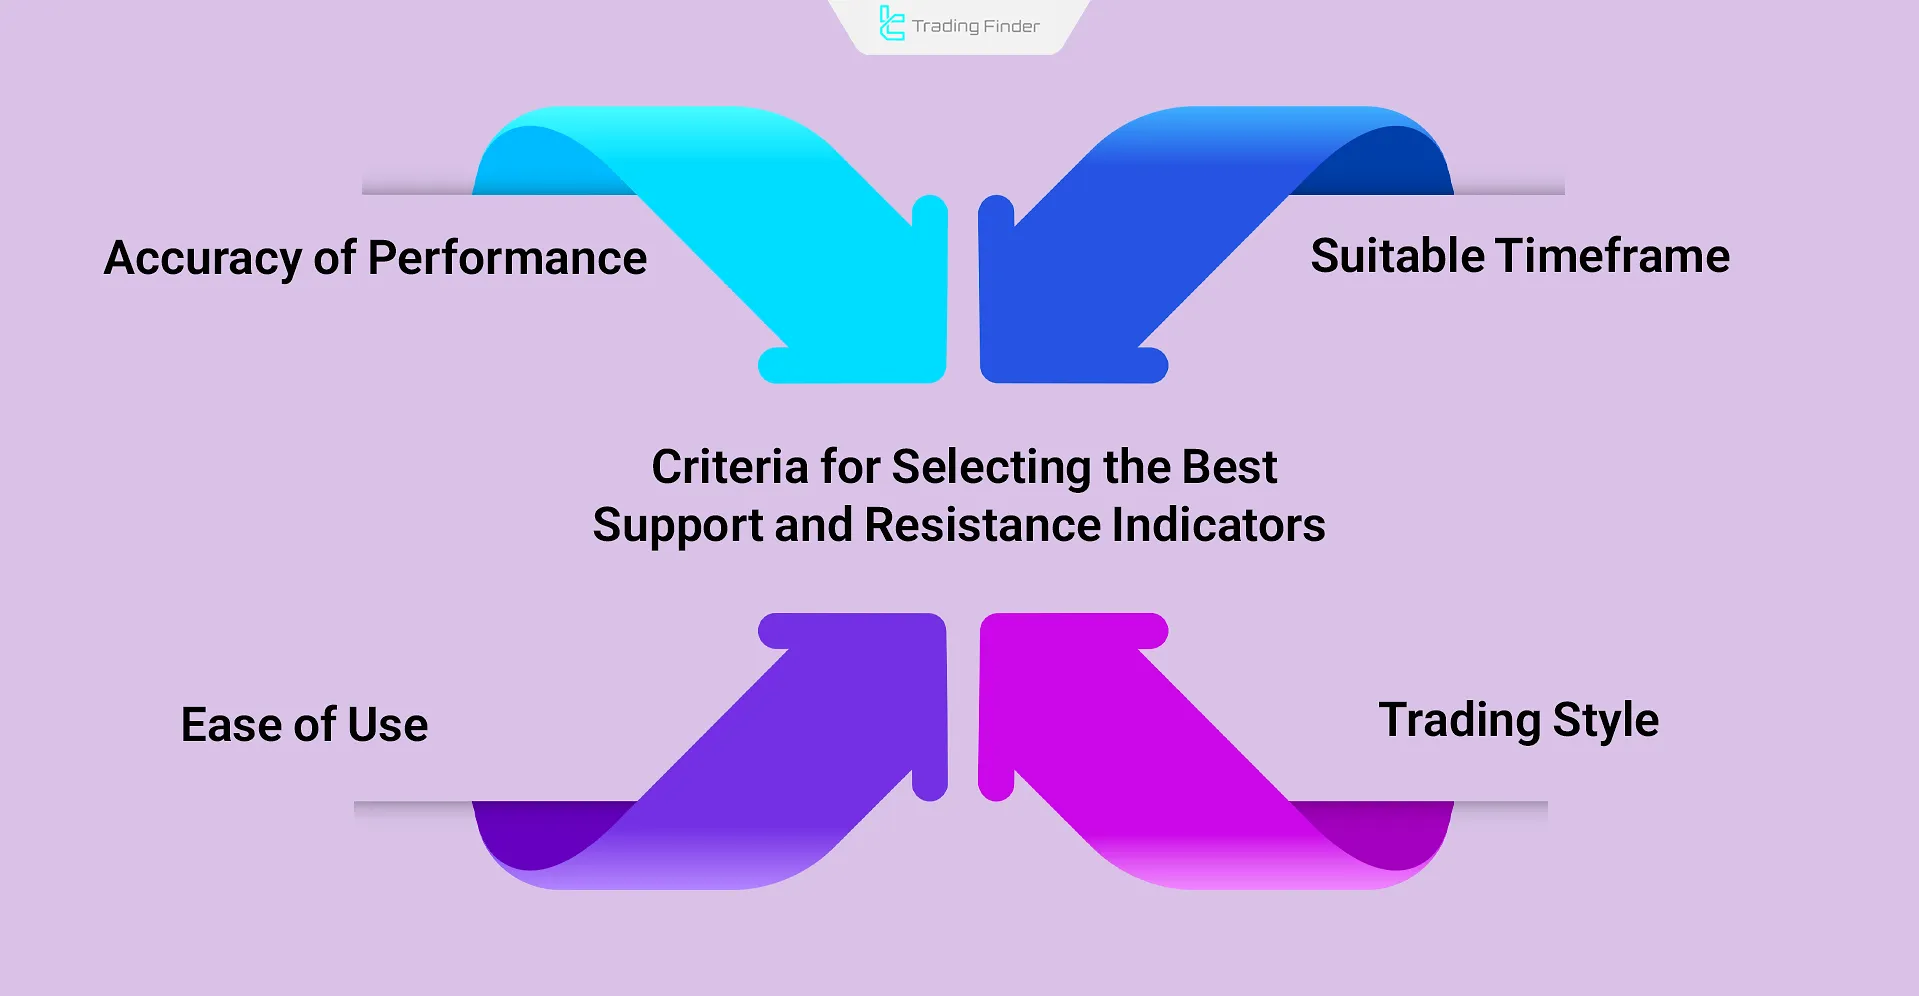
To choose the best support and resistance indicator according to your trading strategy, you can use the following criteria:
- Appropriate timeframe
- Trading style
- Ease of use
- Accuracy in performance
Timeframe
The trading timeframe directly affects an indicator's performance.
Some indicators are suitable for short-term timeframes (e.g., 5-minute), while others are designed for long-term timeframes (e.g., daily).
Support and resistance zones identified on higher timeframes tend to be more powerful and reliable.
Trading Style
Choosing Indicators for Support and Resistance based on the trader’s execution speed and analytical structure greatly impacts signal accuracy.
This choice must match both the trading style and timeframe:
- Scalpers: Need fast indicators for 1 to 15-minute charts;
- Swing Traders: Use indicators tailored for 1 to 4-hour charts;
- Trend Traders: Prefer indicators optimized for larger timeframes, such as daily and weekly.
Ease of Use
Some indicators have a simple design and are easy to operate, while more complex ones require deeper training and analysis to be used effectively.
Accuracy and Performance
Although indicators are designed to produce accurate signals, some generate more false signals than others.
To assess their reliability, backtesting on historical data is essential.
Also, combining indicators with other tools enhances the accuracy of trading strategies.
Candle Time Indicator for Use in Different Timeframes
The Candle Time Indicator is one of the practical tools in MetaTrader 4 and 5 that displays the exact remaining time until the current candle closes directly on the chart in real time.
This feature is especially important for scalpers and day traders who trade in short timeframes such as 1 minute (M1), 5 minutes (M5), and 15 minutes (M15).
Knowing when a candle will close allows traders to better time their entries and exits and to execute time-sensitive strategies—such as breakout or news trading—with higher precision.
To download this indicator for free, you can use the following links:
This indicator belongs to the price action and technical analysis tools category in MetaTrader and is compatible with various trading styles, including day trading, swing trading, and scalping.
In addition to the forex market, it can also be used for cryptocurrencies, stocks, and indices, and it is effective in both short-term and long-term timeframe analyses.
Key features and specifications of the indicator:
- Trading Platform: MetaTrader 4 and MetaTrader 5
- Category: Price Action and Technical Analysis Tools
- User Level: Suitable for beginners to professional traders
- Supported Timeframes: From 1 minute to 1 hour and higher timeframes
- Applicable Markets: Forex, cryptocurrencies, stocks, indices
- Customizable Settings: Choose text color, size, and font name, display mode, and position on the chart
Using the Candle Time Indicator is particularly valuable for traders with time-based strategies, as it helps maintain psychological discipline and structure risk management.
This tool enables traders to make more accurate decisions at the close of key candles—whether in short-term timeframes or higher ones like 4-hour and daily charts.
Overall, the Candle Time Indicator is a lightweight yet powerful tool that enhances a trader’s reaction speed in volatile market conditions and makes time management in the trading process more professional.
Example of Selecting the Best Support and Resistance Indicator
Suppose you are a scalper trading in the 5-minute timeframe. Identifying support and resistance zones quickly is crucial.
In this situation, using Pivot Points or Bollinger Bands is an ideal choice. These tools identify important price zones in real time and allow quick reactions to breakouts or reversals.
To increase accuracy, combining these tools with a Volume Indicator helps filter zones with high trading volume, better indicating potential reversals or trend continuations.
Conversely, a swing trader in the 4-hour timeframe may use Moving Averages or the Ichimoku Cloud to identify support and resistance in broader ranges.
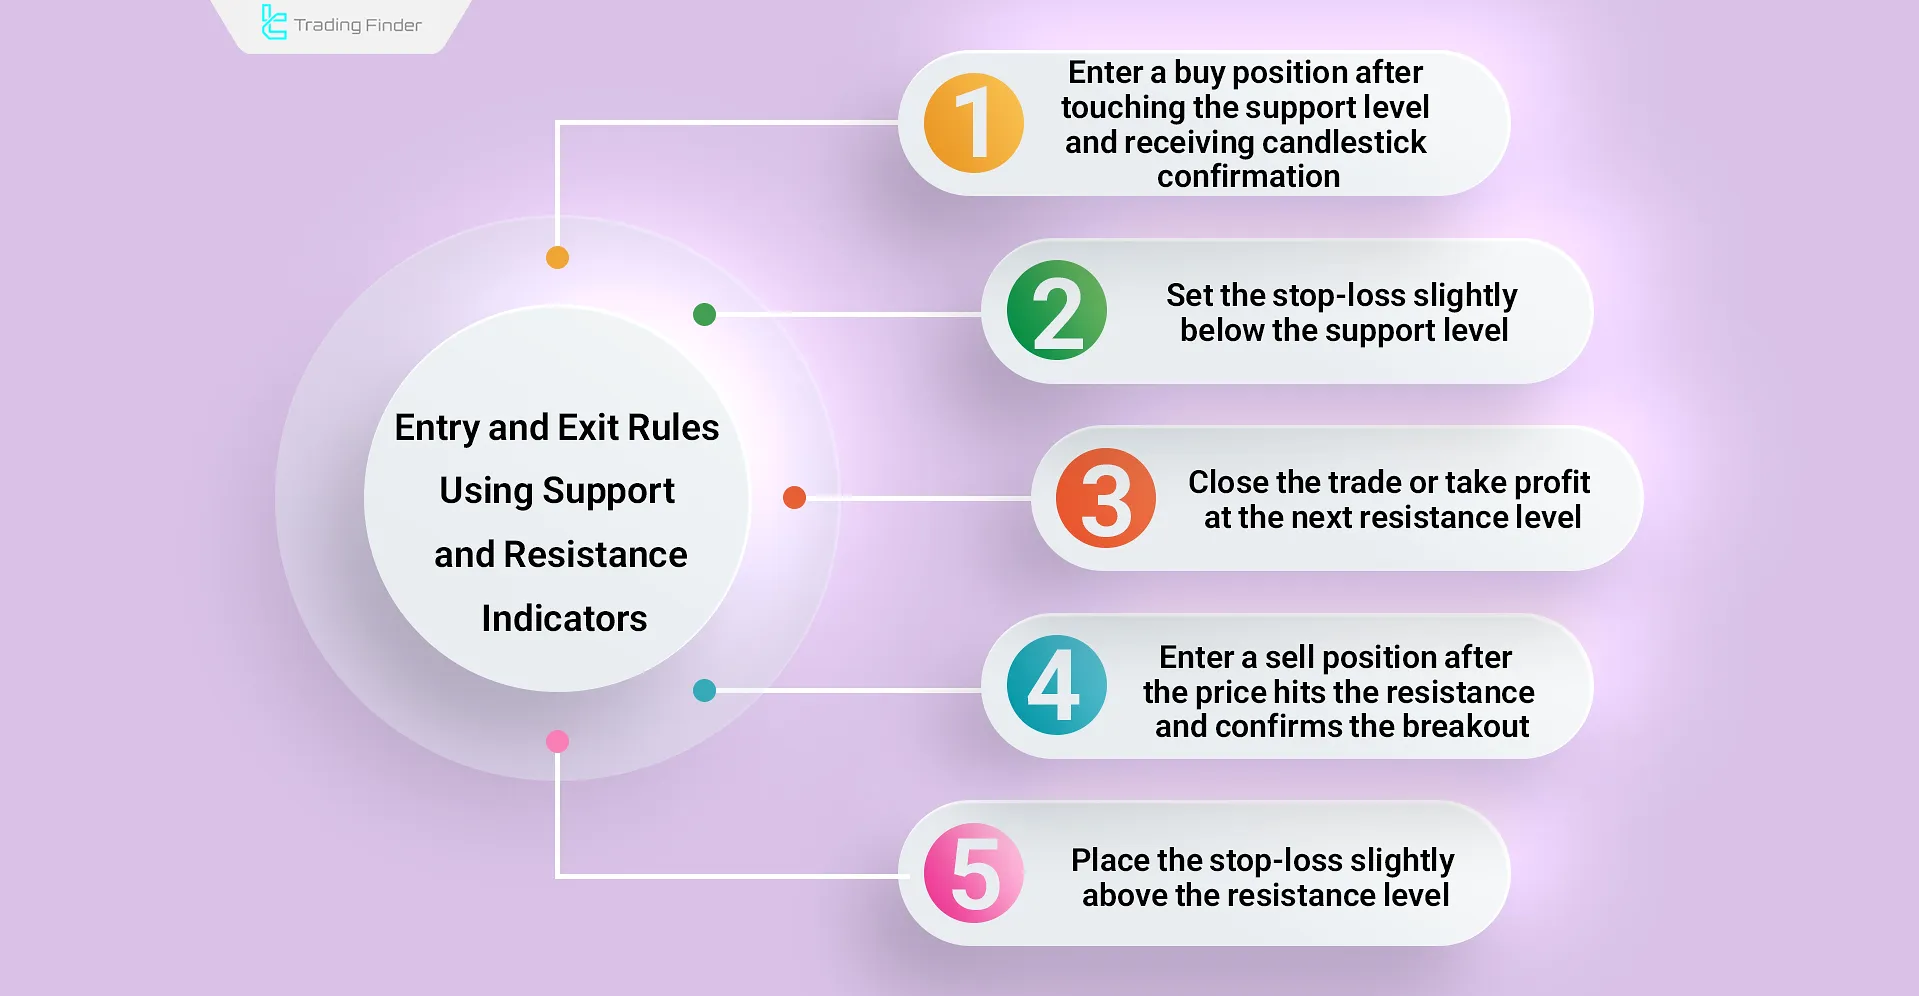
Rules for Entry and Exit Using Support and Resistance Indicators
For the practical application of Support & Resistance Indicators, you can follow these guidelines:
- Enter a buy trade after the price touches the support level and a confirming candlestick appears;
- Set a stop loss slightly below the support level;
- Close the trade or take profit at the next resistance level;
- Enter a sell trade after the price touches the resistance level and a breakout confirmation appears;
- Set a stop loss slightly above the resistance level.
Common Mistakes in Choosing and Using Support and Resistance Indicators
The common mistakes in selecting and using Support and Resistance Indicators are usually related to incorrect analysis or excessive reliance on these tools.
The most important mistakes include:
- Relying solely on a single indicator without combining it with price action;
- Choosing an inappropriate timeframe and ignoring higher timeframes;
- Frequently changing levels without sufficient backtesting;
- Ignoring trading volume and areas with low liquidity;
- Entering trades against the main market trend.
Conclusion
Selecting the Best Support and Resistance Indicators depends on your trading approach and market conditions.
Tools like Pivot Points, Fibonacci Retracements, and Moving Averages are highly effective in identifying key price zones.


