


Leading indicators in technical analysis use historical price data to generate early signals about potential market direction changes. These tools aim to detect price movements before new trends are fully established.
By interpreting existing information, leading indicators provide traders with a future-oriented view of market movements. When used alongside other tools, these indicators can significantly enhance analysis accuracy.
Leading and Lagging Indicators
In technical analysis, indicators are divided into two main categories: Leading and Lagging.
A leading indicator projects the future direction of price movement and plays a key role in identifying potential market reversal points.
In contrast, a lagging indicator is based on past data and is mainly used to confirm the current trend.
Typical examples include:
- RSI and Stochastic as leading indicators;
- MACD and Moving Average as lagging indicators.
Below is a comparison between leading and lagging indicators:
Key Feature | Leading Indicators | Lagging Indicators |
Nature | Predict future movements (early signals) | Confirm existing trends (later signals) |
Signal Timing | Before price movement | After trend confirmation |
Advantages | Faster entries, identification of reversals | Fewer false signals, confirms trend strength |
Disadvantages | Many false signals in choppy markets | Late entries, missing part of the profit |
Application | Suitable for predictive and scalping strategies | Suitable for trend-following and long-term strategies |
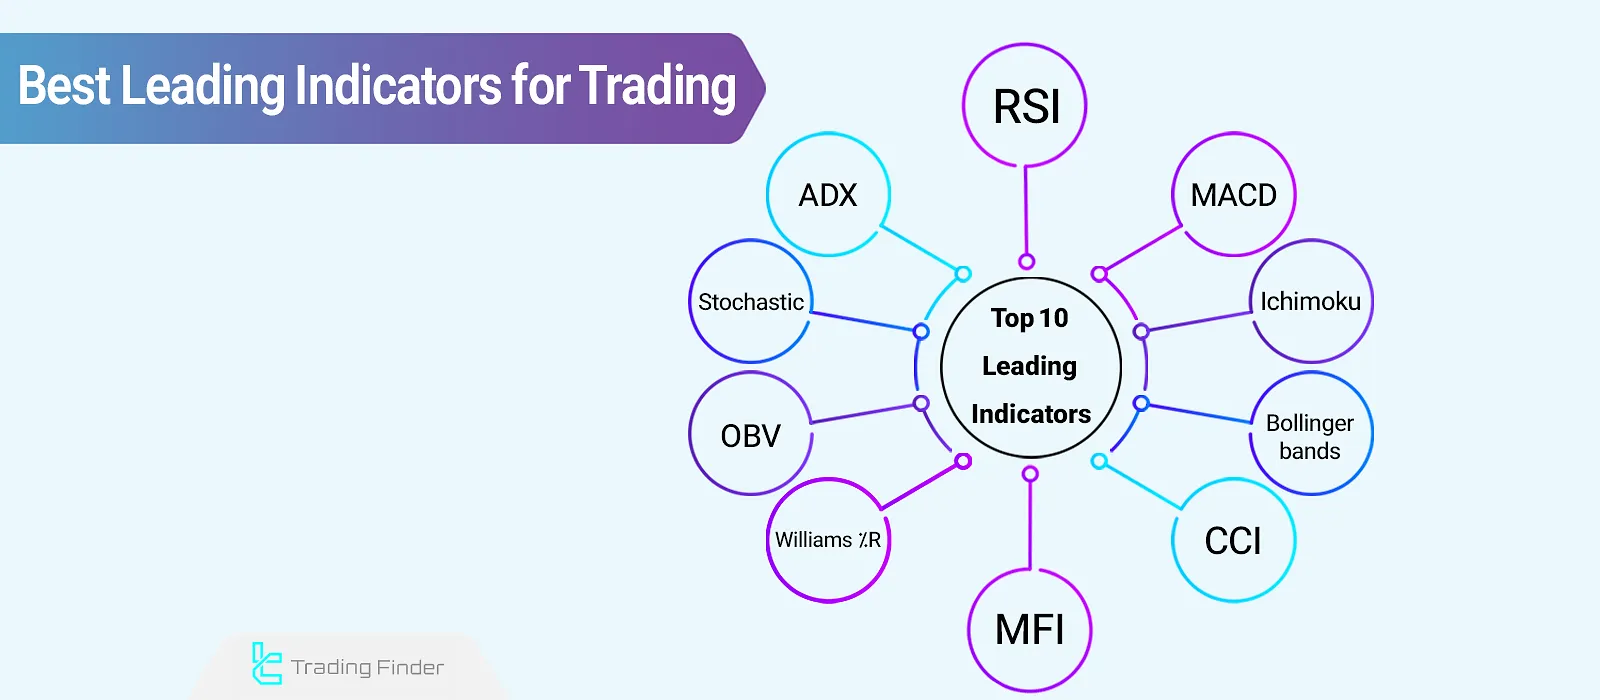
Top 10 Best Leading Indicators
Traders can consistently rely on leading indicators to validate trading decisions. Some of the Best Leading Indicators include:
- Relative Strength Index (RSI)
- Moving Average Convergence Divergence (MACD)
- Bollinger Bands
- Ichimoku Cloud
- Stochastic Oscillator
- Average Directional Index (ADX)
- Money Flow Index (MFI)
- Commodity Channel Index (CCI)
- Williams %R
- On-Balance Volume (OBV)
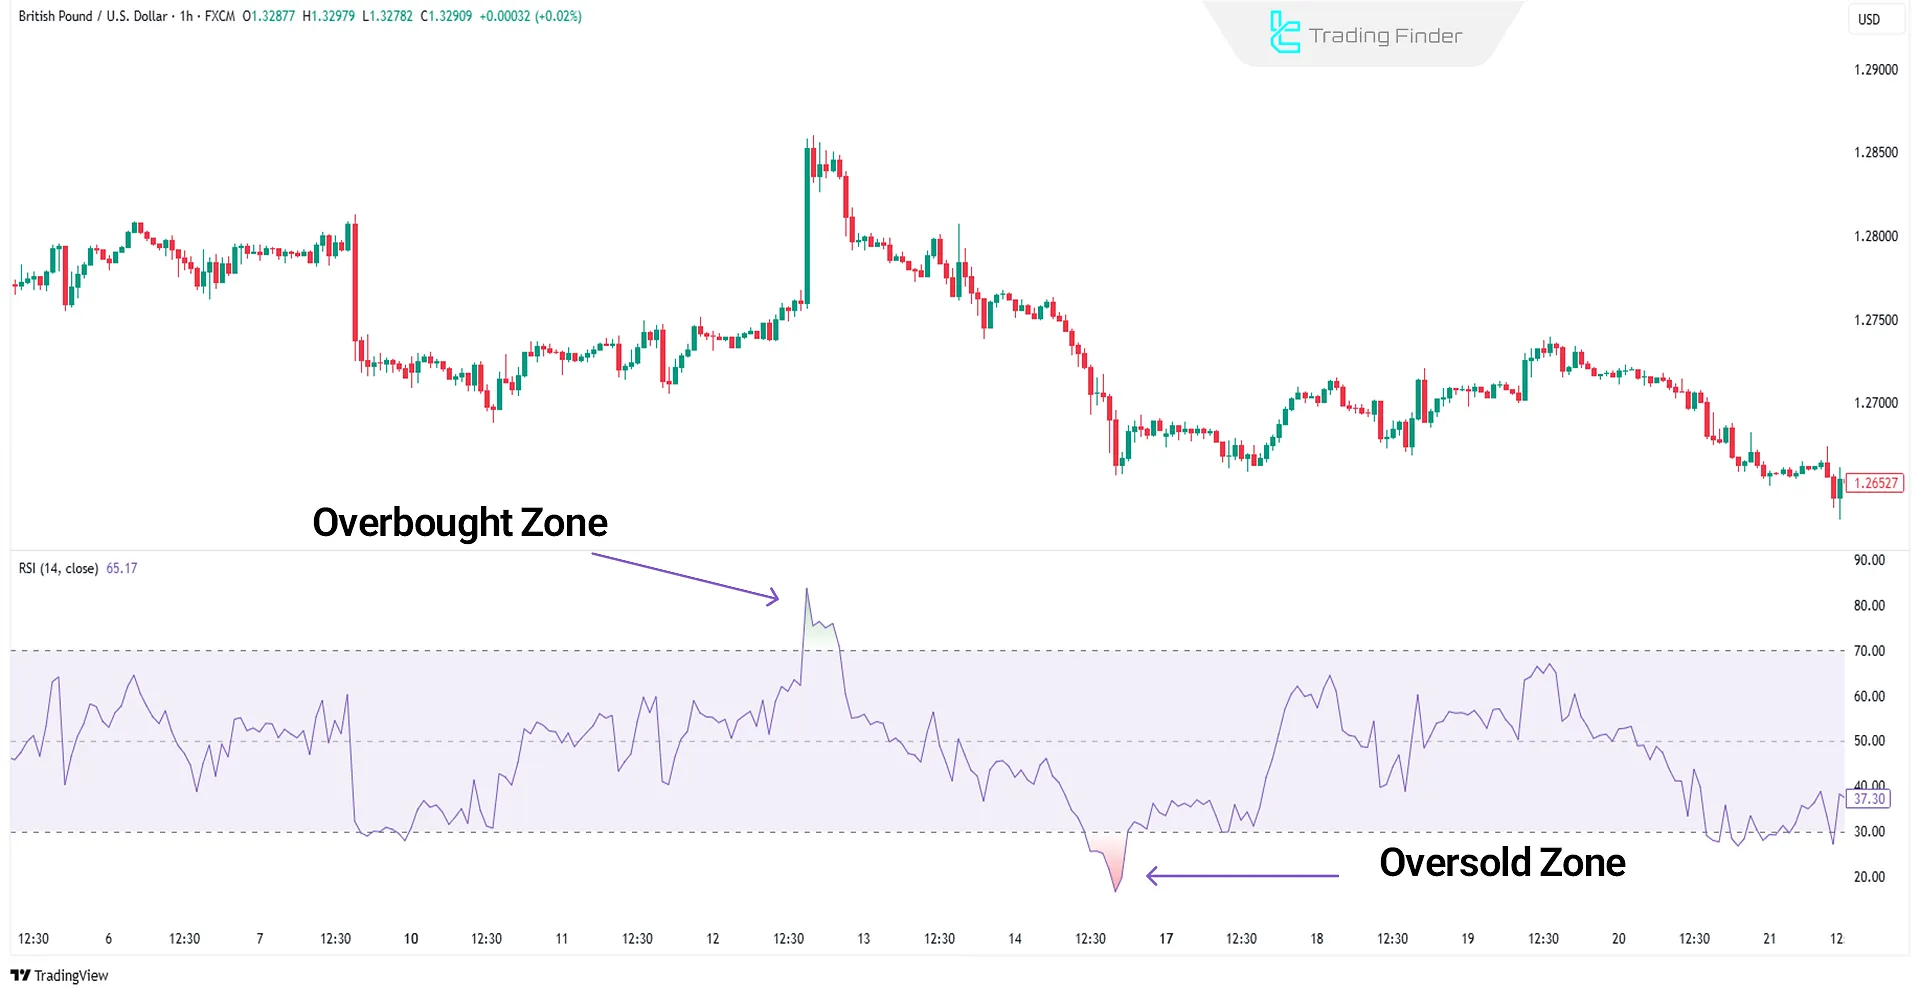
Relative Strength Index (RSI)
The RSI (Relative Strength Index) is a momentum oscillator that measures the speed and magnitude of price changes using candle closings. It fluctuates between 0 and 100:
- Above 70: Overbought zone, potential price correction
- Below 30: Oversold zone, possible upward reversal
In the RSI Indicator Training article, more details about this indicator are explained. For a deeper study and access to specialized educational content, traders can visit investopedia.com.
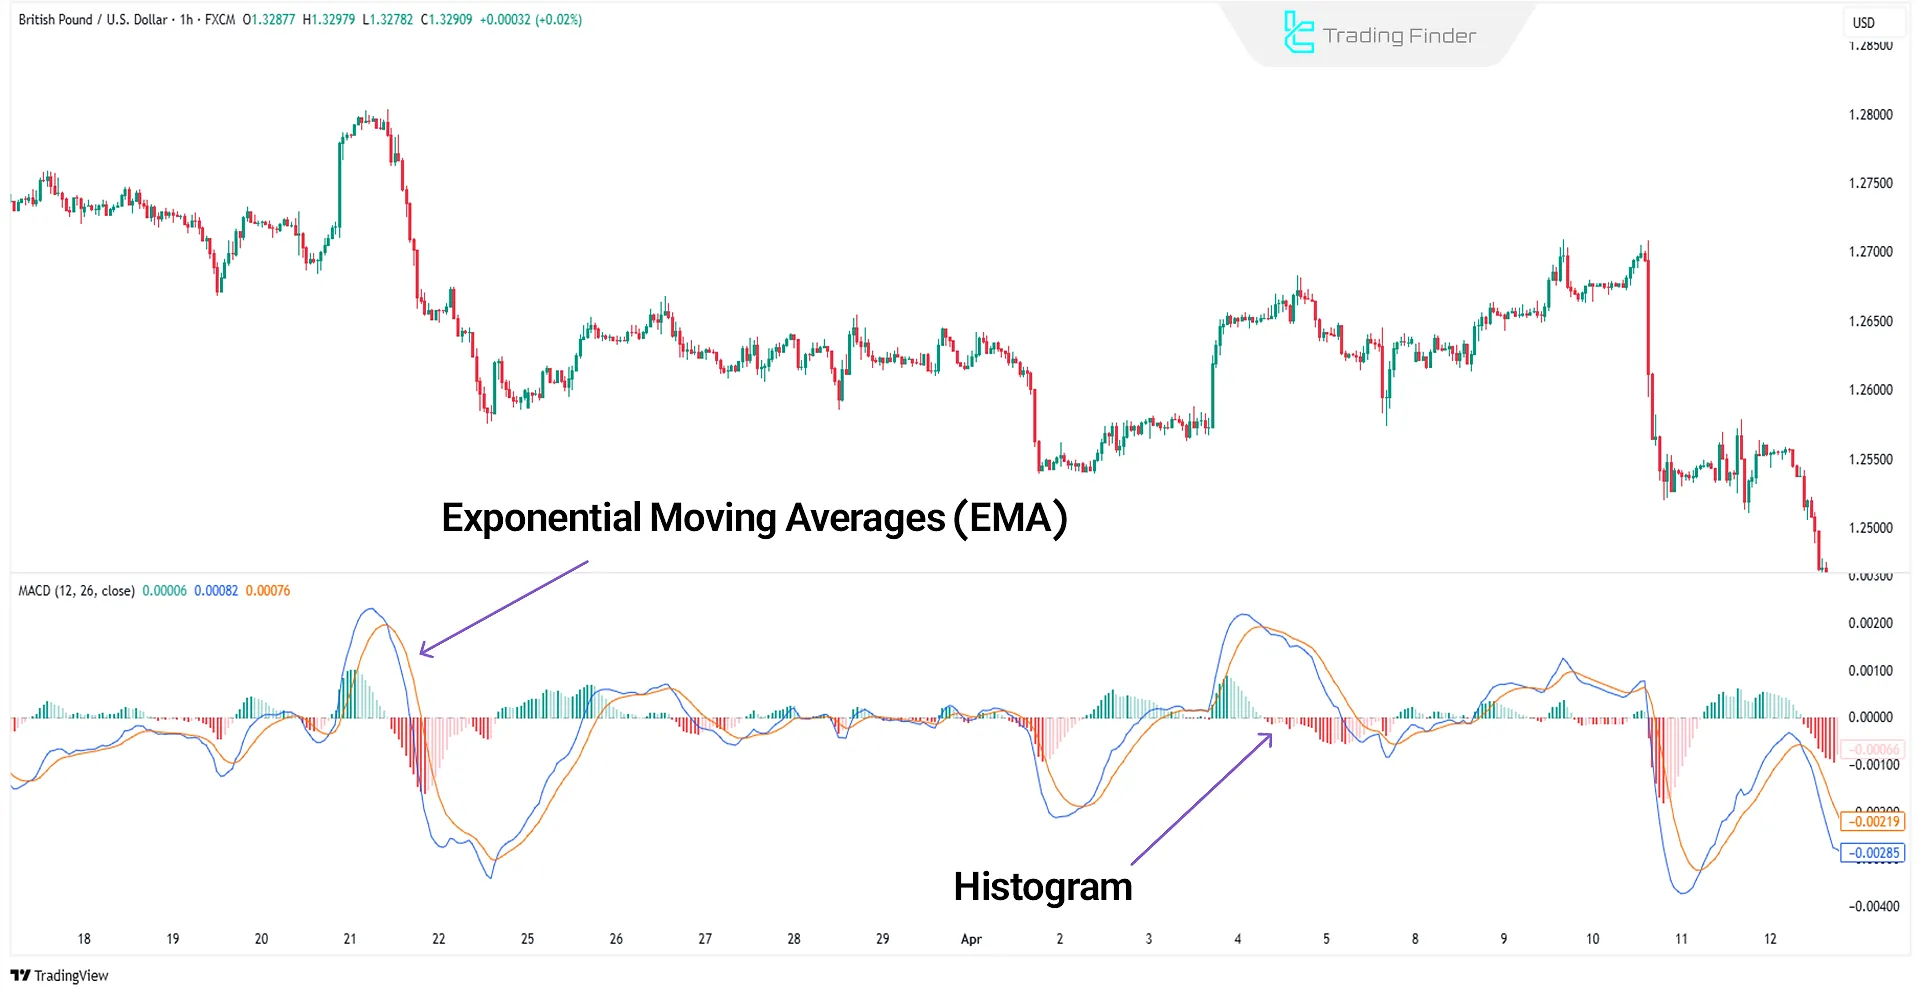
MACD (Moving Average Convergence Divergence)
The MACD is a momentum-based indicator that includes two Exponential Moving Averages (EMAs) and a histogram. It’s used to identify trend direction, strength, and optimal entry/exit points.
MACD can be combined with other indicators and works effectively across all timeframes.
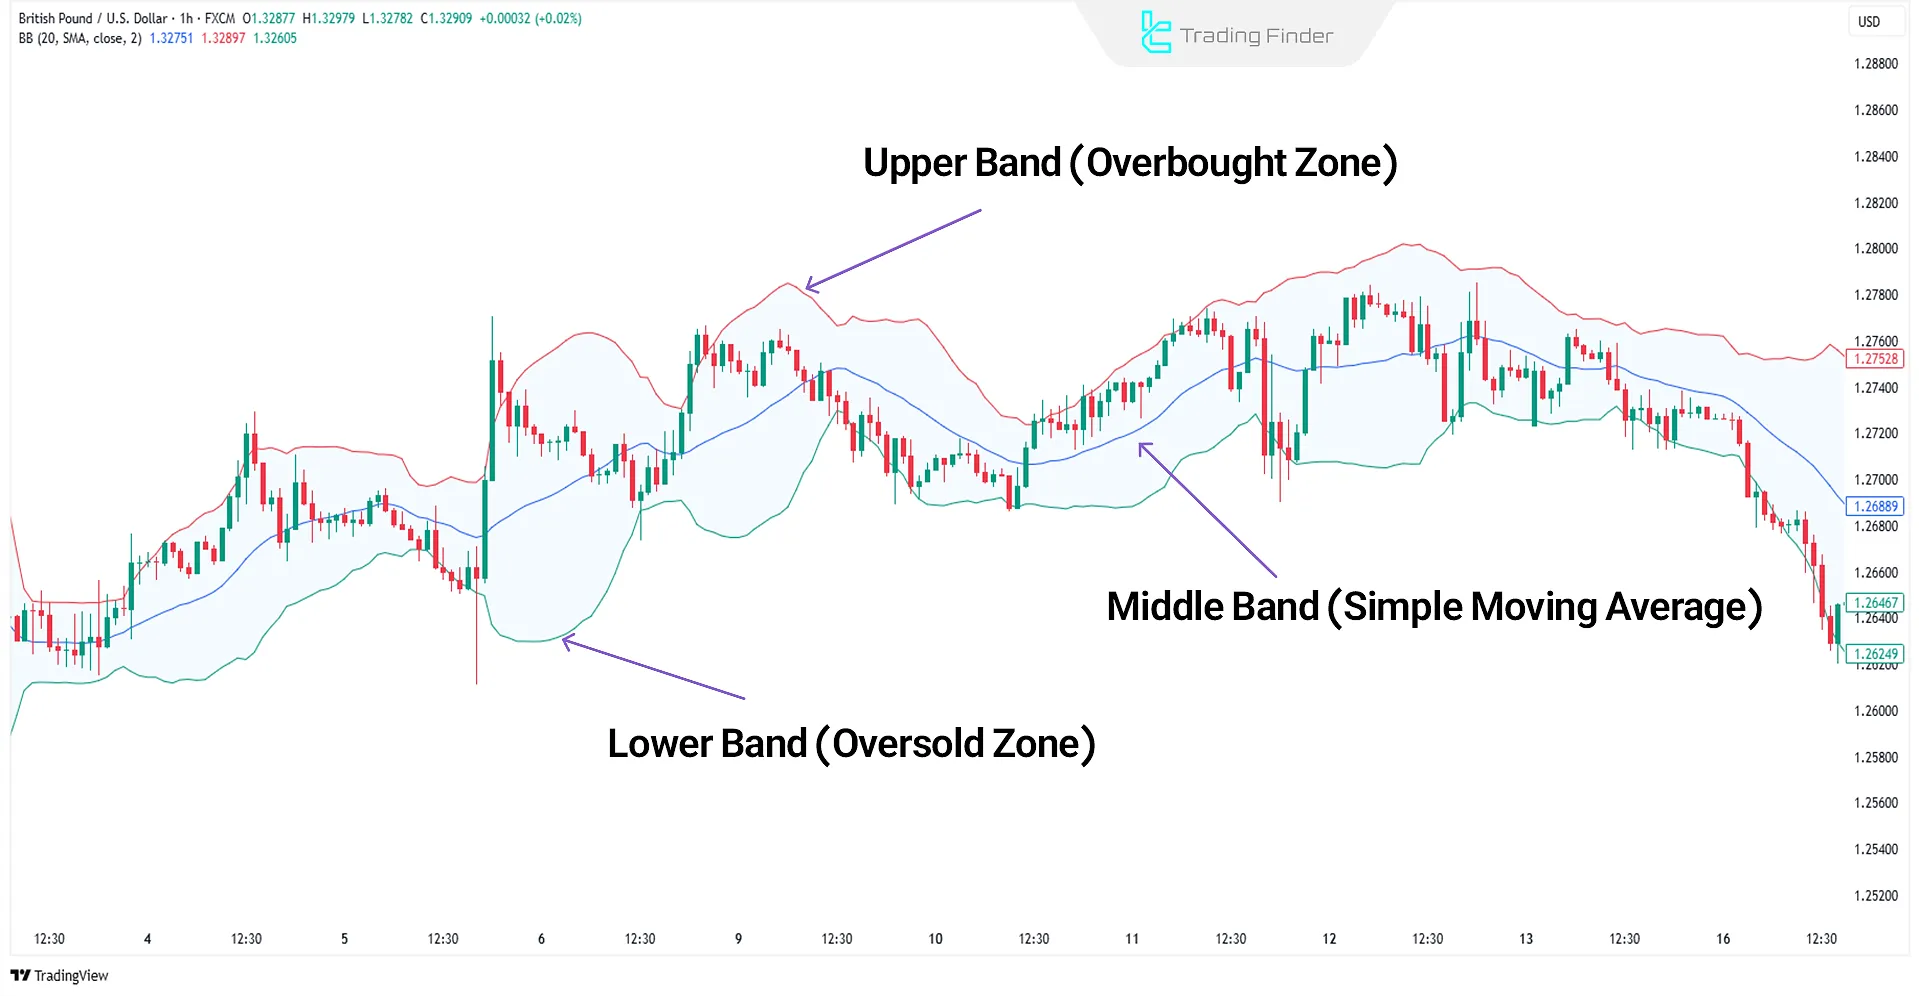
Bollinger Bands
Bollinger Bands, one of the Best Leading Indicators, are based on a moving average and are used to analyze price volatility.
In addition to identifying overbought/oversold conditions, they also help determine market trends.
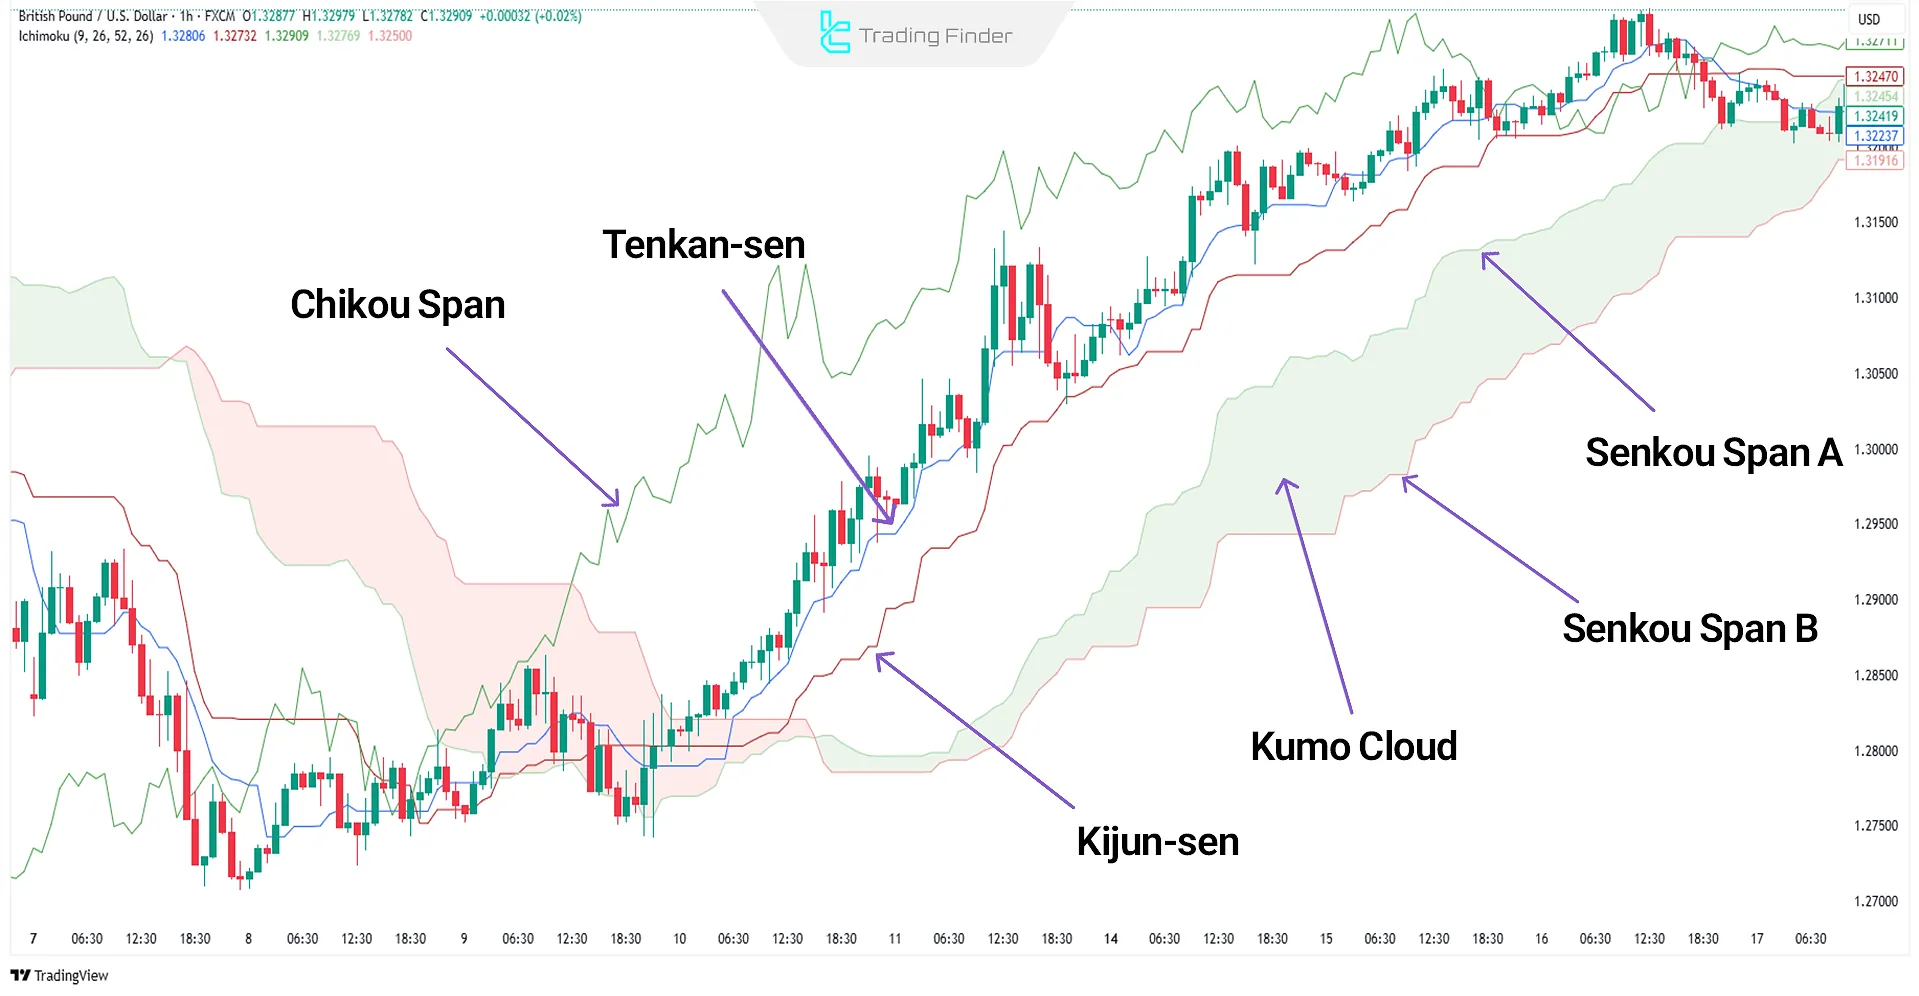
Ichimoku Cloud
The Ichimoku Cloud is among the most comprehensive leading indicators in technical analysis, offering insights into support and resistance levels, trend direction, and price positioning.
While categorized as a technical indicator, many traders consider Ichimoku a complete trading system.
To learn the Ichimoku strategy and how to trade using this powerful analytical tool, you can refer to the YouTube video Ichimoku Strategy Tutorial on the Trade Pro channel:
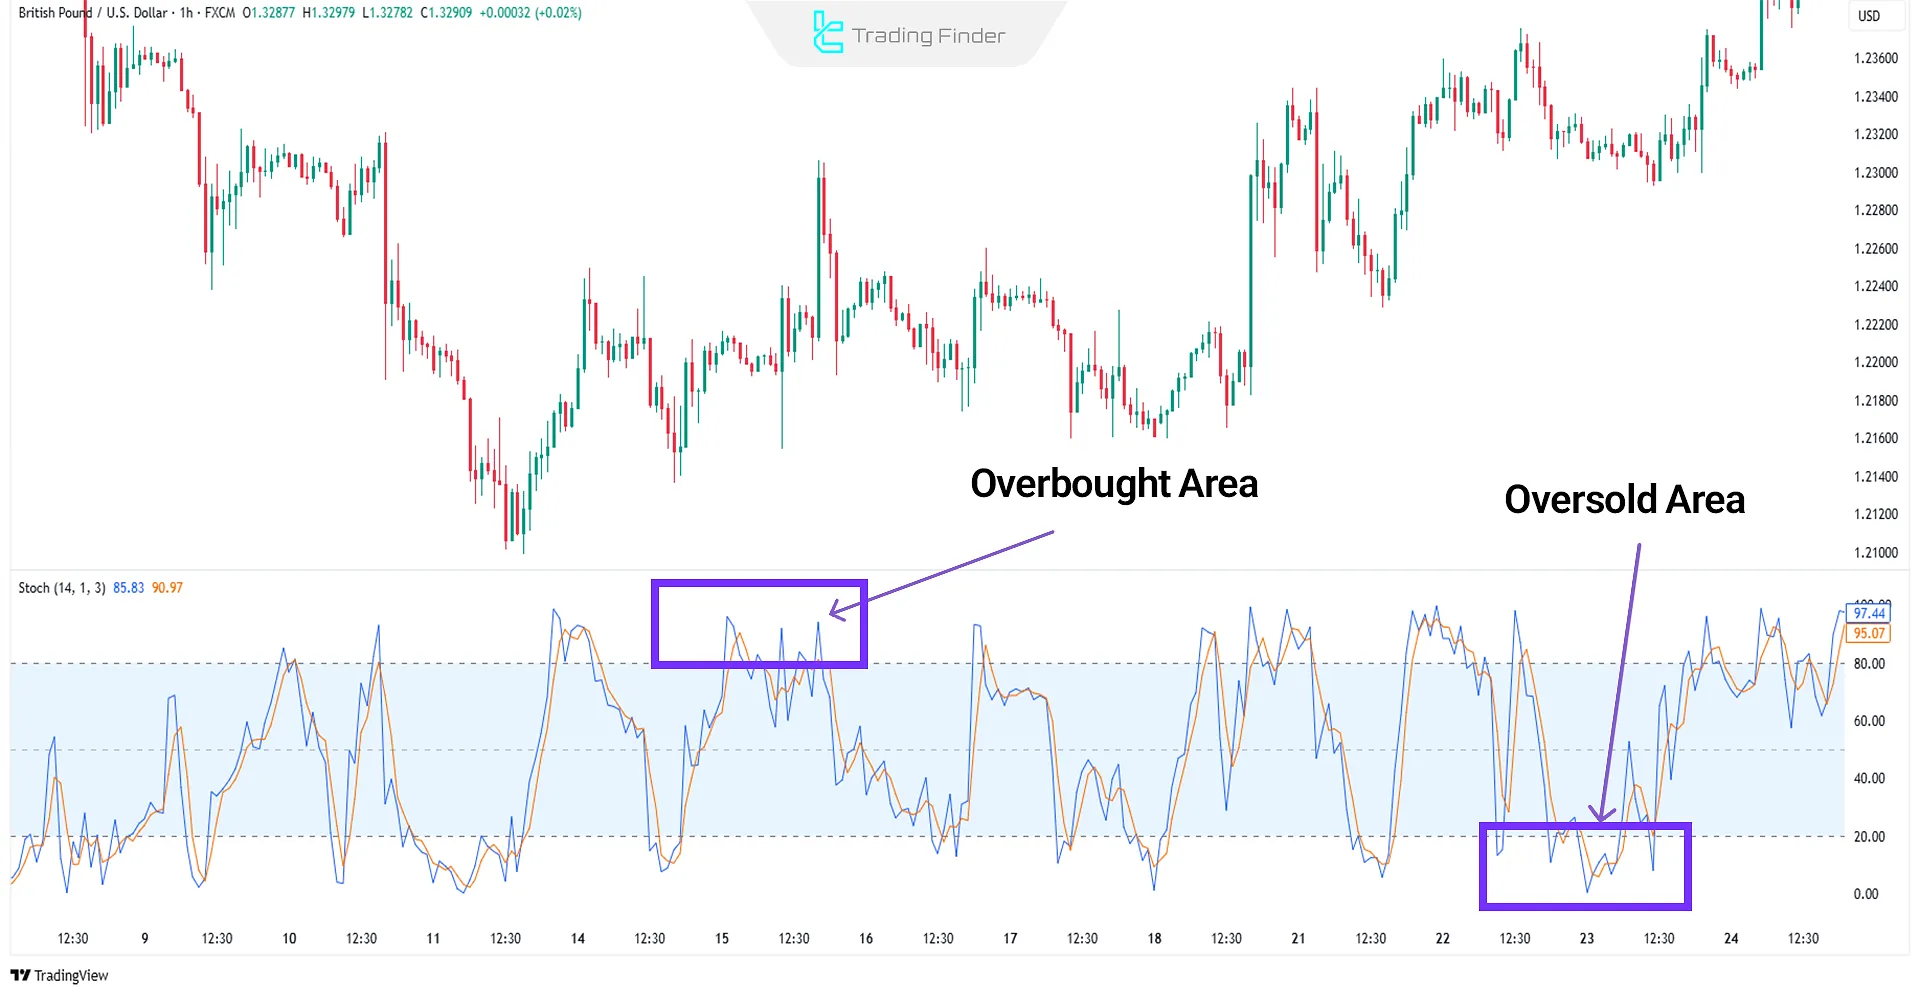
Stochastic Oscillator
The Stochastic Oscillator is a momentum-based indicator that compares the closing price to the high and low range over a given period.
This indicator is price-dependent and is used to predict potential market tops and bottoms.
The Stochastic range fluctuates between 0 and 100, where values below 20 indicate oversold conditions and values above 80 indicate overbought conditions.
In general, the Stochastic tends to oscillate near the upper range during uptrends and near the lower range during downtrends.
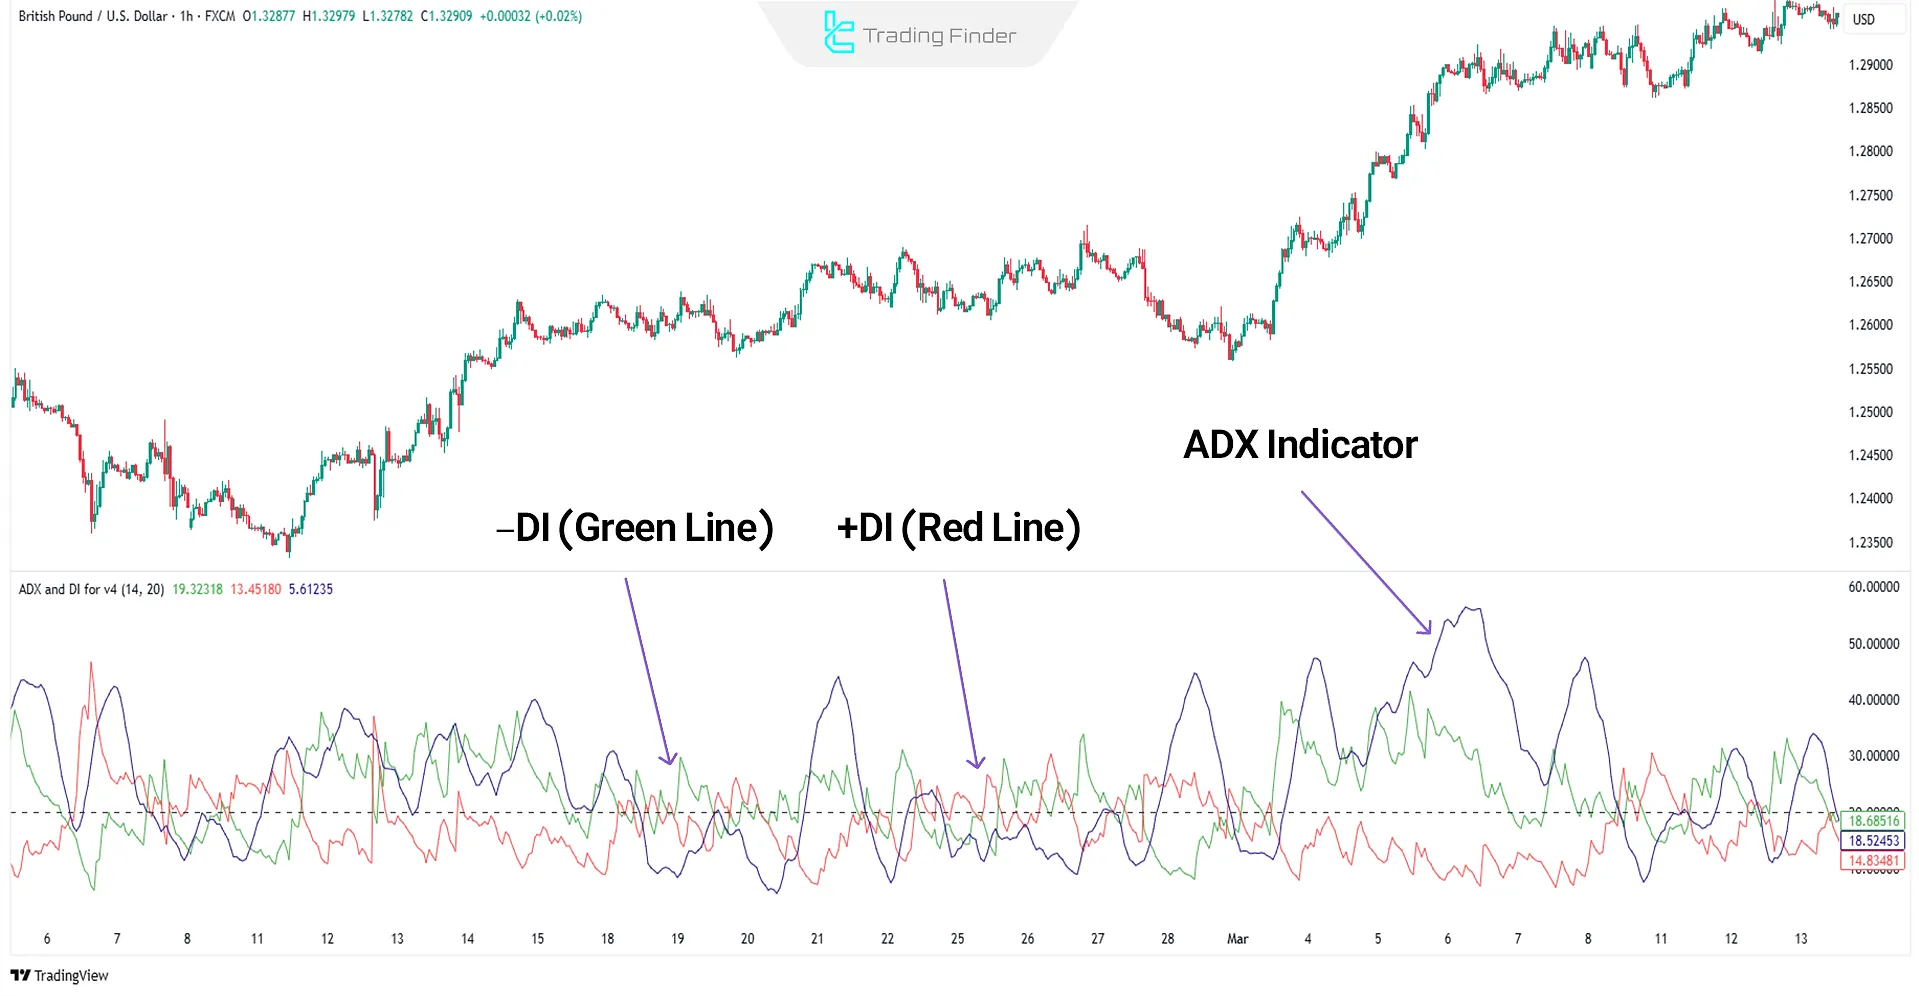
ADX (Average Directional Index)
The ADX measures trend strength and is ideal for enhancing trend-following strategies. It consists of three components:
- ADX: Oscillates between 0 and 100, shows trend strength
- +DI: Positive directional indicator, signals buying pressure
- –DI: Negative directional indicator, signals selling pressure
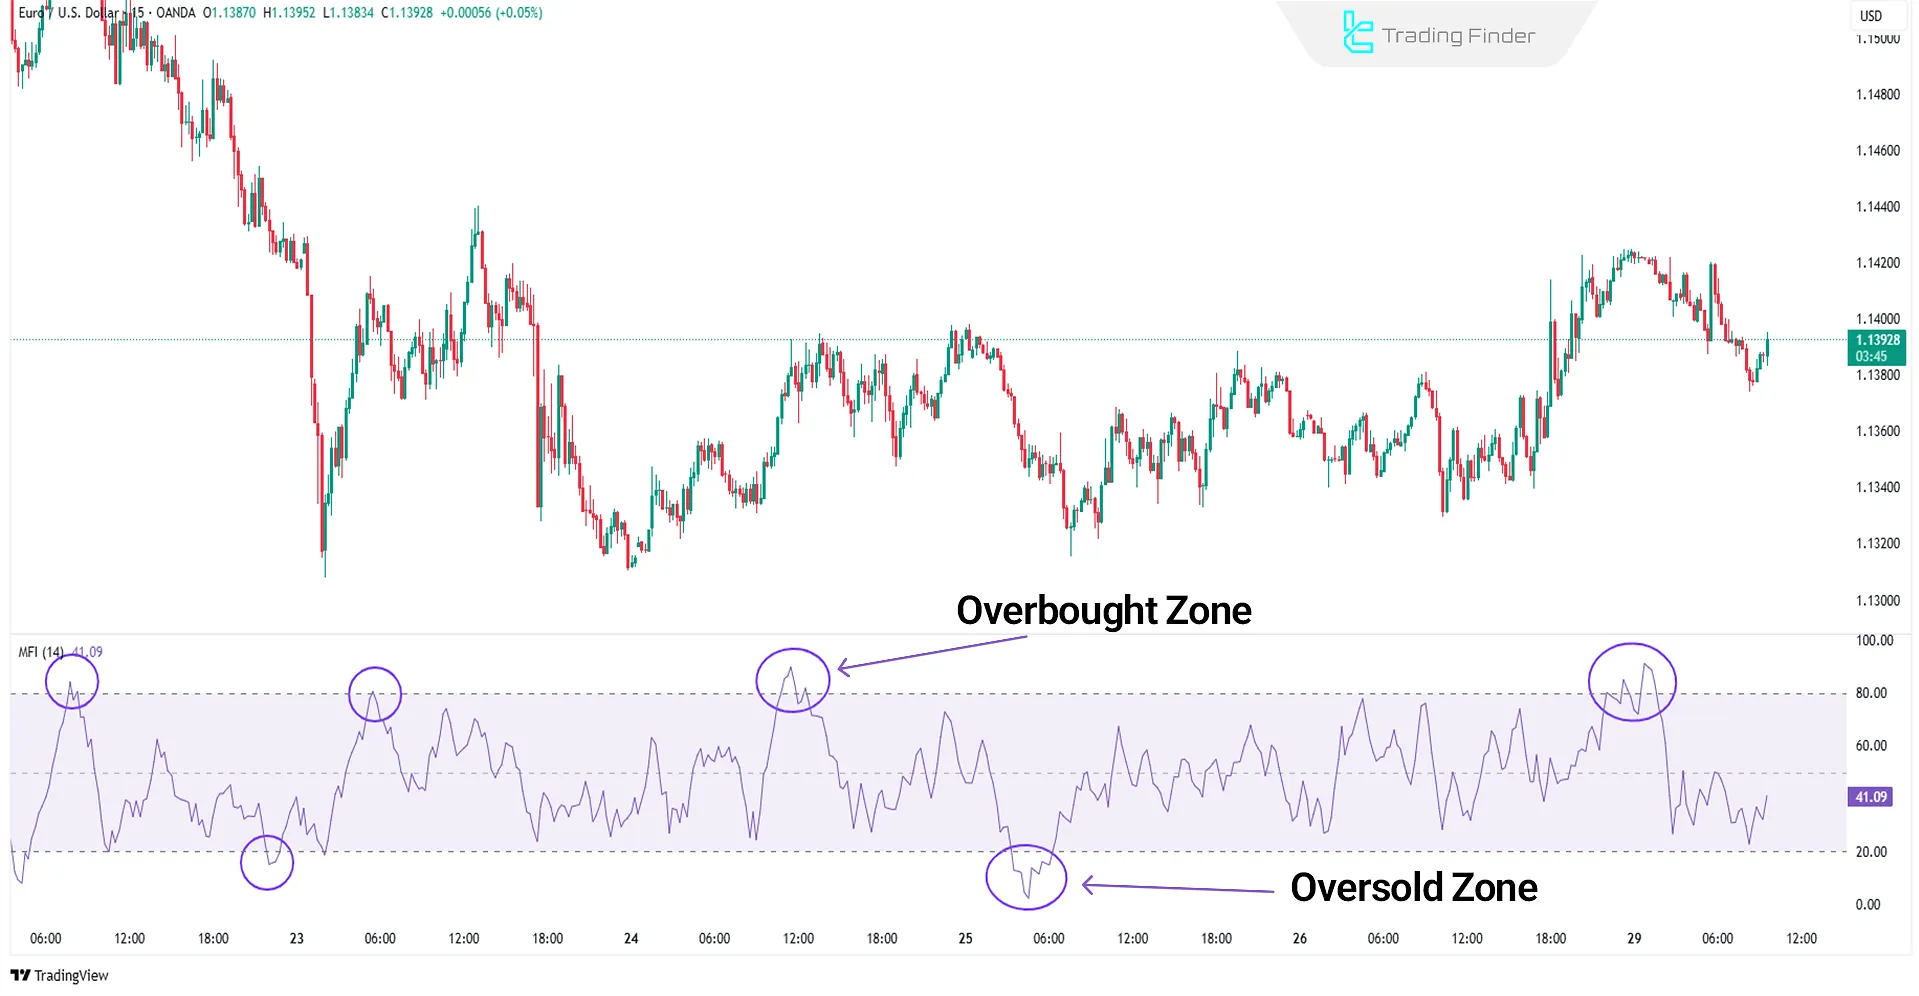
Money Flow Index (MFI)
The MFI (Money Flow Index) is used to identify money flow and analyze trend strength in the market.
This indicator is similar to the RSI, with the key difference being that it also incorporates trading volume into its calculations.
As a result, the MFI can detect overbought and oversold levels while providing a more accurate analysis of money flow strength.
Key signals of the Money Flow Index (MFI):
- 80: Overbought
- 20: Oversold
- 50: Trend identification
The default setting is 14 periods, but it can be adjusted to suit trading strategies.
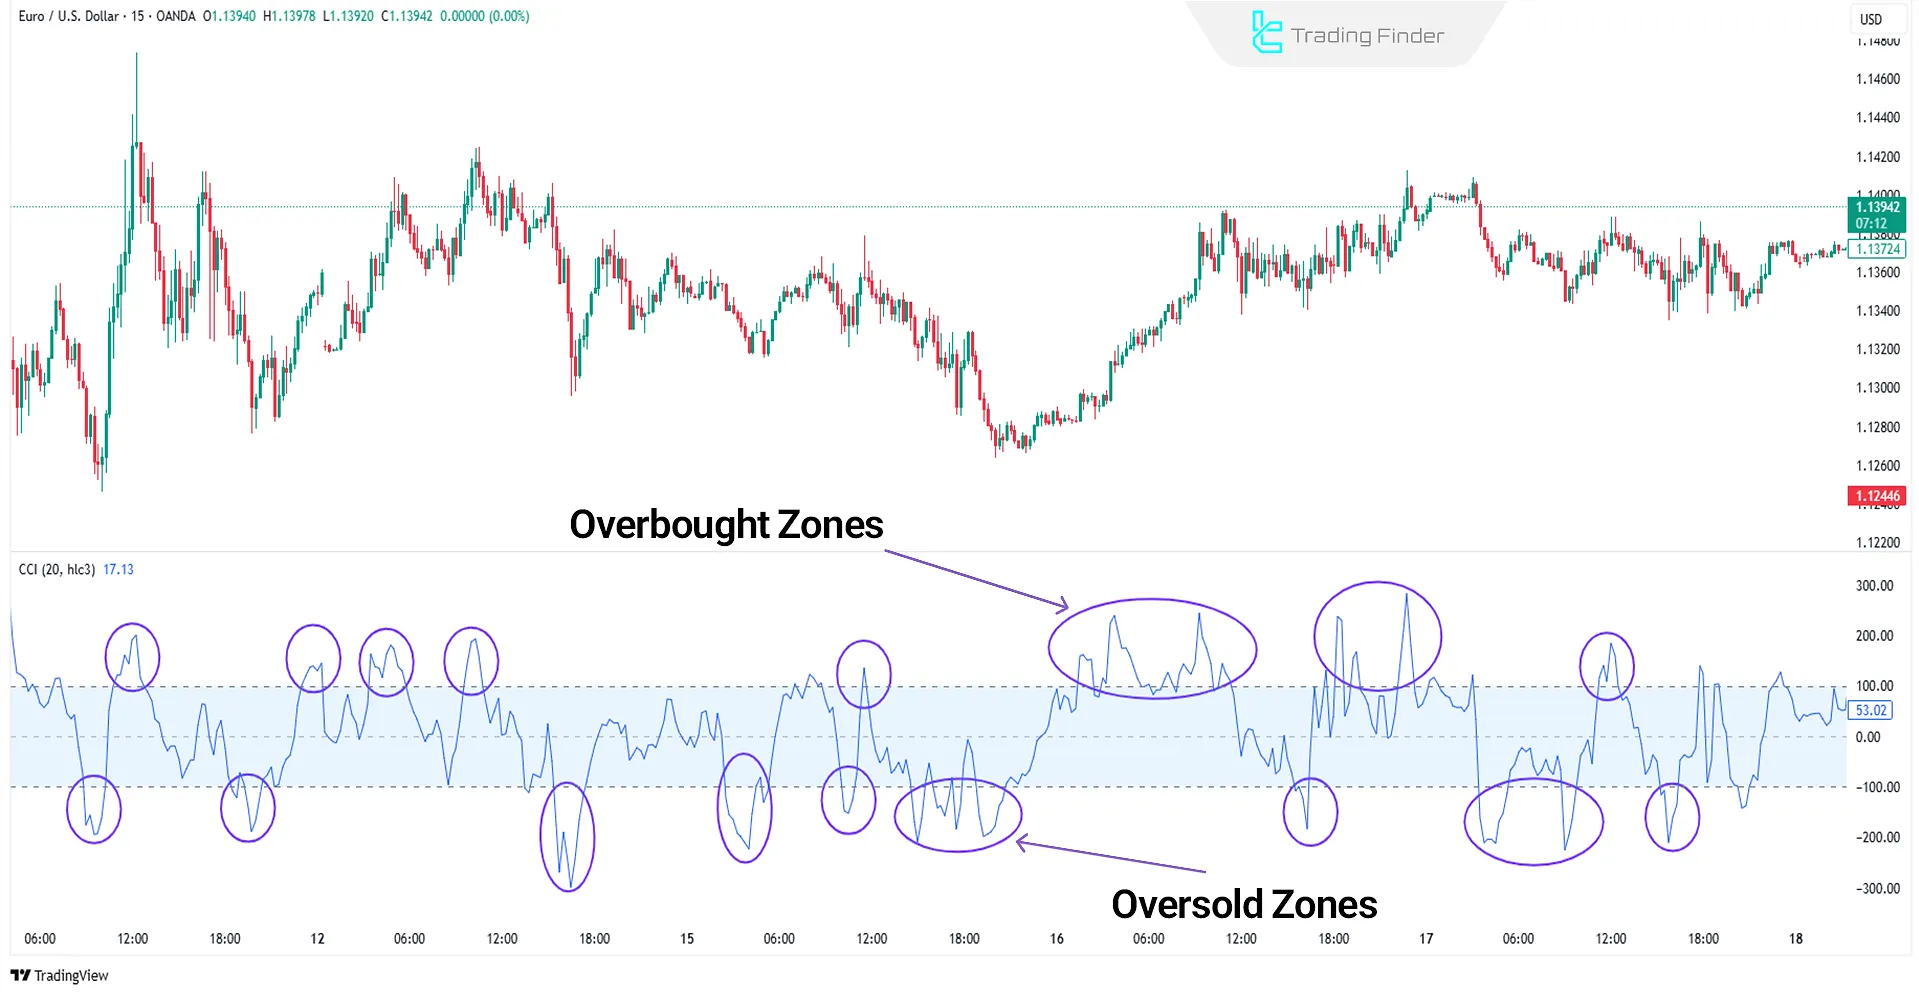
Commodity Channel Index (CCI)
The Commodity Channel Index (CCI) identifies overbought and oversold conditions by measuring price volatility and comparing it to a moving average of prices. This indicator also helps determine optimal entry and exit points in the market.
Due to its high flexibility across timeframes and its ability to anticipate trend reversals, the CCI is widely used in all financial markets.
Overbought and oversold signals in CCI:
- If CCI is above +100, it indicates an overbought condition;
- If CCI is below -100, it signals an oversold condition.
The CCI is also useful for spotting divergences and trend reversal points, with the standard setting being a 14-period timeframe.
For further study and to learn how to trade using the CCI indicator, you can also refer to the educational video on the Trading Chart Analysis YouTube channel:
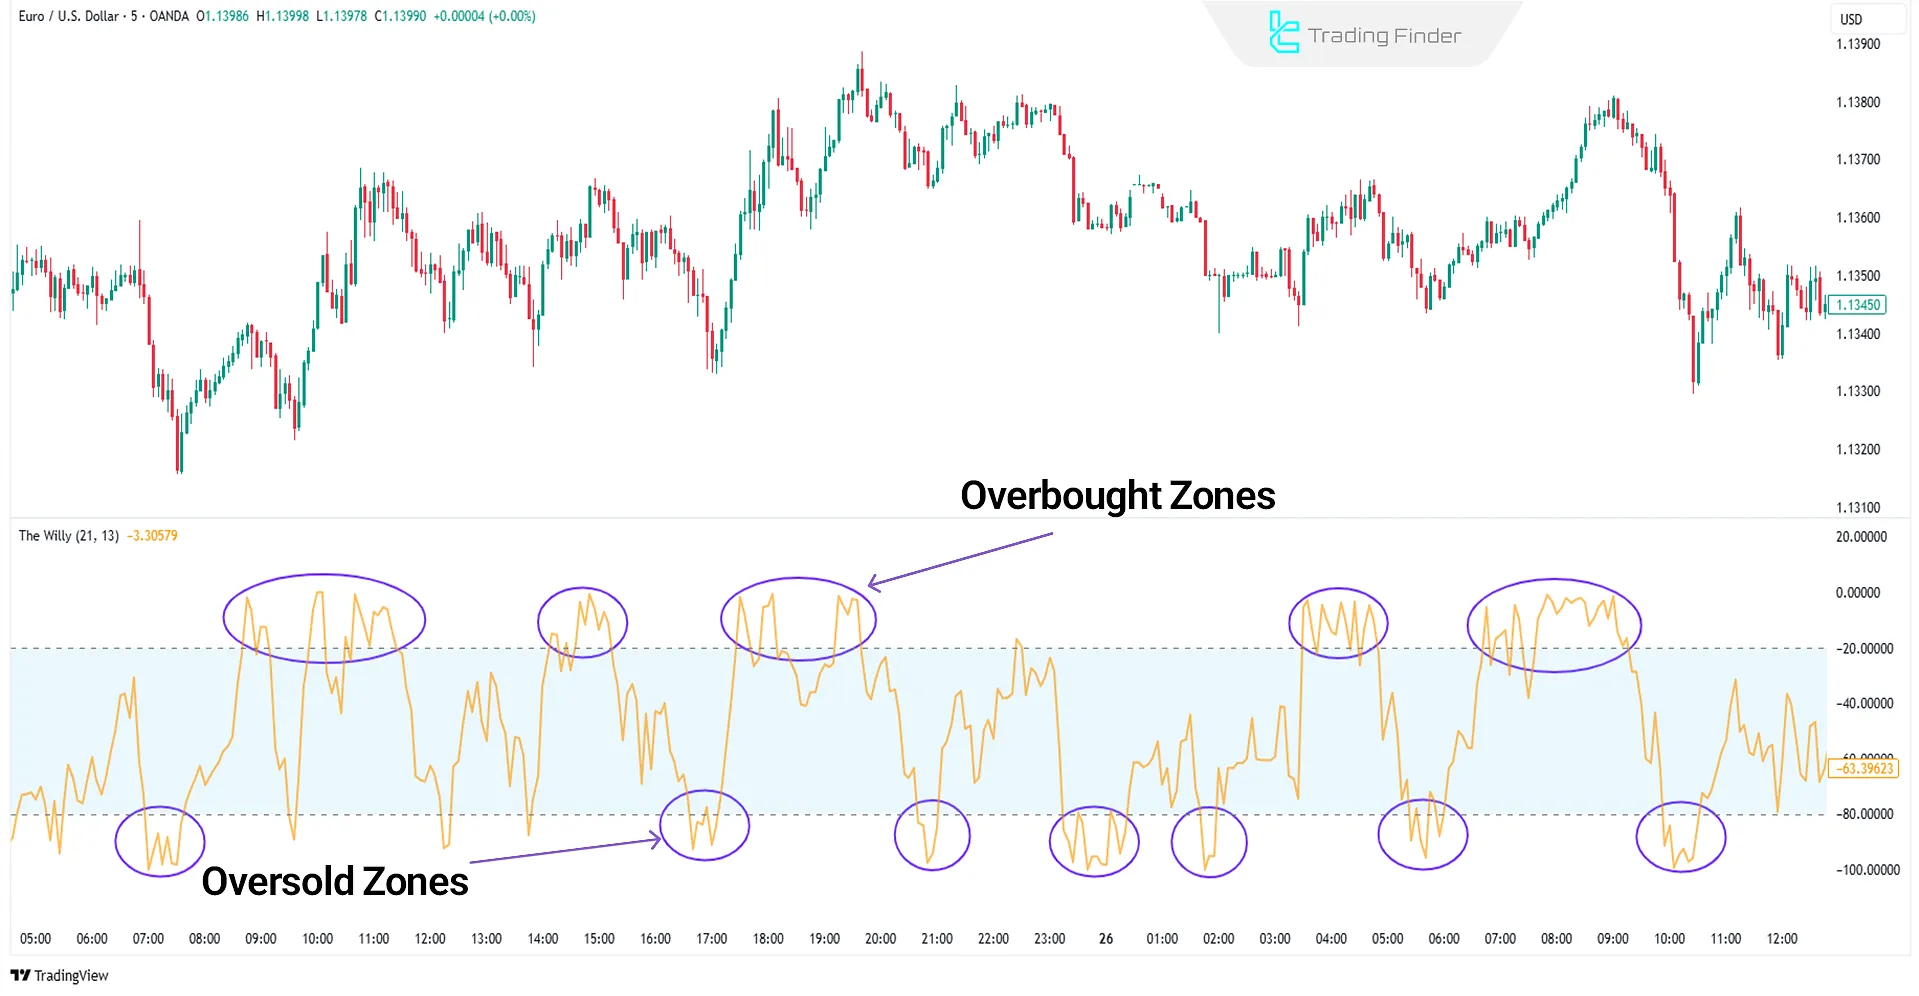
Williams %R
The Williams %R is a leading indicator that detects overbought/oversold conditions, trend reversals, and price momentum.
Unlike RSI, it uses the highest and lowest prices over a given period instead of closing prices.
- Above -20: Overbought
- Below -80: Oversold
- Around -50: Trend identification
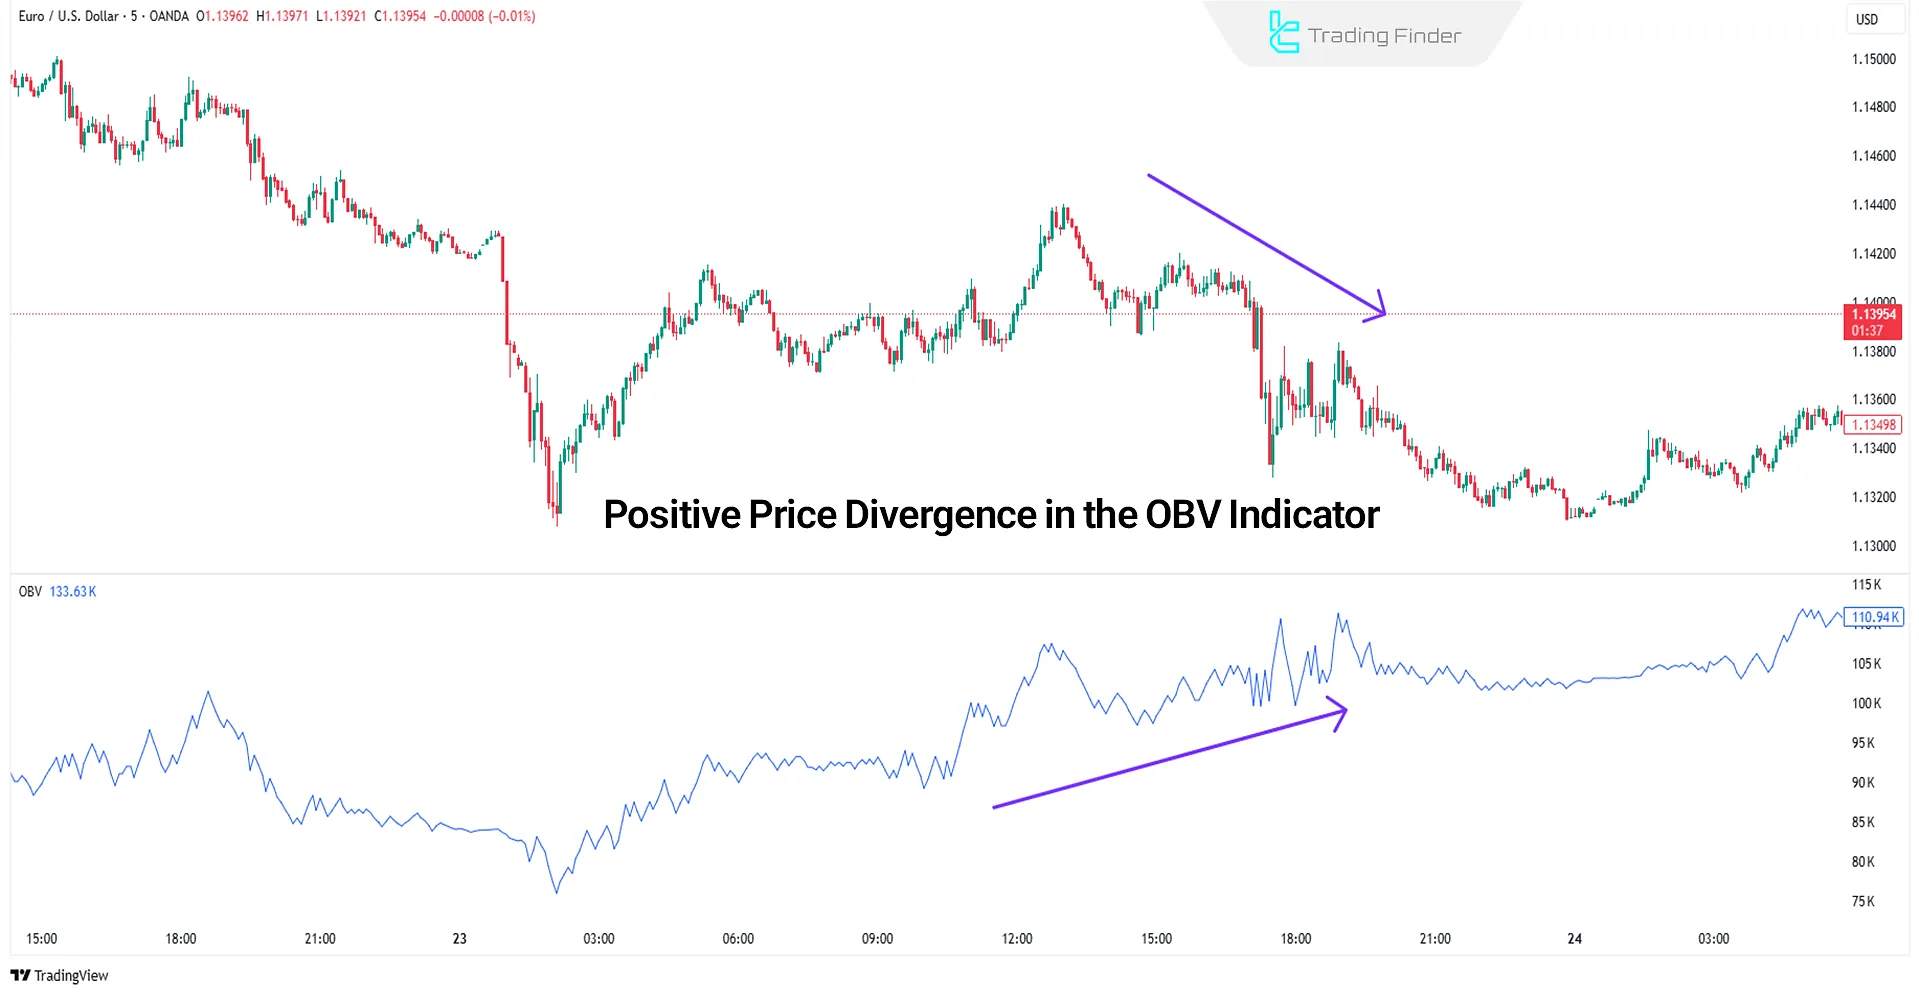
On-Balance Volume (OBV)
The On-Balance Volume (OBV) indicator identifies price trends and trading volume dynamics.
By analyzing changes in volume and their relationship with price movement, the OBV provides traders with signals to predict potential market trends.
- Positive Divergence: Price falling and OBV rising mean potential upward reversal
- Negative Divergence: Price rising and OBV falling lead to potential downward reversal
- Trend Exhaustion: When OBV hits new extremes, the trend may reverse
The Best Combination of Leading Indicators for Trading
Relying on a single indicator often results in false signals. The solution is to use a combination of complementary indicators to cover each other’s weaknesses.
Combining leading indicators increases decision-making accuracy.
Below are some of the best combinations of leading indicators in trading:
- RSI + Stochastic: Both measure momentum; Stochastic identifies more precise entry and exit points, while RSI provides a broader view of overbought and oversold conditions;
- Bollinger Bands + CCI: Bollinger Bands display volatility and price ranges, while CCI measures the deviation of price from its average. This combination enhances the accuracy of identifying reversal points;
- Momentum + Volume Oscillator: Momentum shows the speed of price movement, while the Volume Oscillator confirms whether this move is supported by sufficient volume. This setup is highly effective for spotting the beginning of major market moves.
Important Note: Leading indicators are best suited for generating initial signals; they should ideally be confirmed with a lagging indicator or another technical tool.
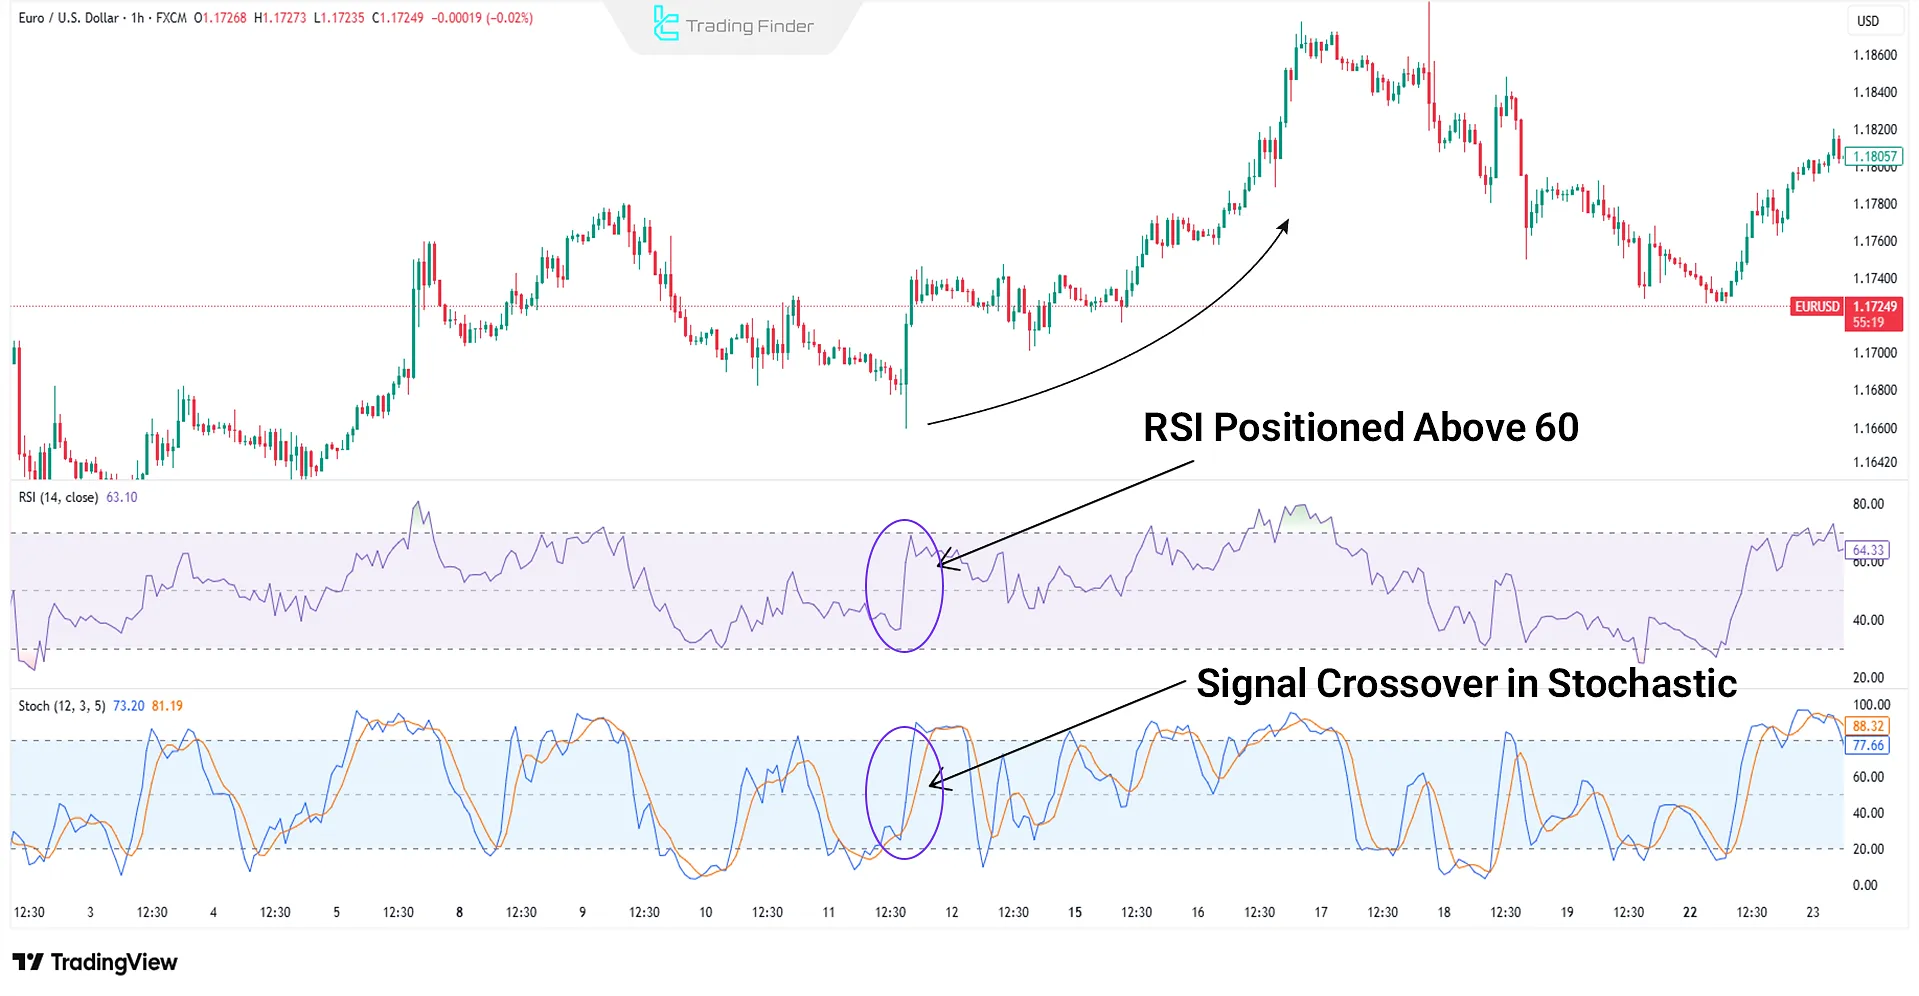
Example of Combining Leading Indicators
Suppose on the EUR/USD one-hour chart, the price is approaching a key resistance level. The RSI indicator, with a reading of 60, shows that buying strength is increasing and has not yet reached the overbought zone.
At the same time, the Stochastic registers a bullish crossover in the mid-range, issuing an entry signal earlier than the RSI.
The combination of these two indicators suggests that the bullish trend still has room to continue and that a low-risk entry point is forming.
In this case, the trader can enter a buy position after a confirming candle closes above resistance and place the stop-loss slightly below the recent low.
MACD RSI Oscillator for MetaTrader
The MACD RSI indicator is an advanced technical analysis tool that combines the core features of the MACD (Moving Average Convergence Divergence) and the Relative Strength Index (RSI).
This hybrid indicator is designed to identify overbought and oversold zones, detect divergences, and generate accurate entry and exit signals in markets such as Forex, cryptocurrencies, stocks, and binary options making it a preferred choice among professional traders.
By simultaneously leveraging the MACD’s ability to represent trend and momentum and RSI’s precision in measuring overbought/oversold conditions, this indicator provides a well-rounded analytical view.
Signal generation mainly relies on the behavior of histogram changes alongside the crossing of the Fast EMA and Slow EMA lines.
The combination of these two components not only displays the market’s dominant direction but also provides deeper insight into bullish and bearish phases while filtering out false signals.
The effectiveness of the MACD RSI becomes especially evident when tested on live charts.
On the H1 chart of a currency pair:
- When the red signal line crosses upward through the pink dashed line and turns green while the histogram simultaneously shifts from negative to positive a valid buy signal is generated;
- Conversely, when the green line crosses above the pink dashed line, turns red, and the histogram moves from positive to negative, it signals the start of a bearish trend, presenting a suitable sell opportunity.
High flexibility is one of the MACD RSI’s strengths. In MetaTrader 5, users can adjust parameters such as Fast EMA, Slow EMA, Signal SMA, and RSI Period.
Additionally, the Caliber setting allows traders to manage the degree of signal delay for divergence detection, fine-tuning the indicator’s responsiveness based on their trading style.
By integrating RSI values into the MACD formula, the indicator provides a smoother and clearer visualization of market momentum.
This combination helps traders make more precise and rational decisions in volatile conditions while minimizing the risk of false entries.
These capabilities make the MACD RSI a strategic and versatile tool for traders across various financial markets.
Advantages and Disadvantages of Leading Indicators in Trading
Leading indicators provide early signals before trend reversals, making them highly attractive for traders.
However, alongside these benefits, they also come with certain limitations and risks, summarized in the table below:
Advantages | Disadvantages |
Early signal before trend change | Generates false signals in ranging markets |
Faster entry and exit compared to other traders | Highly sensitive to short-term fluctuations |
Helps identify overbought and oversold zones | Requires confirmation with additional indicators |
Enhances short-term decision-making power | Less effective on higher timeframes |
Can be combined with price action and patterns | Requires experience and strong risk management |
Common Mistakes When Using Leading Indicators
Improper use of leading indicators can cause analytical errors and trading losses. The most common mistakes include:
- Overusing too many indicators
- Relying entirely on indicators without other confirmations
- Ignoring higher timeframes
Conclusion
Best Leading indicators analyze past market data to forecast future trends and can be used to confirm trading decisions.
These tools in technical analysis are capable of generating signals before trend reversals, helping traders anticipate market changes.


