


Technical analysts in the Forex Market use indicators to measure trends,momentum, overbought and oversold levels, and the strength of price movements. Indicators are statistical calculations based on historical price, volume, and volatility data, presented as charts or numerical values.
Forex indicators and oscillators complement chart analysis, enabling traders to model the structure of price movements and make more informed decisions about entry, exit, or stop points.
What Are Forex Indicators?
Forex indicators are computational models based on price, volume, and exchange rates. They interpret price movement structures and are displayed on trading platforms as charts, lines, or shaded areas.
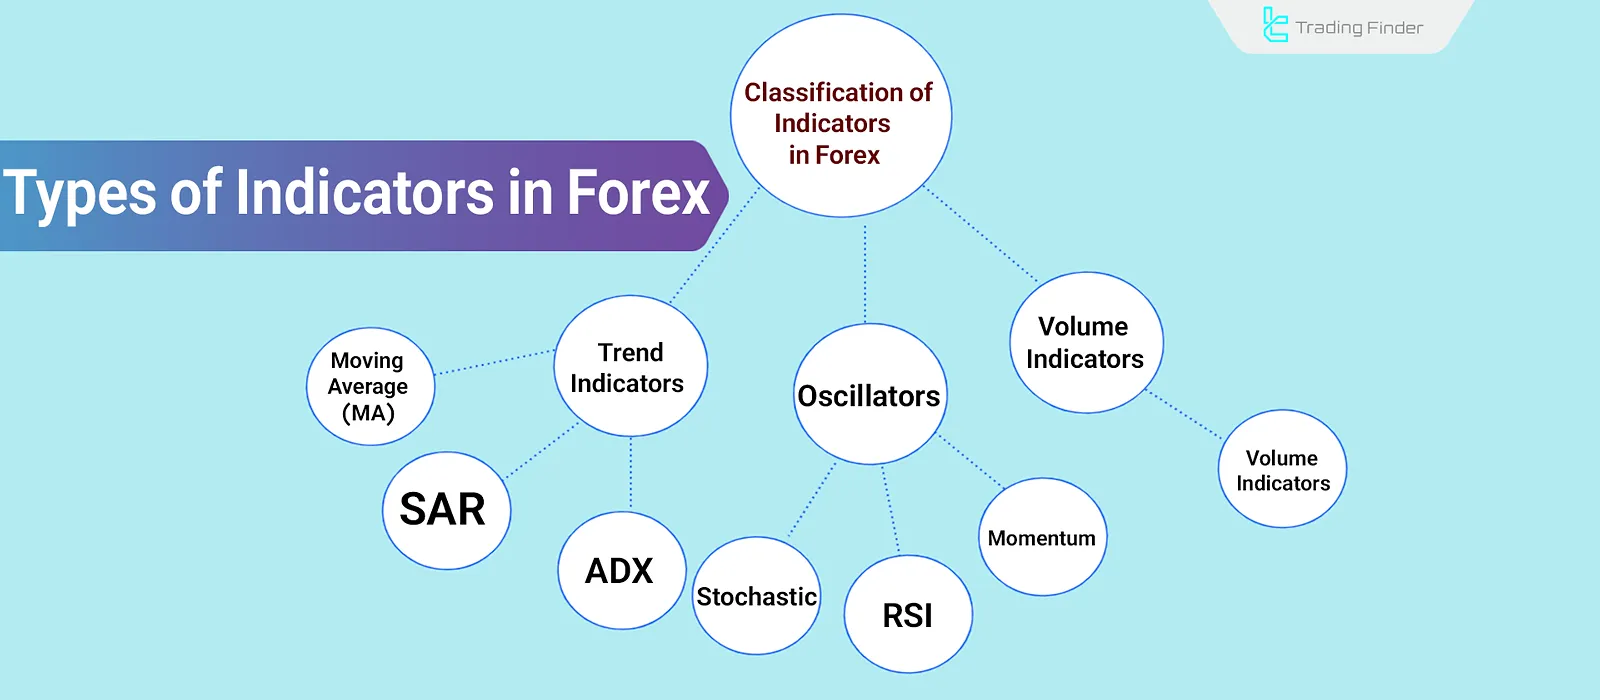
Main Categories of Forex Indicators
Technical indicators and oscillators are mainly divided into three groups:
- Trend Indicators
- Oscillators
- Volume Indicators
Trend Indicators
Trend indicators identify and describe the overall direction of price movements over a specified period. These indicators analyze structural changes in price using historical data and distinguish between bullish, bearish, or sideways phases. Common examples include:
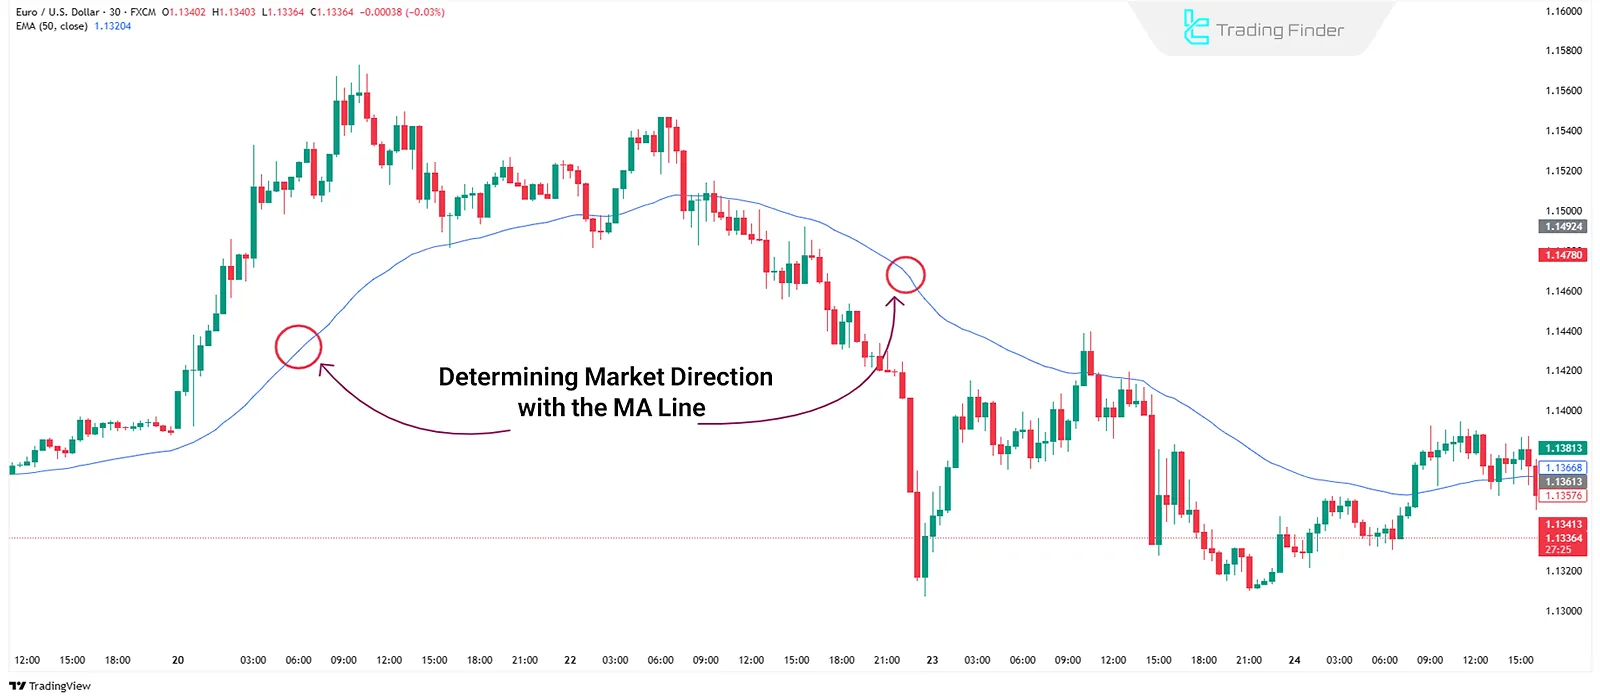
Moving Averages (MA)
Moving averages are among the most widely used trend analysis tools. By calculating the average price over a defined period, they draw a line on the chart that reveals the overall market direction.
Types of Moving Averages:
- SMA (Simple Moving Average)
- EMA (Exponential Moving Average)
- WMA (Weighted Moving Average)
- SMMA (Smoothed Moving Average)
Using the crossover of two moving averages (e.g., 50 and 200 periods) is one of the most common trading strategies.
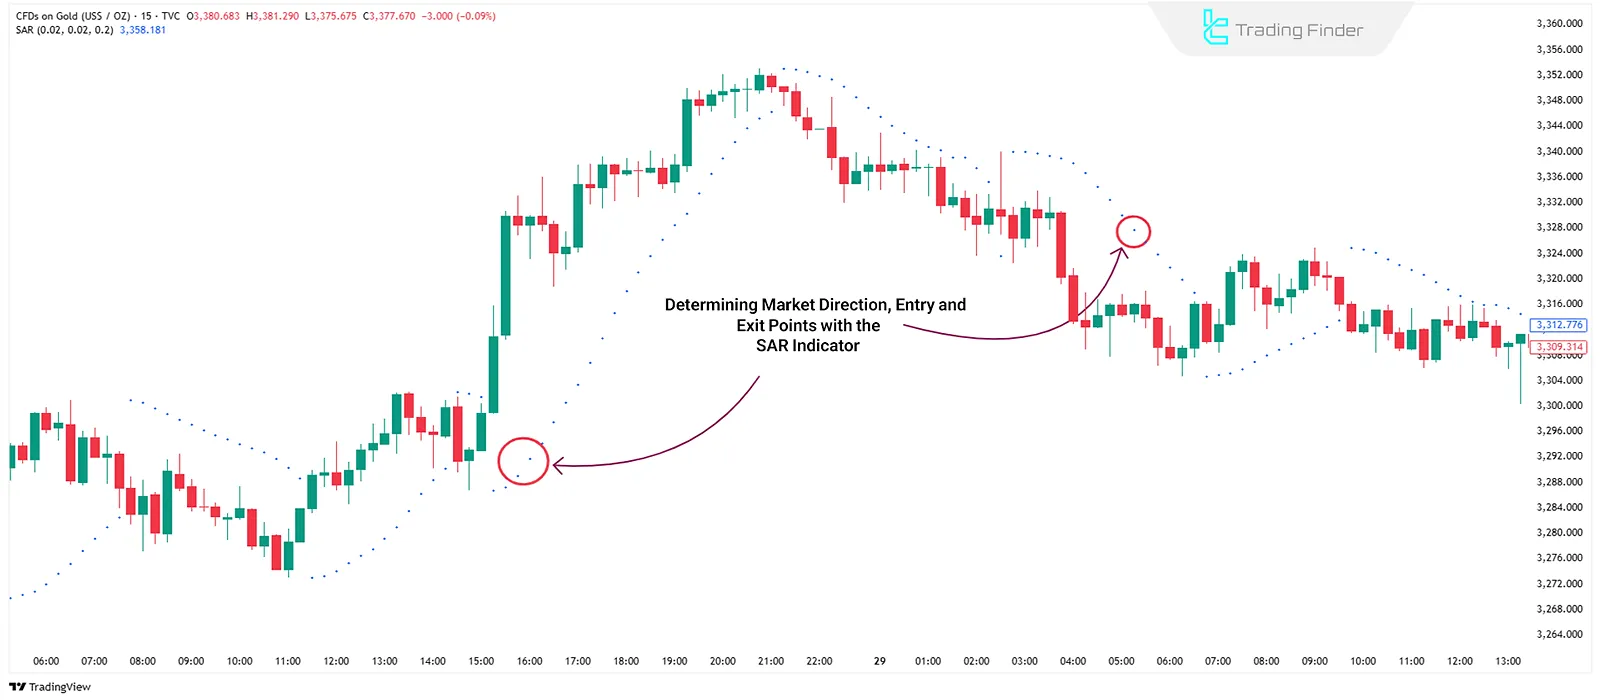
Parabolic SAR
The Parabolic SAR indicator appears as dots above or below the chart. Dots below the price indicate an uptrend; dots above, signal a downtrend. It is useful for identifying quick entry and exit points and managing stop-loss levels.
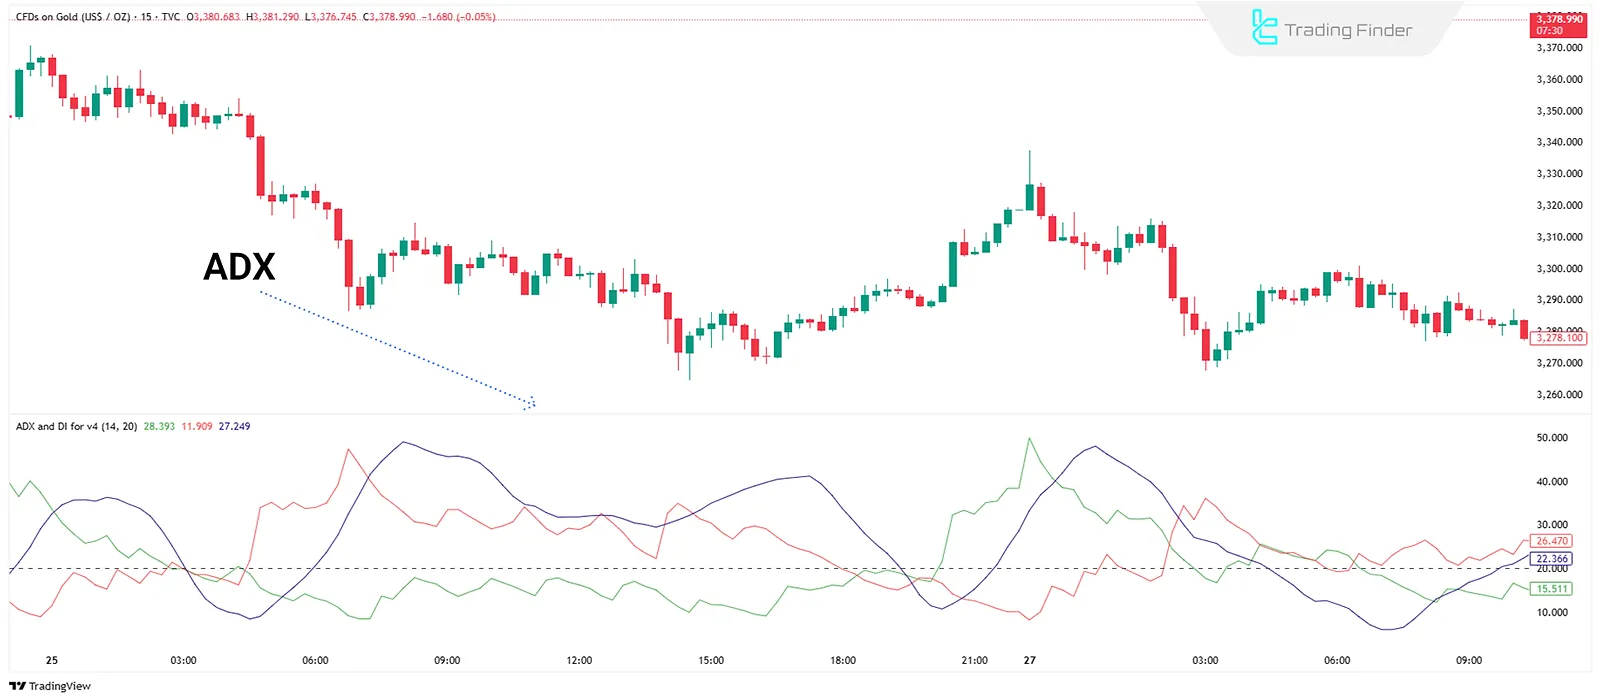
Average Directional Index (ADX)
The ADX indicator measures trend strength. It consists of three lines: DI+, DI-, and ADX. A rising ADX suggests a strengthening trend, while a falling ADX implies weakness or a ranging market.
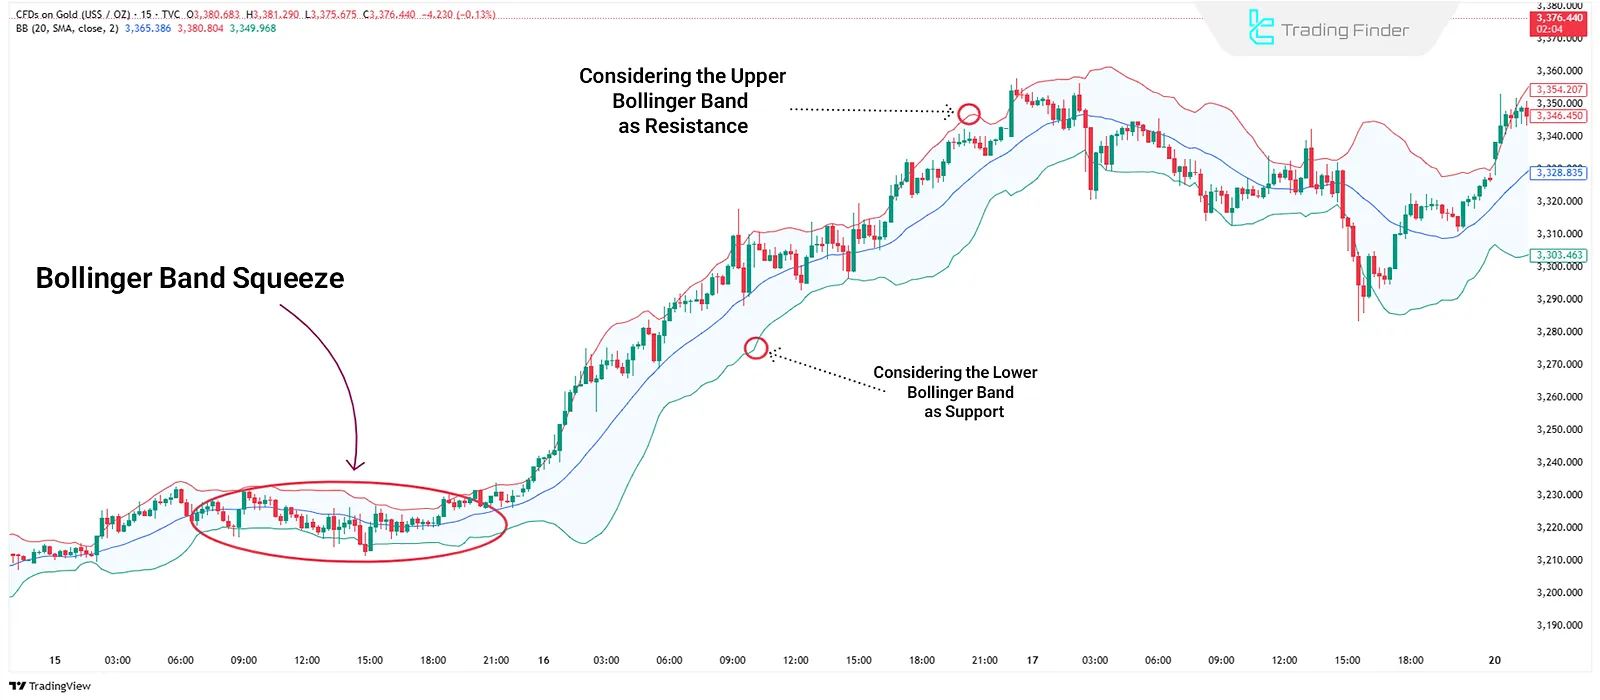
Bollinger Bands
Bollinger Bands combine a moving average with standard deviation to identify volatility and support and resistance levels. Band tightening signals a potential major price move. These bands expand or contract with market volatility and react sensitively to recent price movements.
Oscillators
Oscillators analyze price momentum and identify overbought and oversold zones. These tools fluctuate between two fixed limits to show the strength or weakness of price movements over recent timeframes. Key examples include:
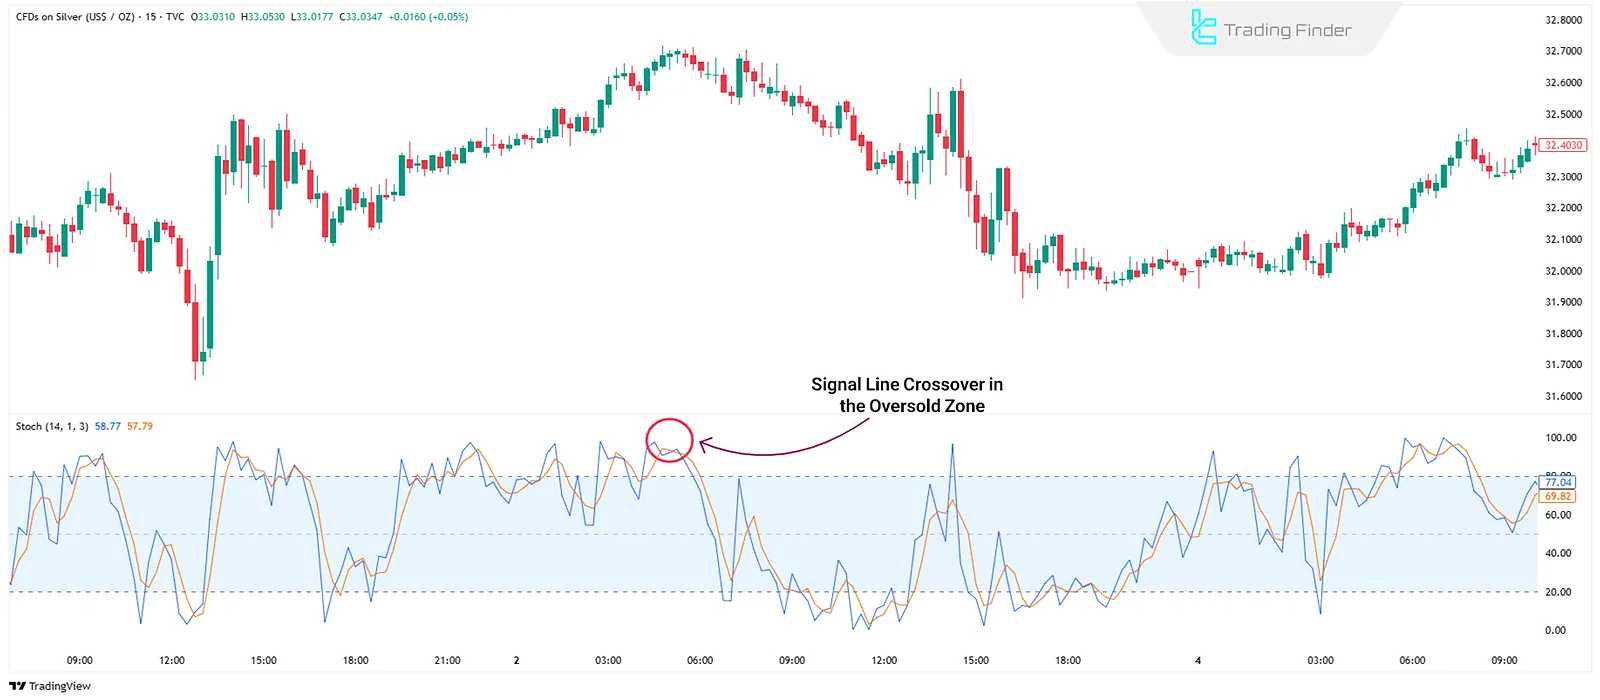
Stochastic Oscillator
This indicator uses %K and %D lines to identify overbought and oversold conditions. Readings above 80 signal overbought; below 20 signal oversold. Line crossovers generate buy or sell signals.
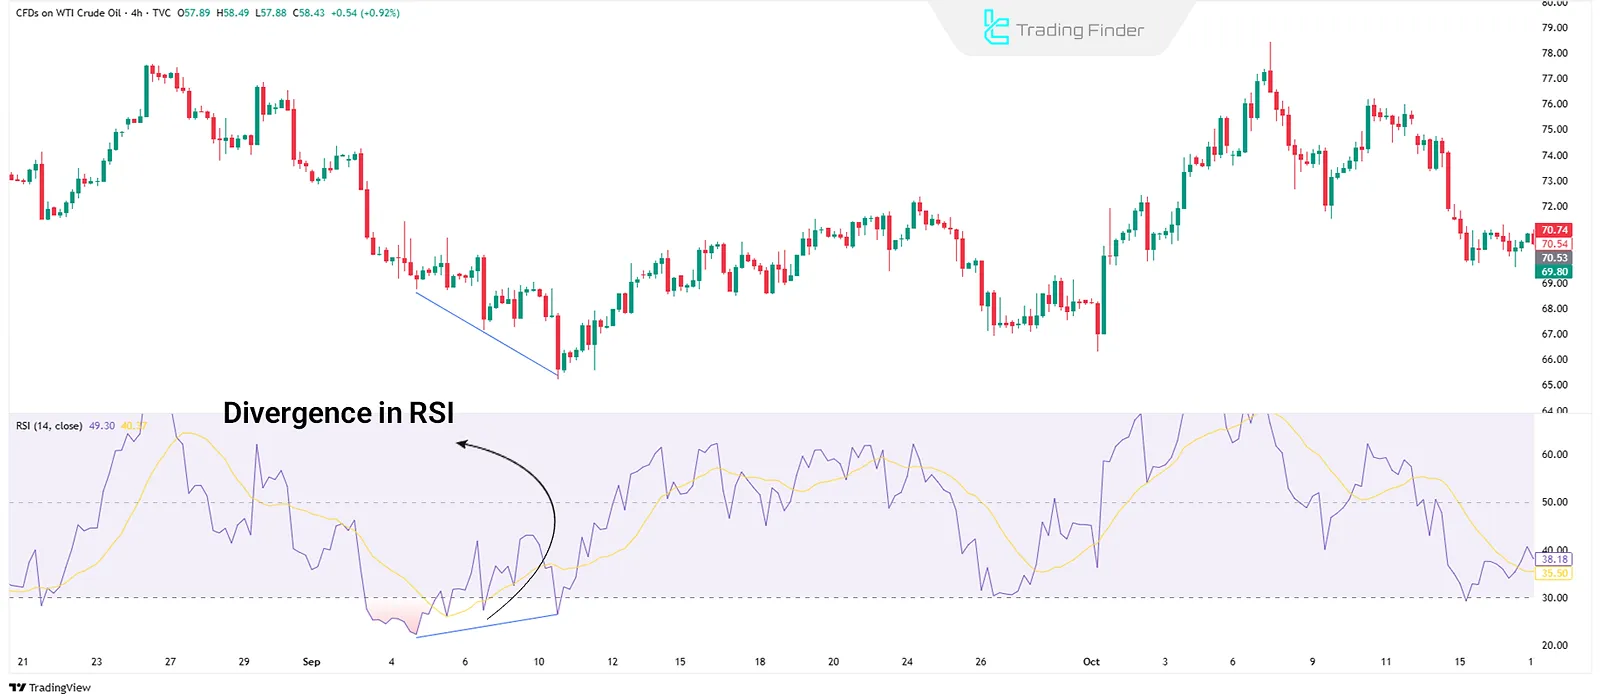
Relative Strength Index (RSI)
RSI compares upward and downward price changes to detect trends, strength, and potential divergences. Divergence between RSI and price often signals a possible trend reversal.
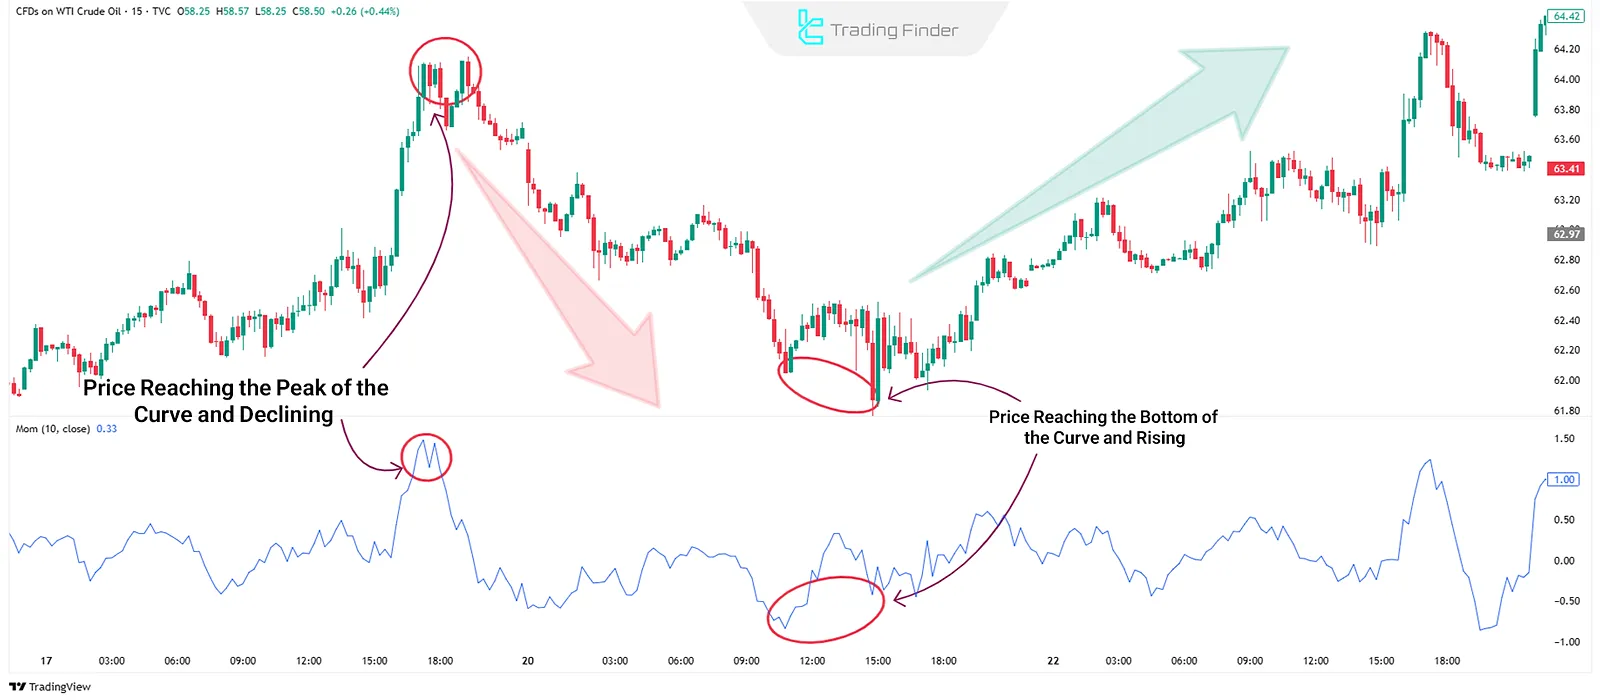
Momentum
One of the simplest indicators, momentum, measures price changes over time. A peak in the momentum curve followed by a decline signals a sell, while a bottom followed by a rise signals a buy.
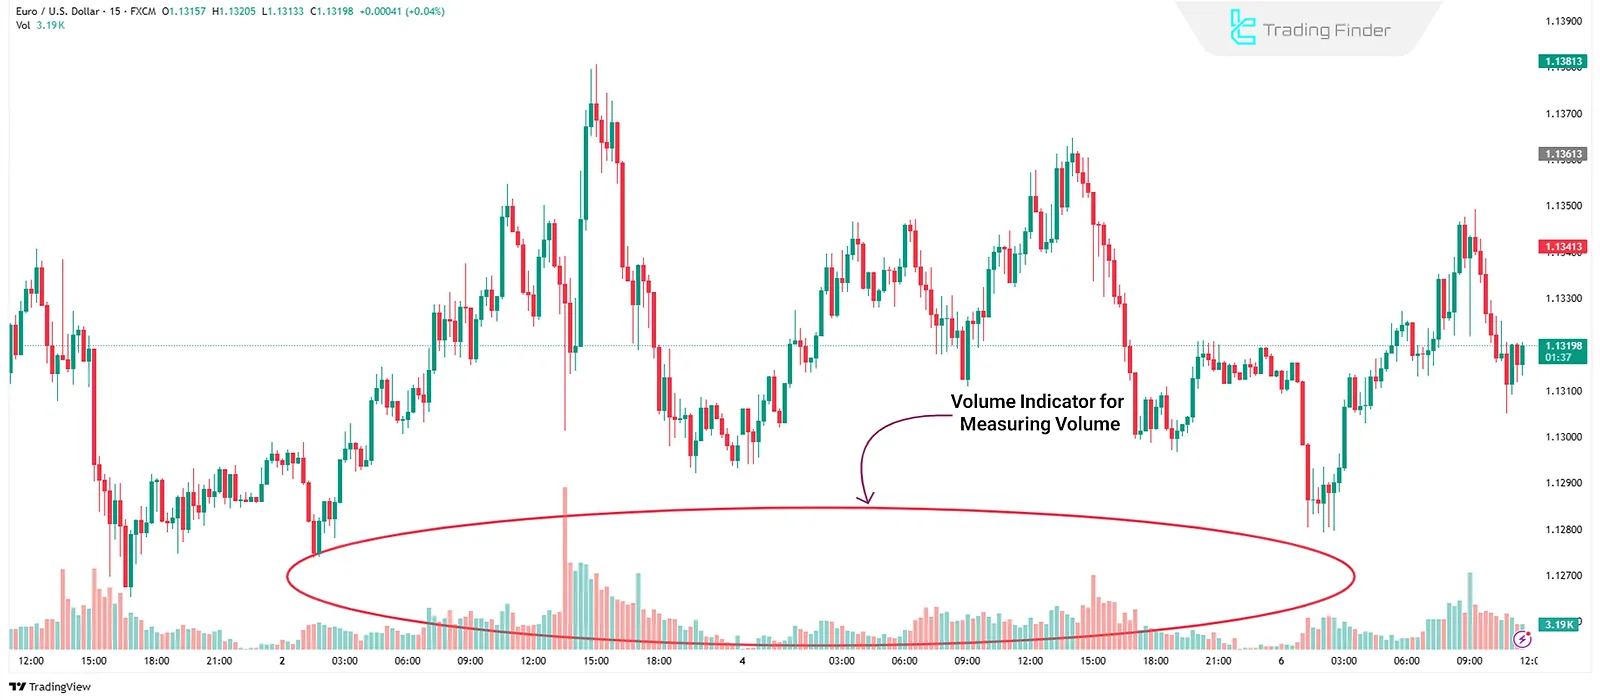
Volume Indicators
Due to Forex's decentralized nature, actual trade volume is not available. However, indicators like Volume, On-Balance Volume (OBV), or Accumulation/Distribution can help detect buying/selling pressure and validate price movement strength.
How to Install Indicators?
To use Forex indicators and oscillators in MetaTrader 4, MetaTrader 5, and TradingView, follow these steps:
- Download and extract the indicator file from Trading Finder;
- Copy the files to the “Indicators” folder in the MetaTrader installation directory;
- Restart the MetaTrader software;
- Drag the new indicator from the “Navigator” panel onto your chart;
- Test it on a demo account first to understand its functionality.
Key Tips for Using Indicators
To get better results and use indicators effectively, consider these best practices:
- Tool Combination: Using multiple indicators can reduce the chance of false signals;
- Match Settings to Timeframe: Adjust indicator settings based on the currency pair and desired timeframe;
- Confirm with Structural Analysis: Trend lines, support/resistance levels, or price patterns can validate indicator signals.
Conclusion
Forex indicators and oscillators are tools used to analyze historical price data, categorized into trend, momentum, and volume-based types.
Indicators like EMA and ADX help identify direction and strength; oscillators like RSI analyze momentum in sideways markets; tools like OBV or VWAP estimate buying/selling pressure.
Accurate interpretation of Forex indicators and oscillators requires precise configuration, integration with other tools, and attention to actual price behavior.


