


Technical Analysis Indicators, based on historical market data, help identify the next potential price movement. These tools analyze market volume and momentum to detect areas with the highest probability of price reaction.
Introduction to 7 Technical Analysis Indicators
In the realm of technical analysis for financial markets like Forex market, Analysis Indicators are primarily used to identify the overall long-term trend. Below, we explore 7 widely-used technical indicators in the market:
MACD Indicator
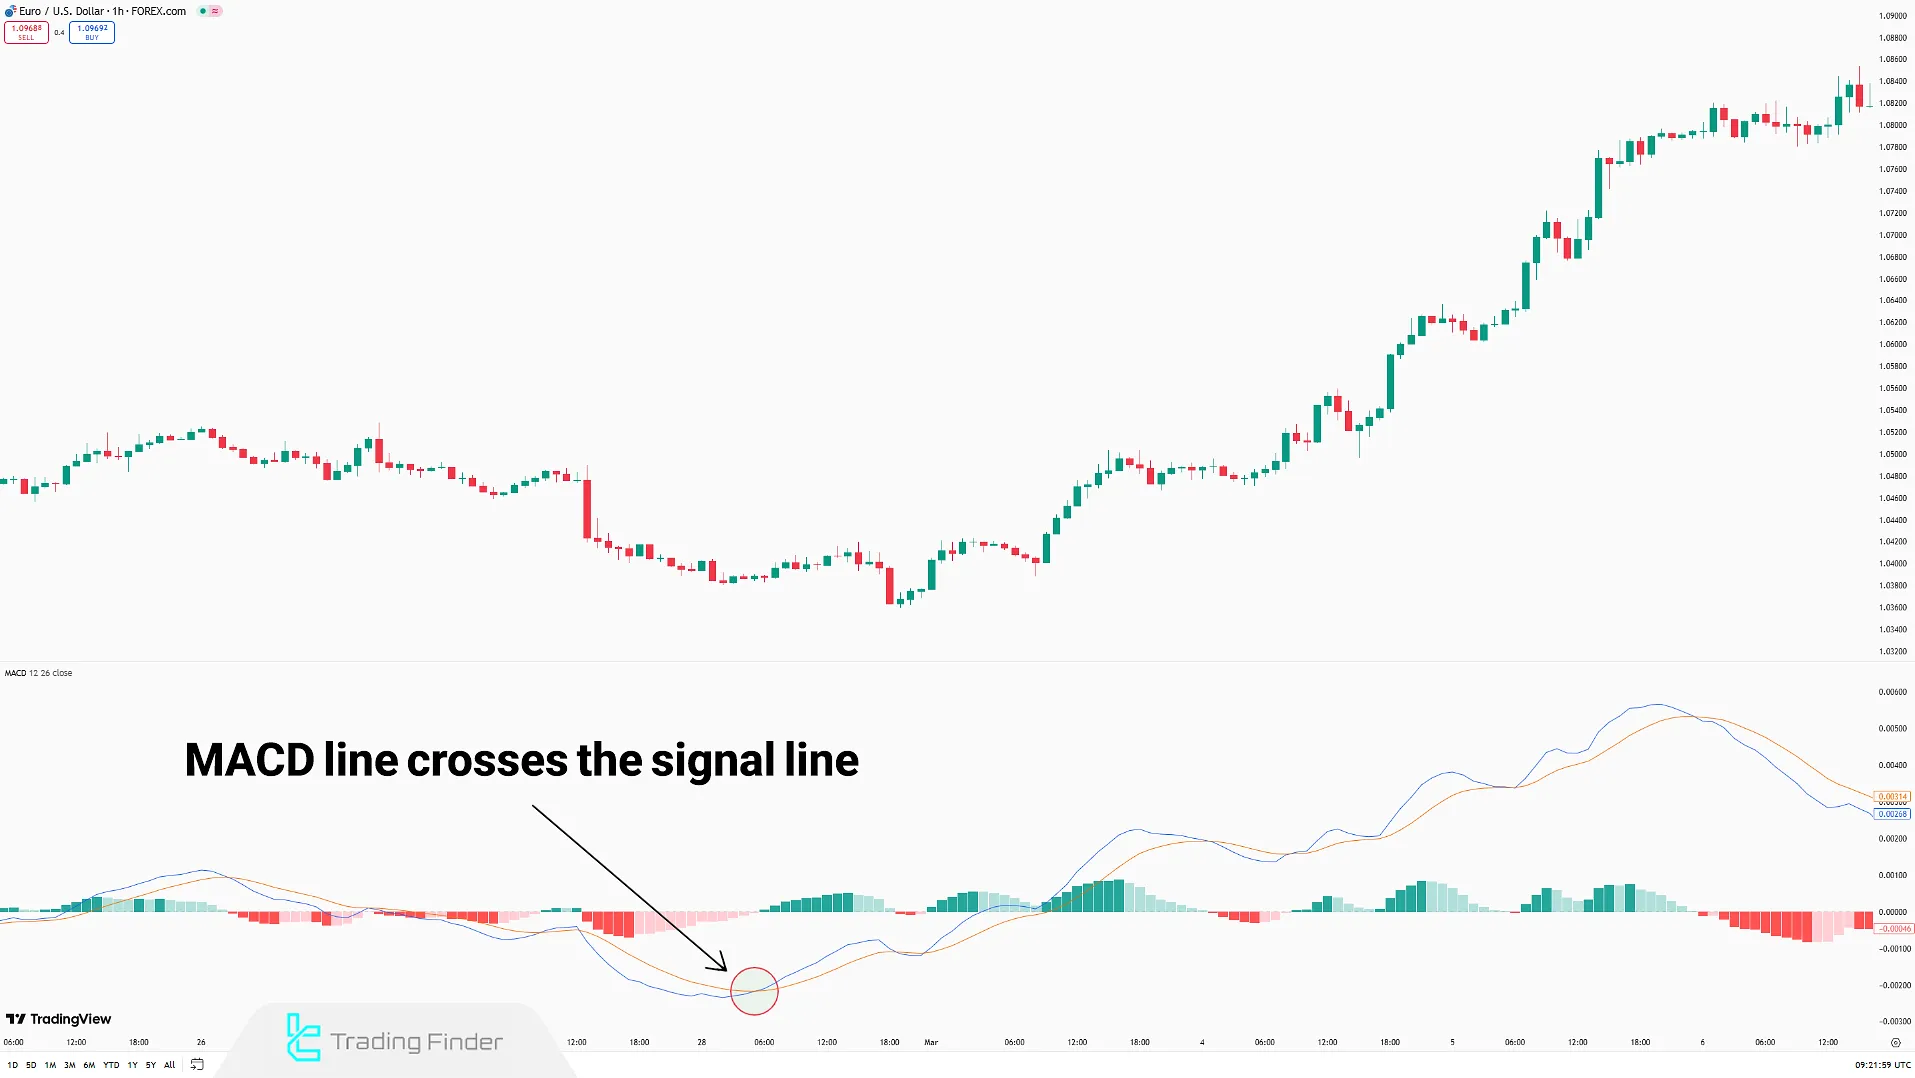
The MACD (Moving Average Convergence Divergence) indicator belongs to the Oscillators category and is designed to detect momentum and trend reversals.
The MACD is constructed from a combination of moving averages and is commonly used for medium- to long-term analysis.
MACD Indicator Signal Types
This indicator generates three primary signals in technical analysis:
- Crossover between the MACD Line and the Signal Line
- Crossing the zero line
- Price divergence
Analysis Indicators like the MACD have greater reliability when they align with the market trend or are combined with other trading tools, such as support and resistance levels or classic patterns.
RSI
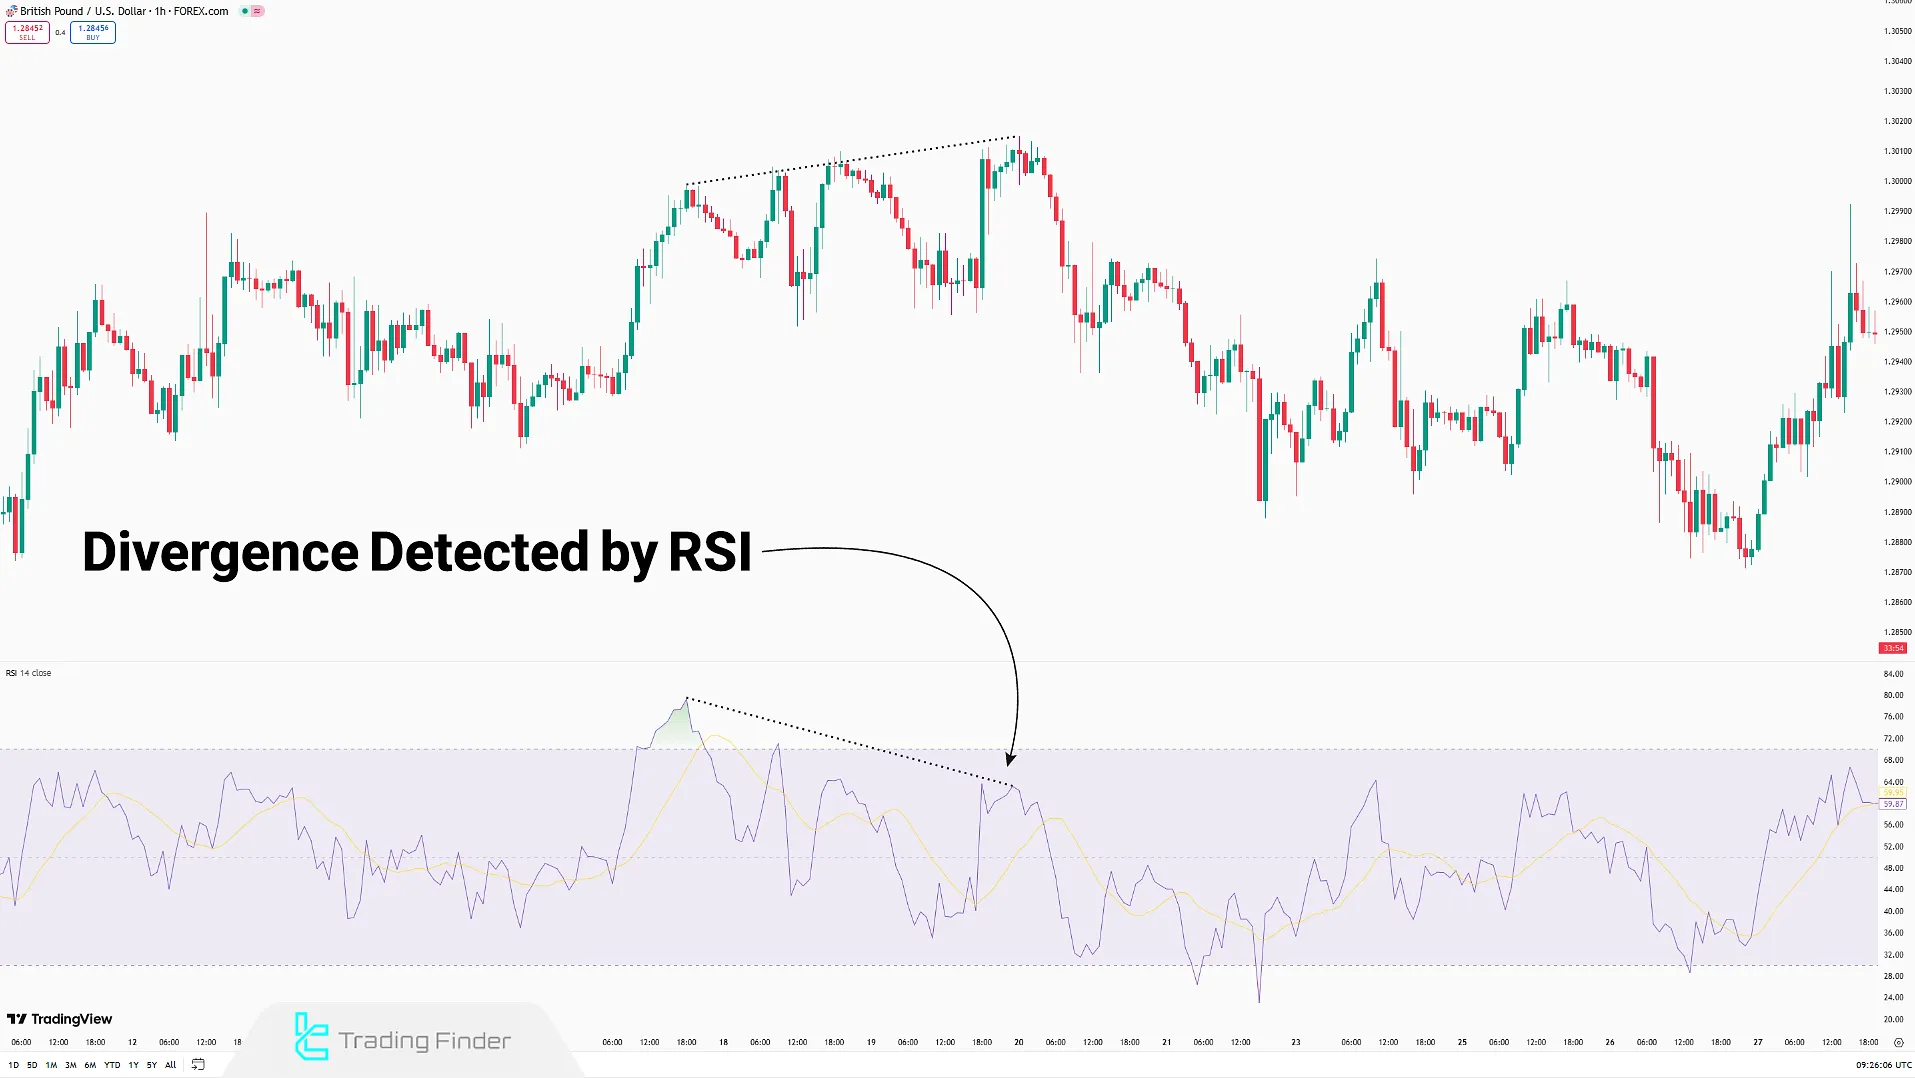
The RSI (Relative Strength Index) is a momentum-based oscillator that measures the strength of market price movements, comparing upward and downward movements. It oscillates between 0 and 100 and is mostly used to identify overbought and oversold zones.
RSI Indicator Signal Types
Though often used to assess long-term trends, this technical indicator provides two main types of signals:
- Detecting reversal points through identifying overbought or oversold zones
- Identifying divergence between price and the RSI
The RSI alone is not sufficient for trade entries and is commonly combined with price action.
Ichimoku
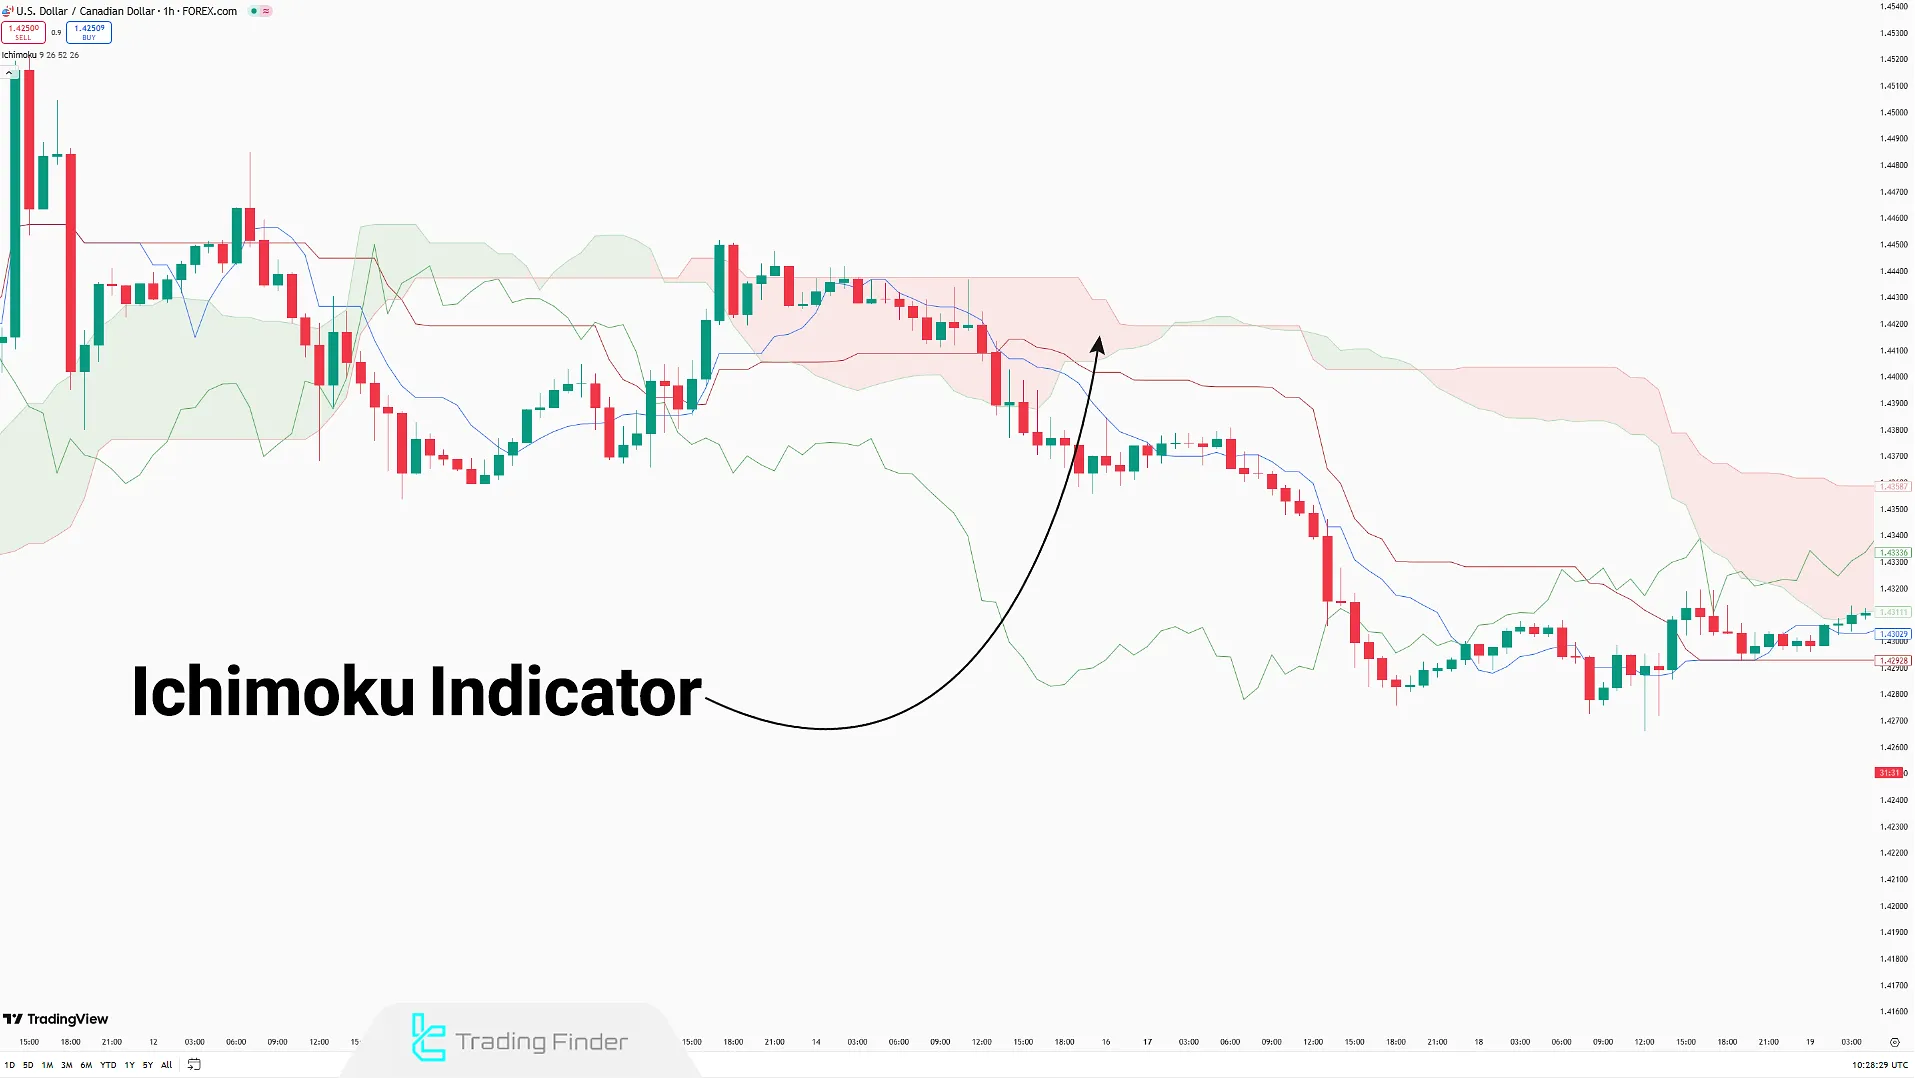
Ichimoku is a comprehensive Japanese analysis system that simultaneously offers insights on trend, support/resistance, momentum, and entry/exit signals. It consists of five key components:
- Tenkan-sen (Conversion Line)
- Kijun-sen (Base Line)
- Senkou Span A (Leading Span A)
- Senkou Span B (Leading Span B)
- Chikou Span (Lagging Span)
Ichimoku Indicator Signal Types
The Ichimoku indicator offers numerous entry signals. Here are three of the most commonly used ones in technical analysis:
- Crossover between Tenkan-sen and Kijun-sen
- Price crossing the Kumo Cloud
- Chikou Span forming above or below the price
The Ichimoku is one of the few technical analysis indicators that does not necessarily need to be combined with other tools.
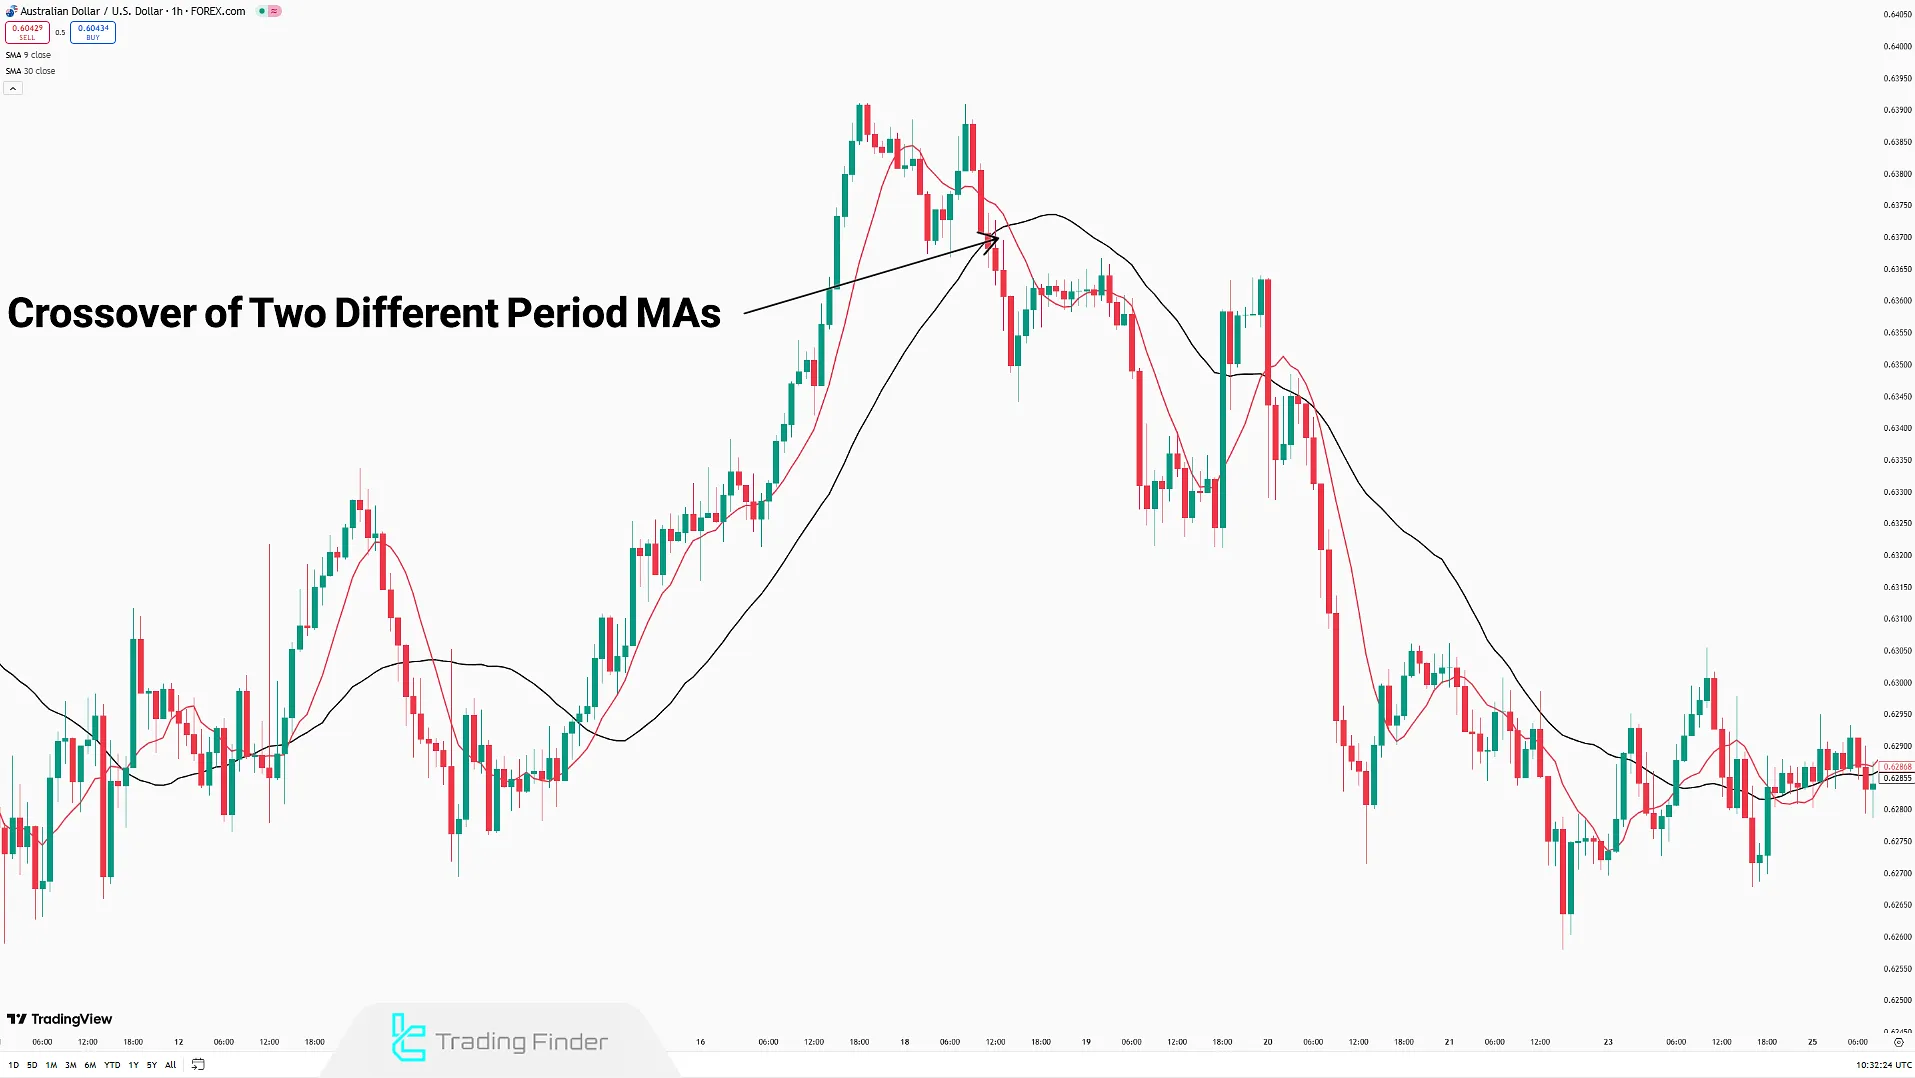
Moving Average (MA)
The Moving Average is a trend-following indicator that smooths price fluctuations to identify the general market direction. It is used in technical analysis to detect reversal points, trend structures, and support/resistance zones.
There are two main types of Moving Averages:
- Simple Moving Average (SMA)
- Exponential Moving Average (EMA)
Moving Average Signal Types
This Analysis Indicator offers signals in three primary ways:
- Price crossing the Moving Average
- Two or more Moving Averages with different periods crossing each other
- Slope direction of the Moving Average
The Moving Average is among the most adaptable indicators and can be easily integrated with various analytical strategies.
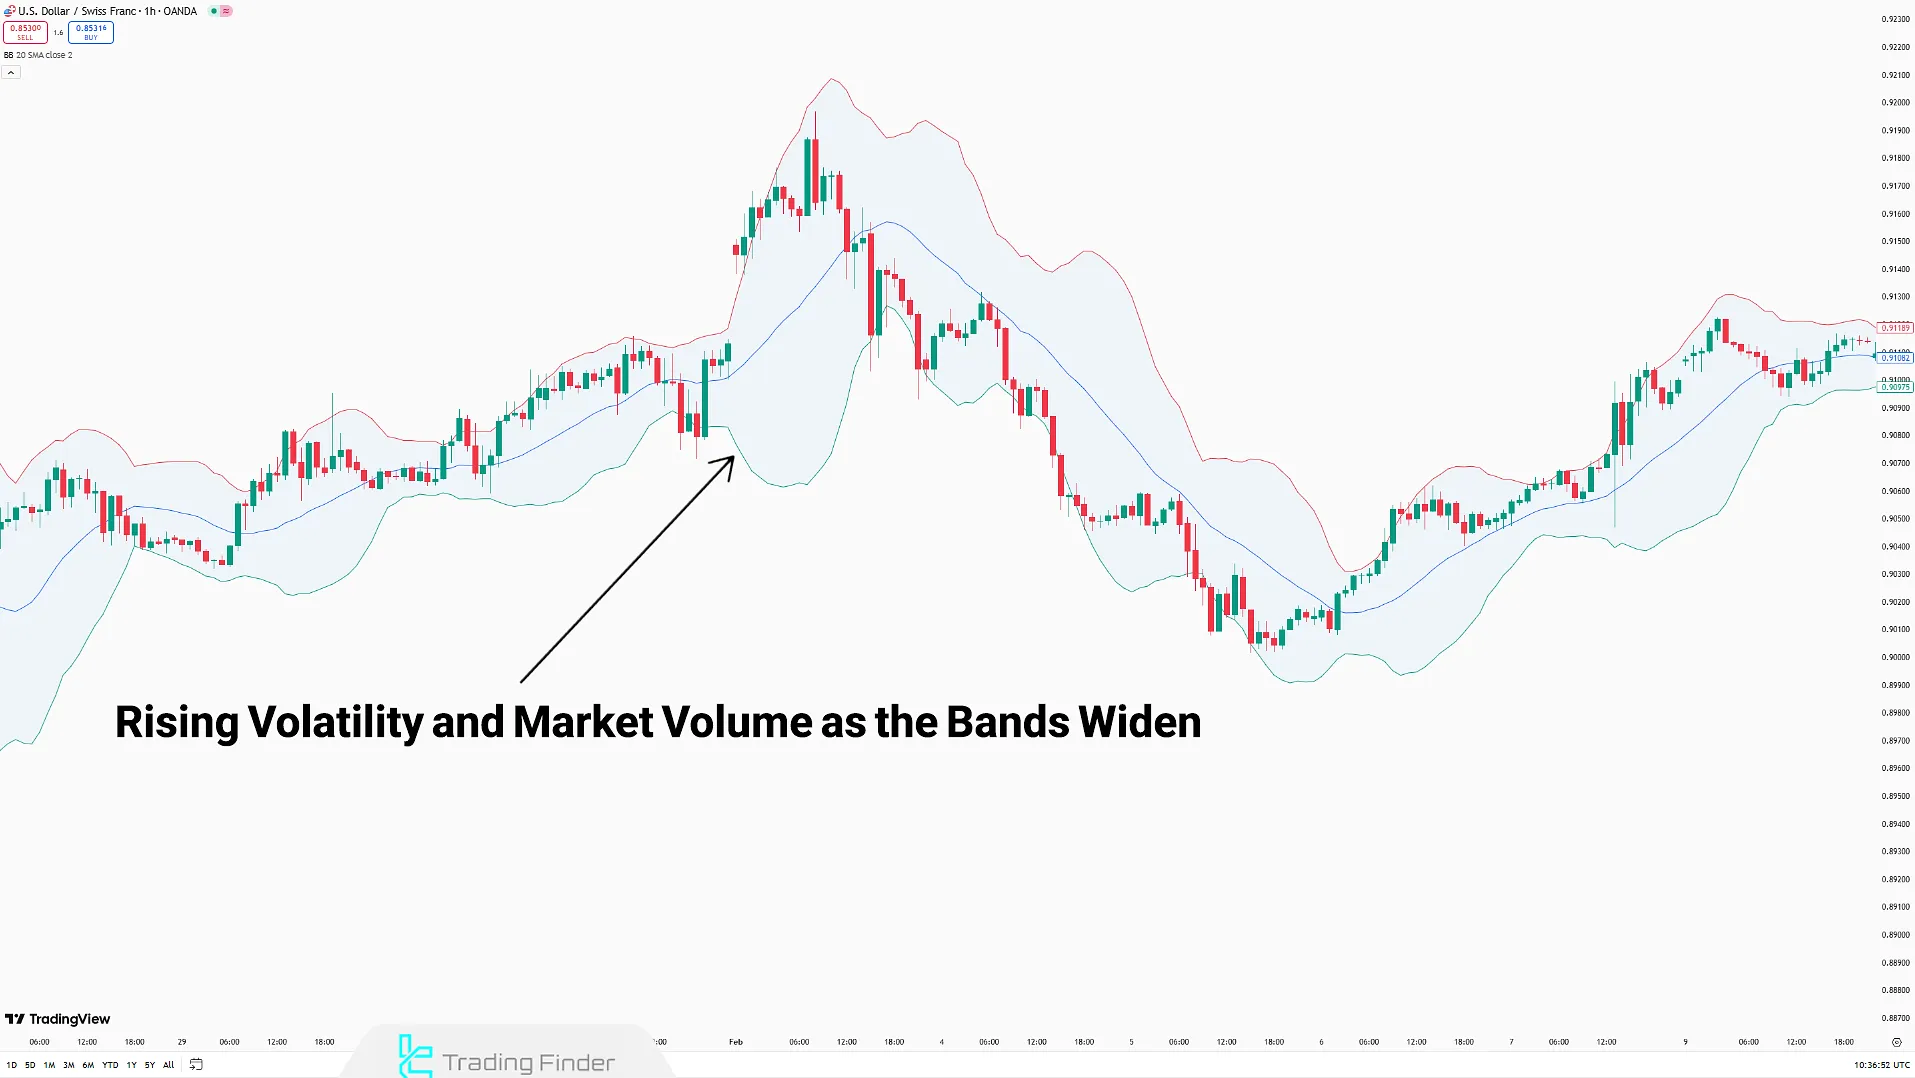
Bollinger Bands
The Bollinger Bands indicator is a volatility-based indicator, consisting of a simple moving average (SMA) and two upper and lower bands.
The distance between the bands and the moving average is calculated using historical market data. The Bollinger Band is used to identify overbought and oversold conditions, price squeezes, and key breakout levels.
Bollinger Bands Signal Types
This technical analysis indicator provides trading signals in three ways:
- Price touching or moving outside the bands
- Bands expanding or contracting
- Price moving within the band channel
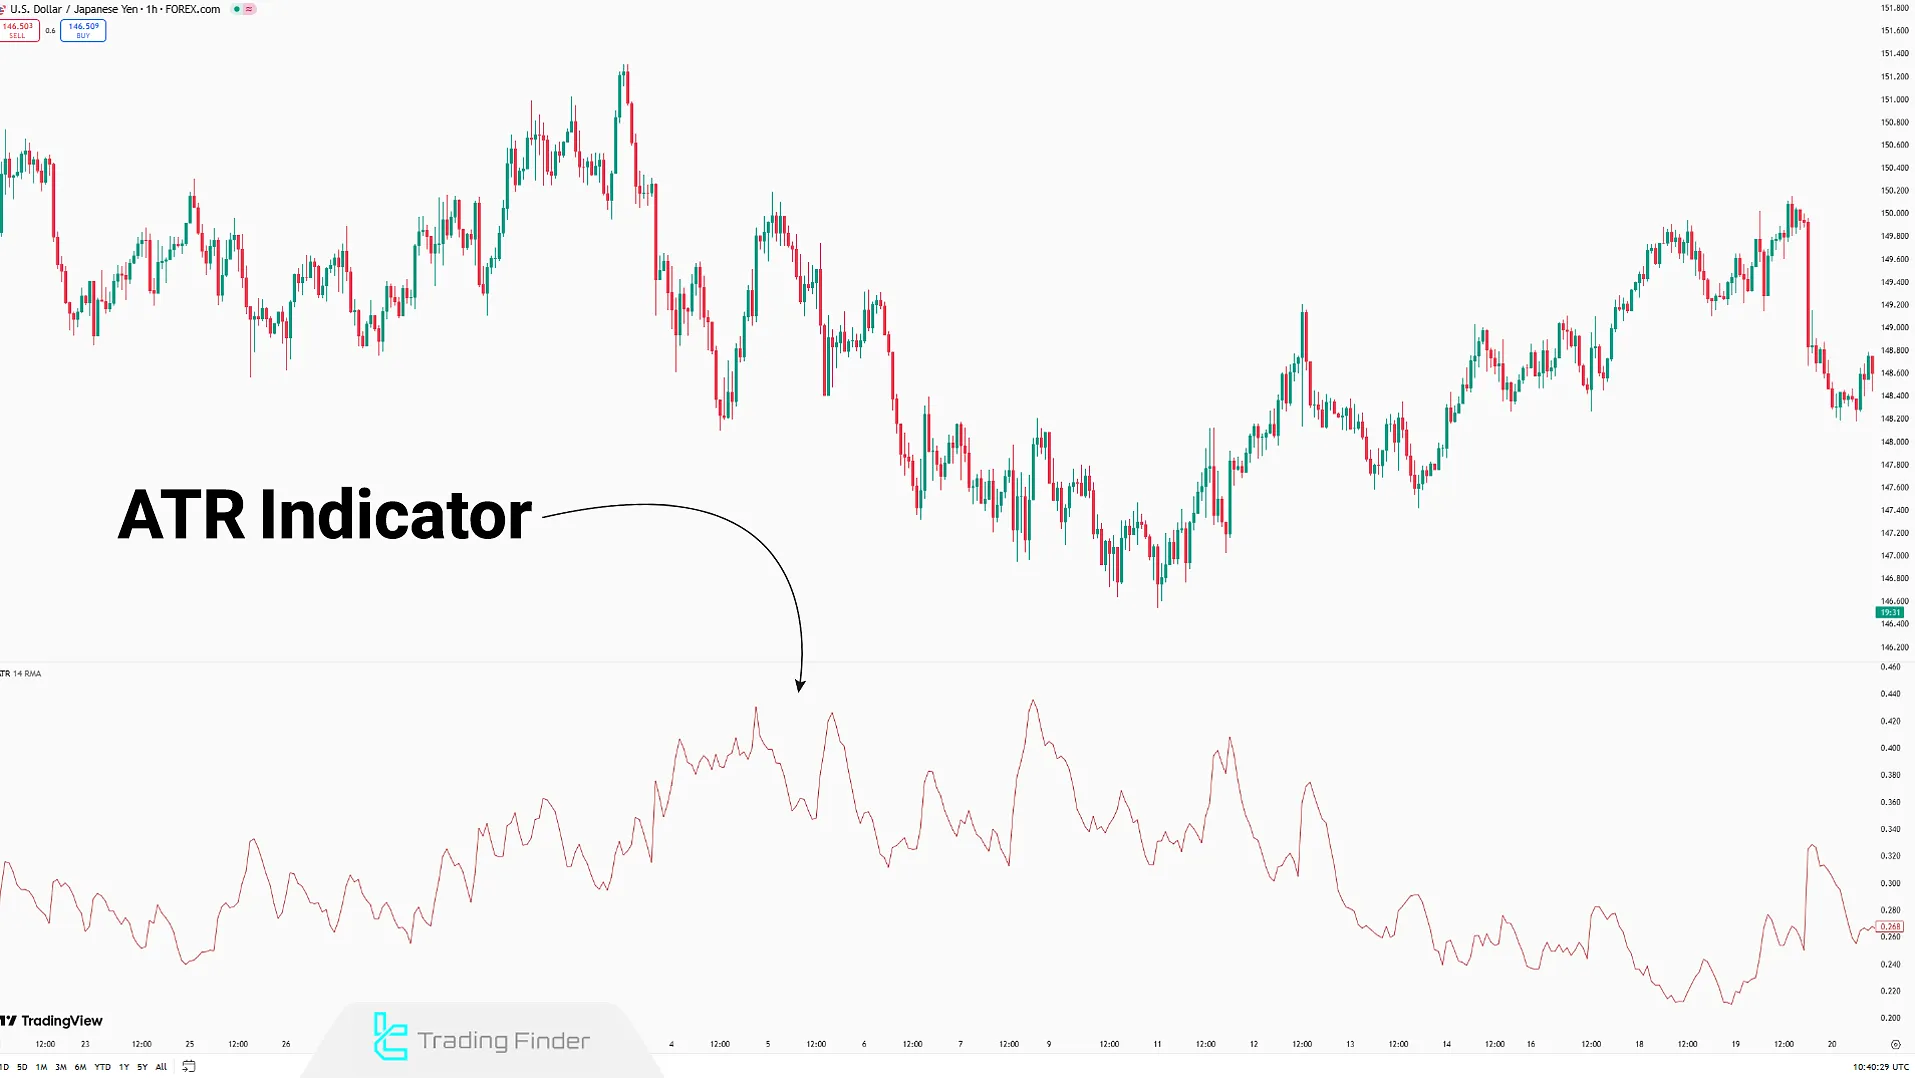
Average True Range (ATR)
The ATR indicator is a volatility-measuring tool that calculates the range of price movement over a given period. ATR is used to identify the strength of movements, not their direction, and is mainly applied in risk management and filtering trade signals.
Since the ATR does not indicate the direction of price, it cannot provide direct buy or sell signals. Its role in technical analysis is to confirm signals from other methods by highlighting the intensity of price movement.
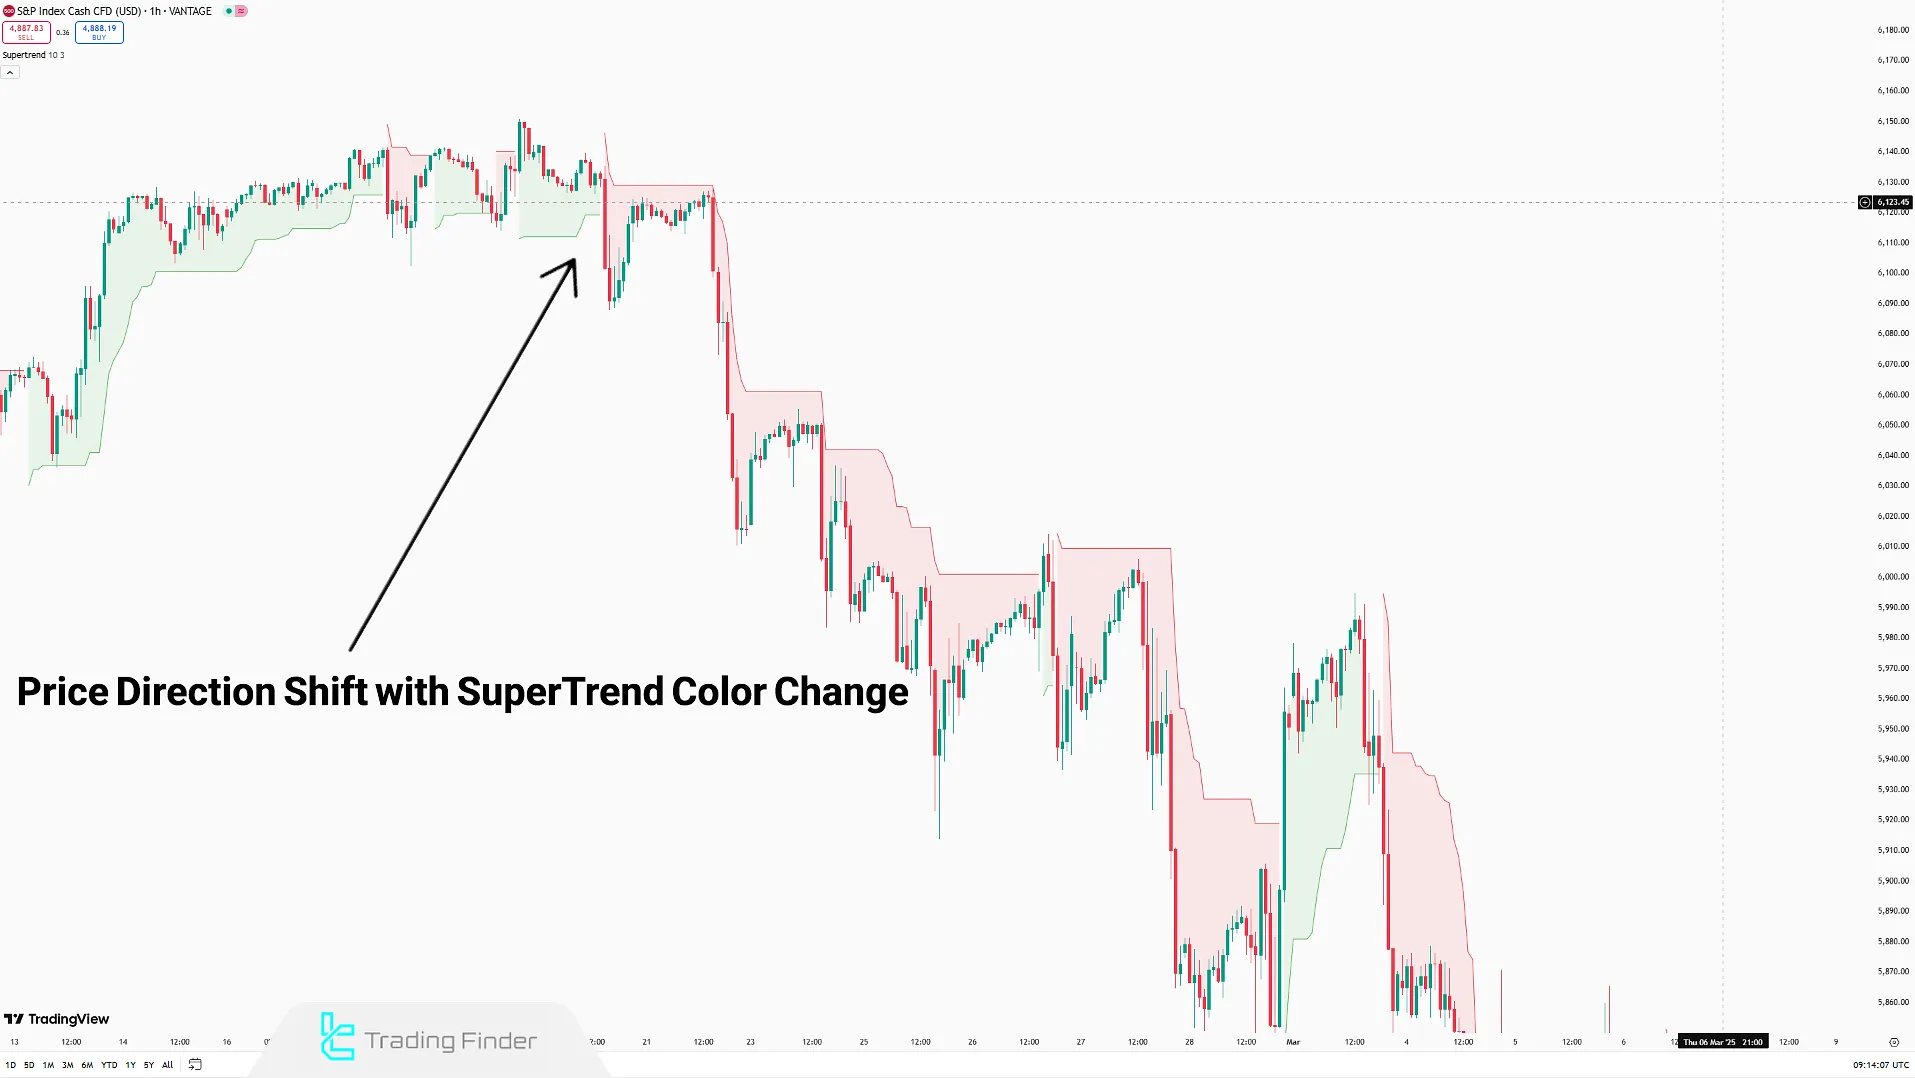
SuperTrend
The SuperTrend is a trend-following indicator that combines ATR and price to mark entry and exit points directly on the chart. Unlike momentum indicators like RSI, the SuperTrend is plotted directly on price and is suitable for tracking trends across various timeframes.
SuperTrend Signal Types
The SuperTrend indicator generates trade signals in three ways:
- Color change of the SuperTrend line
- Change in the position of the line relative to price
- Widening gap between the SuperTrend line and price
Pros and Cons of Technical Analysis Indicators
Indicators are not fixed tools; their performance depends on factors like market structure, strategy, and timeframe. Like all technical analysis methods, they come with unique strengths and weaknesses:
Pros | Cons |
Simplifies Price Charts | Signal Lag |
Standardizes Decision-Making | False Signals in Ranging Markets |
Can be Integrated With Other Strategies | Dependent on Settings |
Assists in Risk Management | May Cause False Confidence |
Useful for Automated Trading Systems | May Ignore Market Context |
Conclusion
To choose the right technical analysis indicators, you must consider factors such as market structure, volatility, and the price phase. Combining indicators in technical analysis enables diverse applications — for instance, using divergence signals from RSI along with MACD crossovers can help detect momentum shifts in slow-moving trends.
All indicators rely on past market data, which is often seen as a weakness when using indicators for future predictions.


