In binary options trading, entry and exit timing has a direct impact on profit and loss. Since the trade outcome is simply yes or no (Up/Down), accuracy in chart analysis must be at the level of seconds.
For this purpose, traders can use various Binary options charts such as Heiken Ashi, Renko, and Bar to increase analytical precision.
The smallest mistake in trend or signal recognition leads to the loss of the entire trade capital.
Therefore, Reading Binary Options Charts means combining price action, key levels, and candlestick behavior analysis, each of which can be applied using different types of charts.
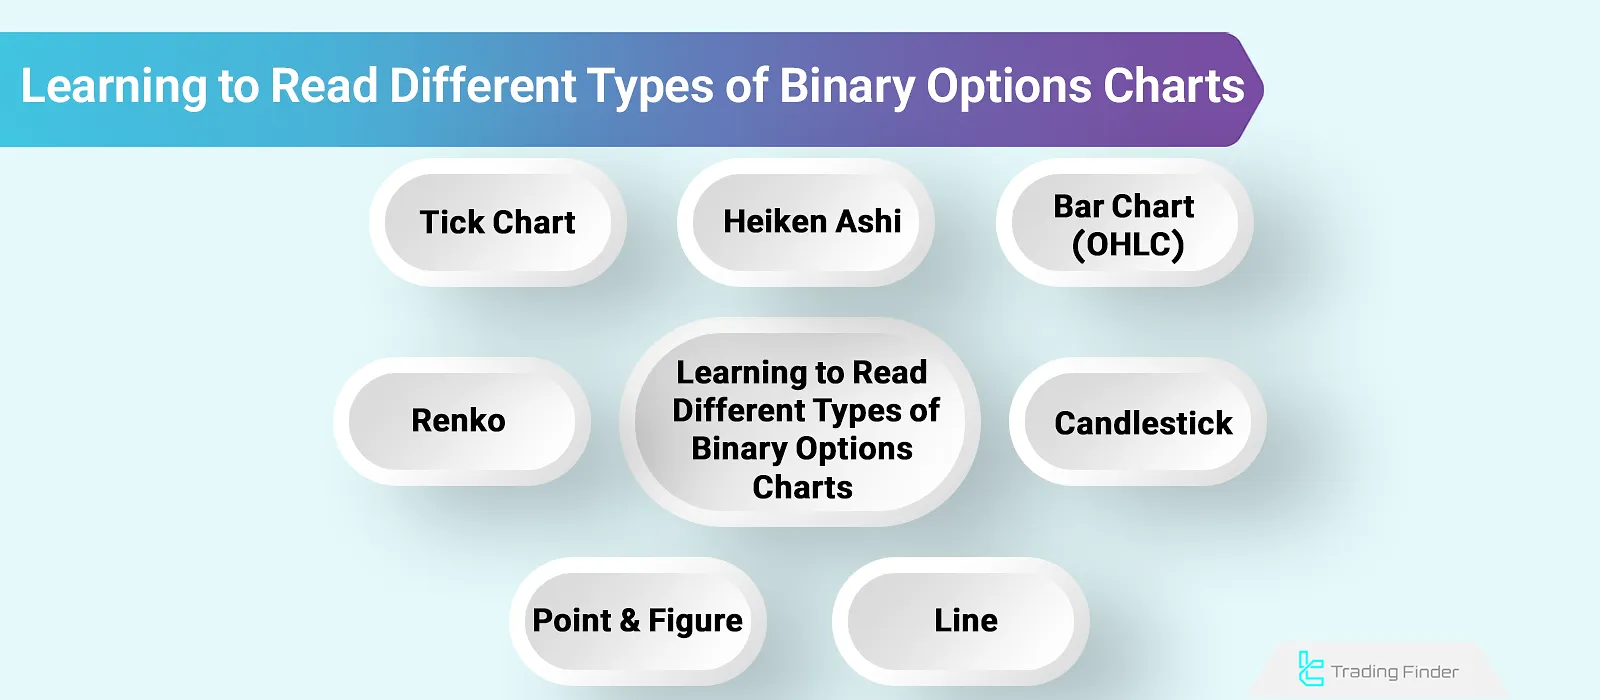
Learning how to read different Types of Binary Options Charts (Line, Bar, Heiken Ashi, Tick, and Renko)
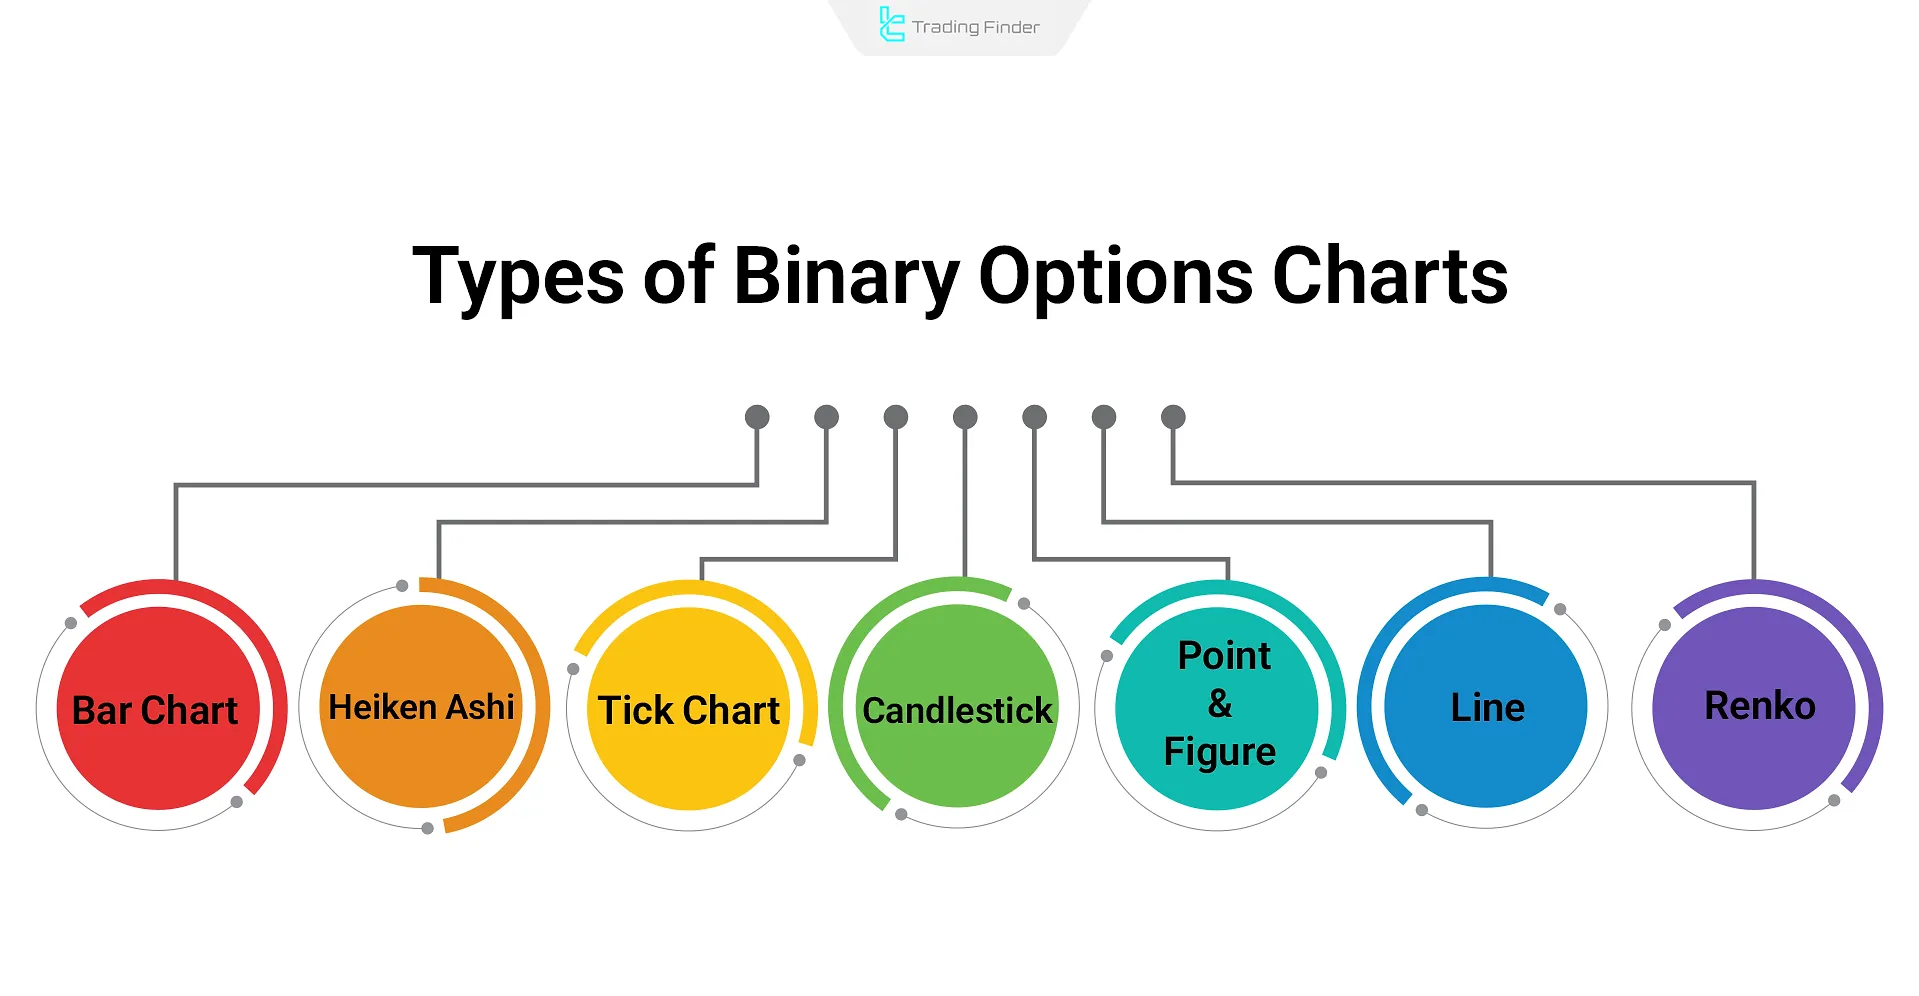
Types of Binary Options Charts
In binary options, the type of price chart plays a key role in technical analysis. Charts such as candlestick, Heiken Ashi, and Renko each provide a different aspect of price action and market trend.
Types of Binary Options Charts:
OHLC / Bar Chart
Candlestick Charts
Line Charts
Heiken Ashi
Renko Chart
Point & Figure
Tick Chart
Different types of Binary Options Charts providing various aspects of price action and market trend
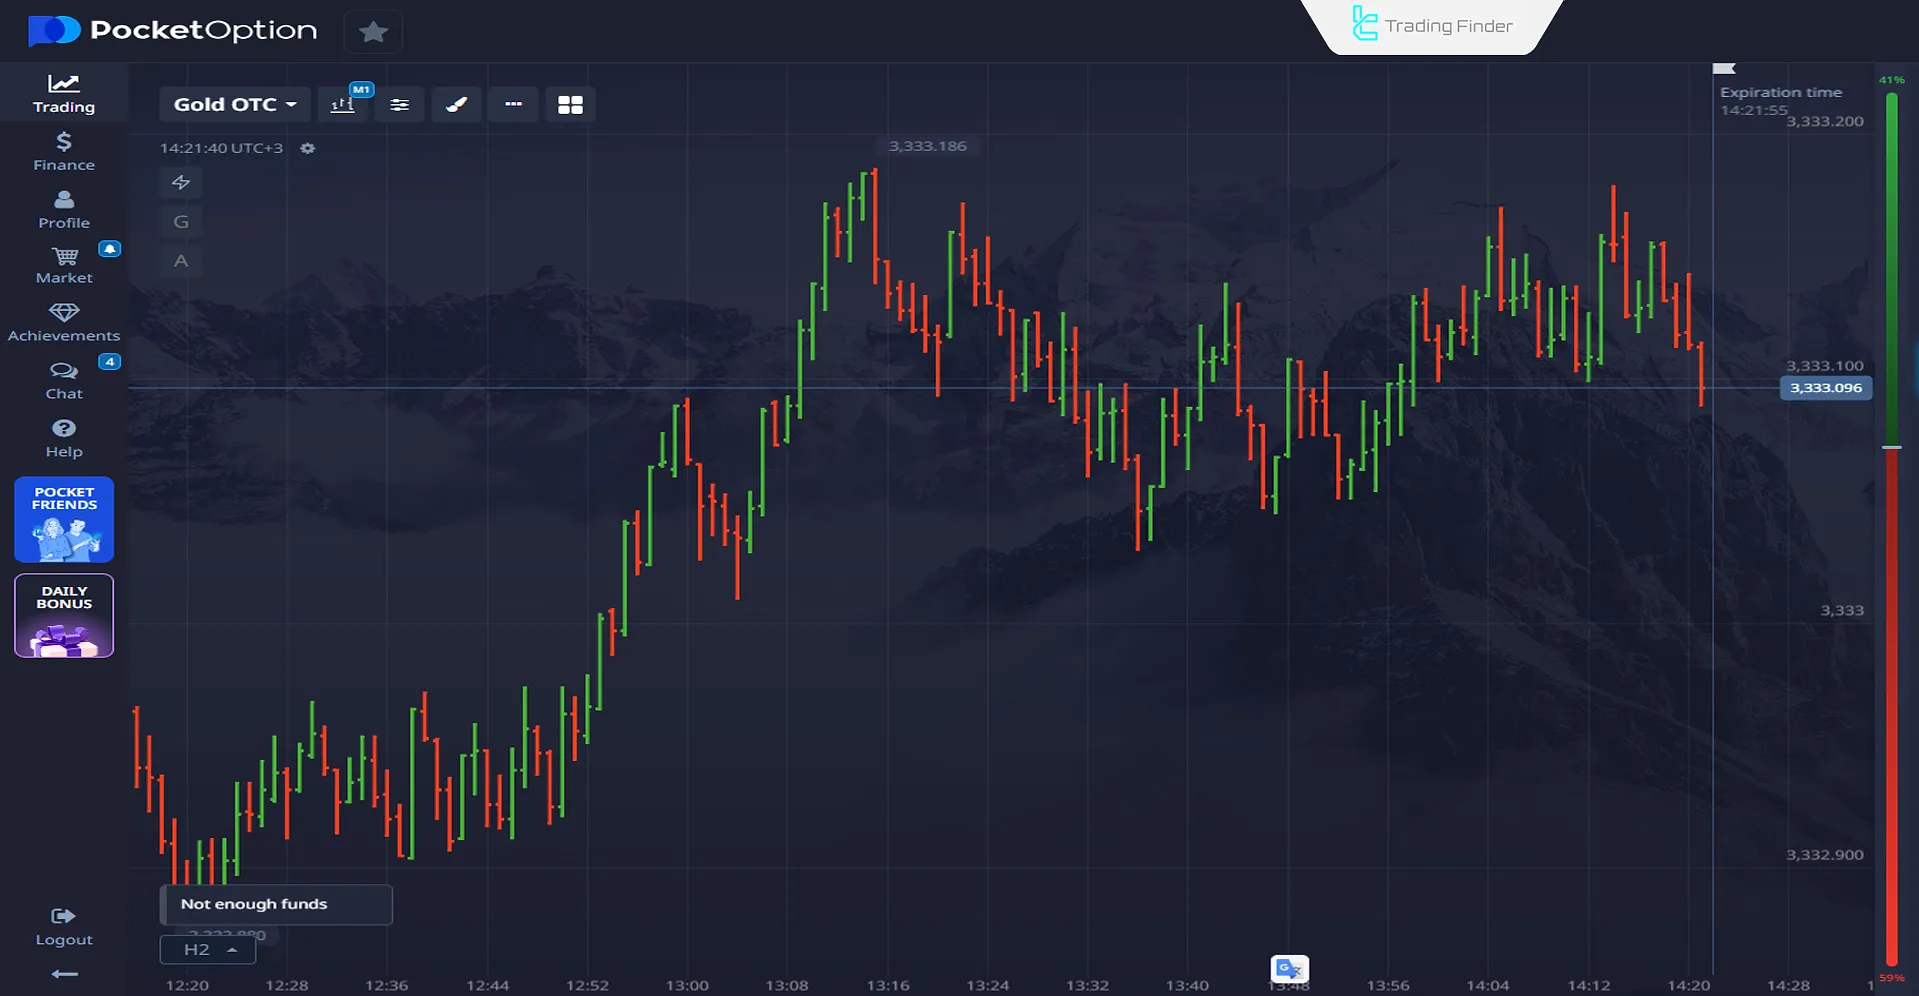
Bar Chart (OHLC / Bar Chart)
In this type of chart, each bar shows four key data points (Open, High, Low, Close).
The vertical line represents the price range, while the small horizontal lines on the left and right show the opening and closing prices.
Bar chart view in binary options with the display of price range and open/close levels; Source: pocketoption.com
Components of a Bar Chart:
Vertical line: represents the range between the highest and lowest price in that time frame;
Small horizontal line on the left: shows the opening price at the start of the time frame;
Small horizontal line on the right: shows the closing price at the end of the time frame.
Application of Bar Charts in Binary Options Trading
Bar charts serve as a filter to avoid weak and false breakouts. Various applications of bar charts in binary options trading include:
Using them to closely examine real-time price behavior, especially when setting short expiry times (60 seconds to 2 minutes);
Identifying breakouts in resistance or support zones through the bar’s closing position relative to its high and low;
Combining them with complementary indicators (such as EMA 50 or EMA 200) to confirm trend strength before entry.
Advantages and Disadvantages of Using Bar Chart in Binary Options
Advantages
Disadvantages
Accurate display of four main market data points
More complex for beginners
Ability to identify breakouts and supply/demand zones
Less focus on market sentiment compared to candlesticks
Useful for analyzing market structure
Less commonly used in binary platforms
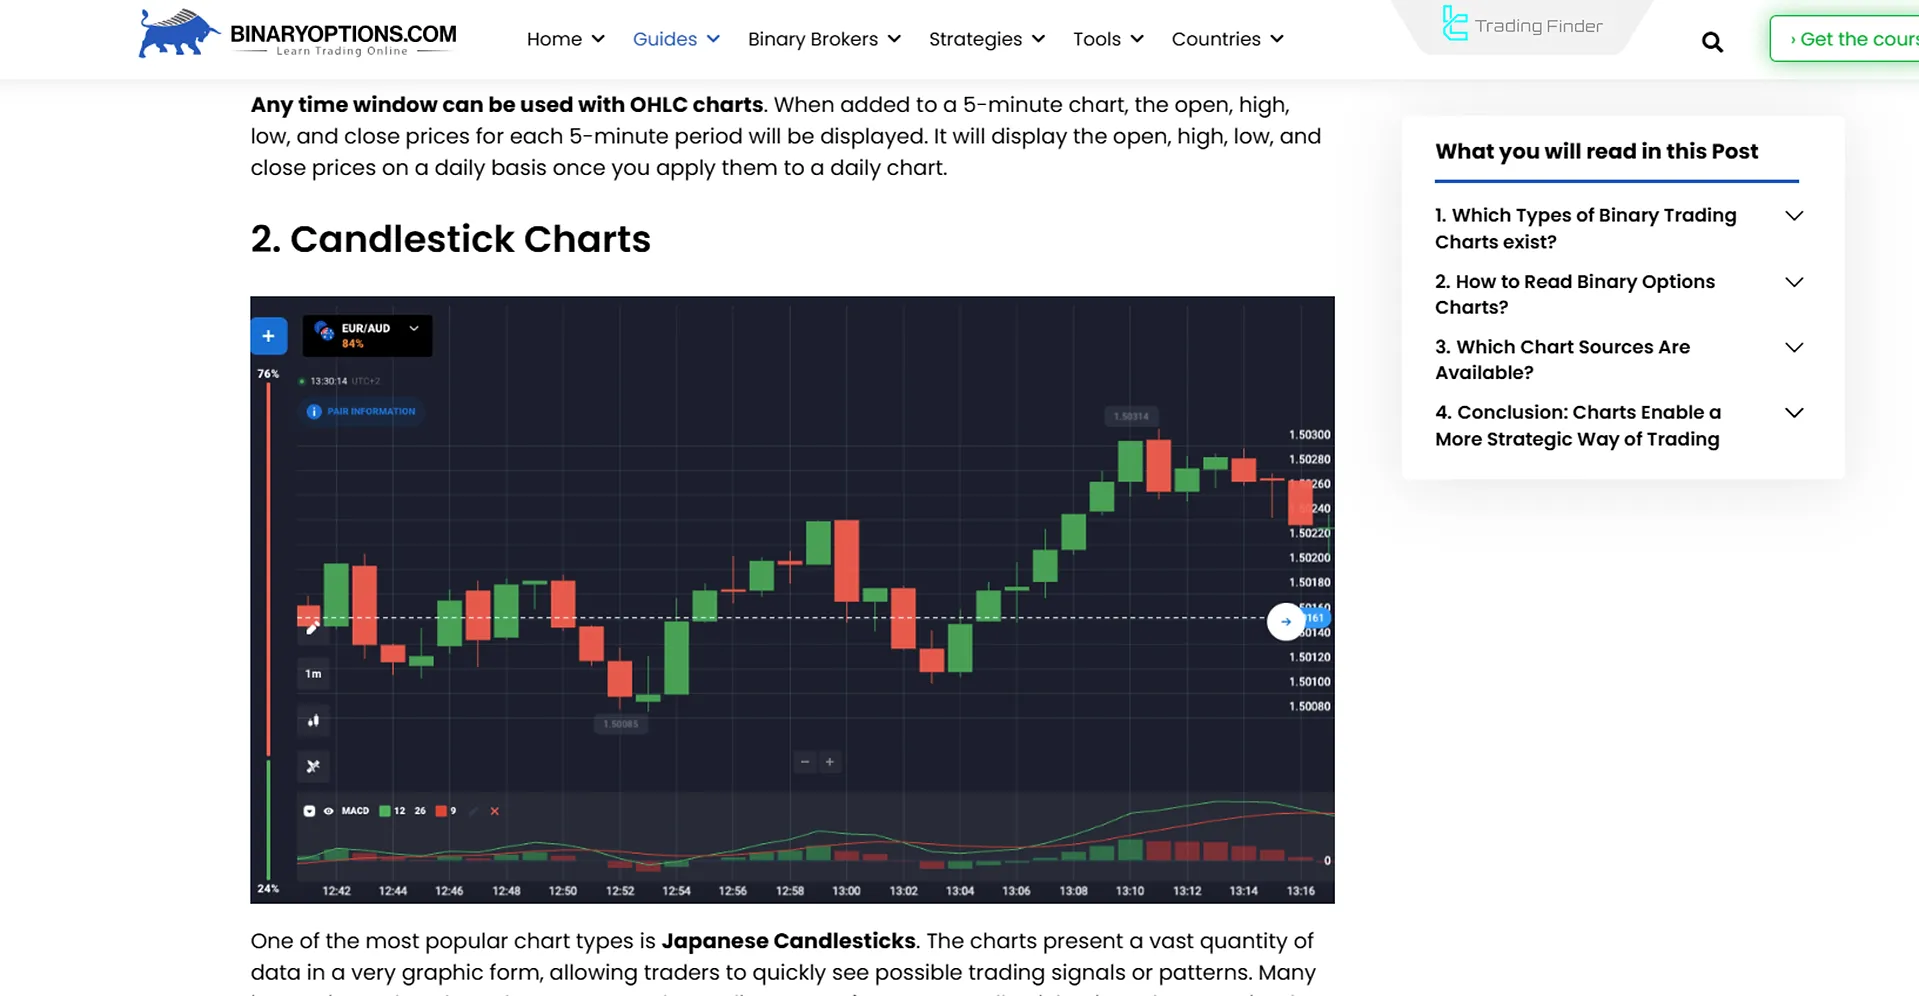
Candlestick Charts
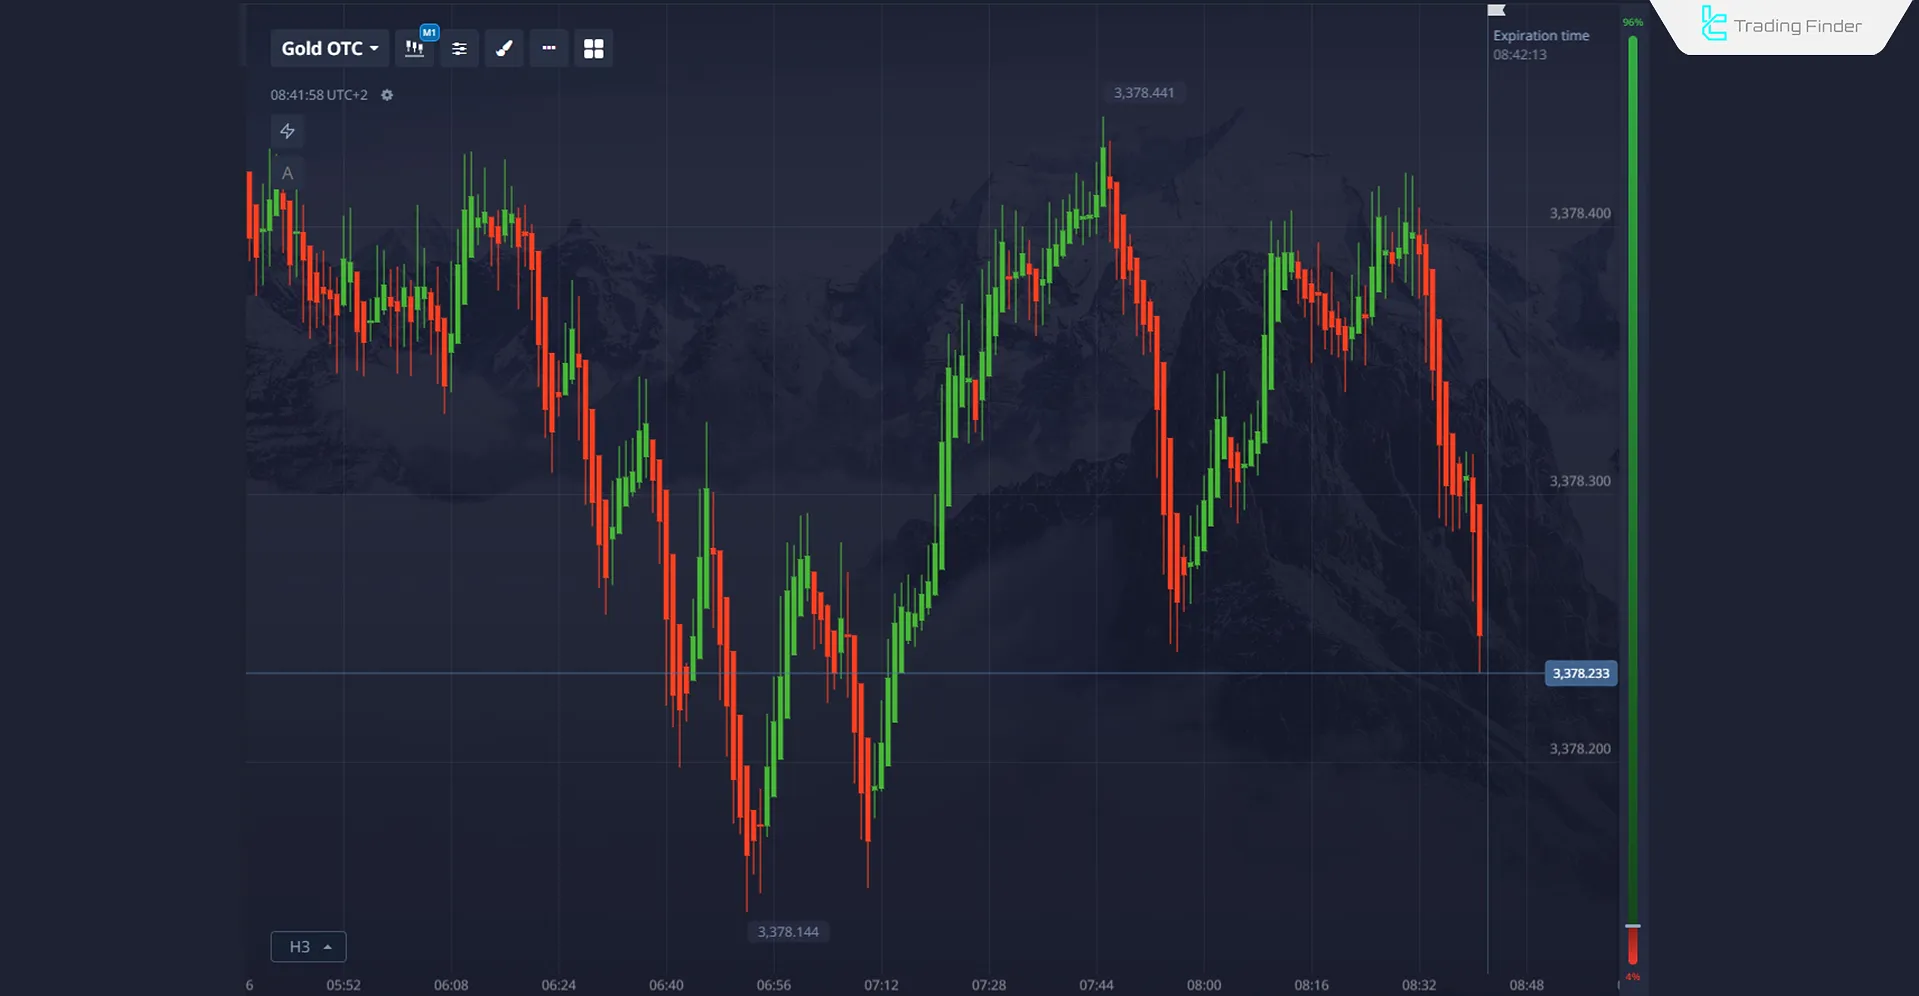
The most popular and widely used chart type is candlesticks. Each candlestick consists of a body (distance between Open and Close) and shadows.
The color of the body indicates price direction. This chart reflects market psychology and is suitable for price action.
Candlestick chart with the ability to reflect market psychology, suitable for price action analysis; Source: Binaryoptions.com
The suggested setup for using this type of binary options chart is the reversal zones strategy.
On candlestick charts, traders can use shortcuts and mouse scrolls for chart settings and zoom adjustments, which helps in binary options chart reading.
Professional Application of Candlestick Charts in Binary Options Trading
The foundation of most price action strategies is the use of candlestick charts. Professional applications of candlestick charts for binary options trading include:
Identifying candlestick patterns on the M1 and M5 timeframes for precise entries in turbo trades;
Applying reversal strategies with patterns such as Pin Bar, Engulfing, and Doji in key areas;
Confirming signals with RSI or Stochastic indicators on the same low-timeframe candle.
Advantages and Disadvantages of Using Candlestick Charts in Binary Options
Advantages
Disadvantages
High readability and clear display of market sentiment
Creates noise in small timeframes
Ability to identify candlestick patterns
Requires experience for accurate interpretation
Ideal for combining with price action strategies
Highly sensitive to chosen timeframe
Line Charts
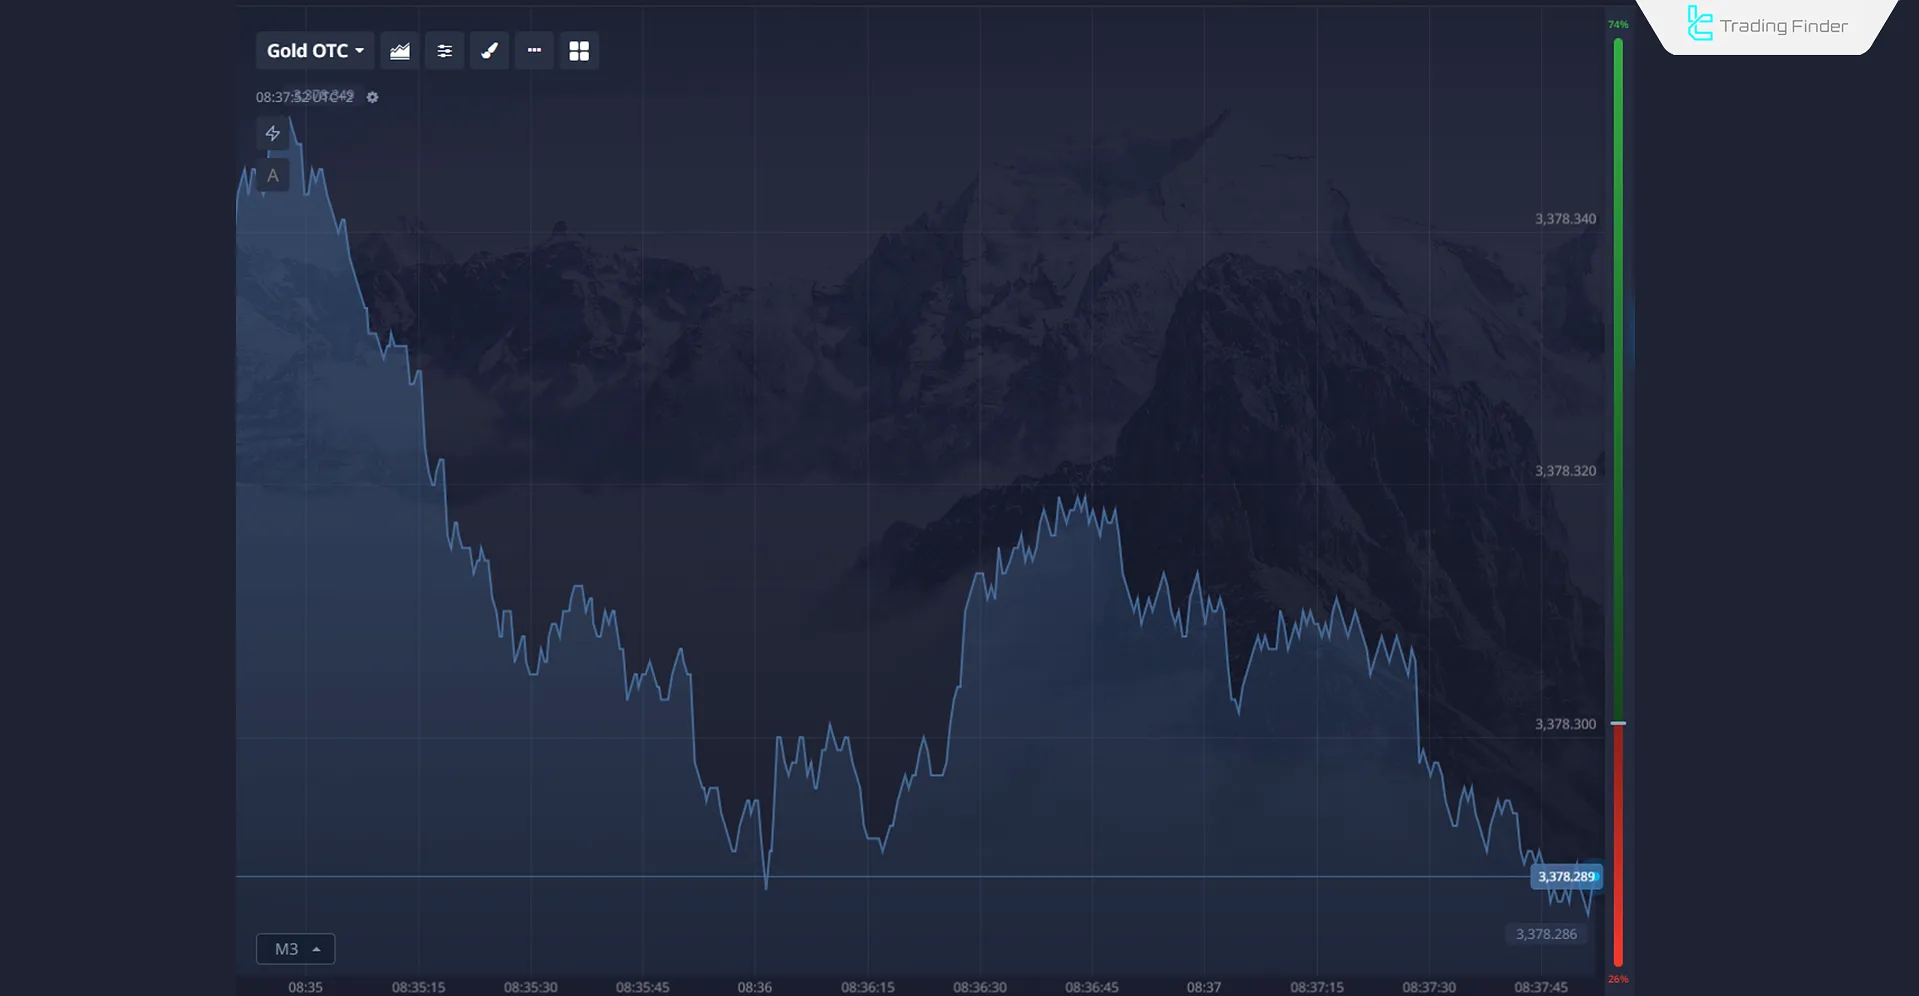
Line charts simply connect the closing prices of each timeframe with a continuous line. This structure makes the overall trend visible without distractions from minor fluctuations.
Line chart in binary options showing overall market trend without small fluctuation noise
Application of Line Charts in Binary Options Trading
Using line charts provides an overall view of the trend. Other applications of line charts in binary options trading include:
The fastest option for checking the general direction on higher timeframes such as M15 or M30 before entering 1 to 5-minute trades;
Suitable for analyzing trend changes after economic news without being distracted by candlestick shadows;
Identifying trend continuation zones in a simple way to enter Call or Put trades in the dominant direction.
Advantages and Disadvantages of Using Line Charts in Binary Options
Advantages
Disadvantages
Simplicity and speed in analysis
Does not show Open, High, and Low prices
Removes minor noise
Not suitable for precise price action
Ideal for checking overall trend direction
Limited for identifying precise entry/exit points
Heiken Ashi
Heiken Ashi is a type of candlestick chart. The candles are built based on averaging price data to display a smoother trend without noise, making trend recognition easier.
The suggested setup for trading with a Heikin Ashi chart is the use of exponential moving average crossovers combined with structure breakouts in trending markets.
This method is often highlighted in heikin ashi trading strategy tutorials.
Heiken Ashi chart based on averaging price data, showing noise-free trends
Application of Heikin Ashi Charts in Binary Options Trading
Heikin Ashi charts focus on strong market trends and filter out market noise. Various applications of Heikin Ashi charts in binary options trading include:
Using them in Trend Following strategies to enter trades in the direction of the ongoing trend;
Preventing false entries during short corrective phases;
Suitable for trades with longer expiry times (10 minutes to 1 hour);
Combining them with Bollinger Bands or EMA to confirm trend continuation.
Advantages and Disadvantages of Using Heiken Ashi in Binary Options
Advantages
Disadvantages
Removes noise and shows stable trends
Lagging compared to real price
Useful for identifying long-term trends
Reduces accuracy in fast trades
Filters false signals
Needs to be combined with main chart for precise entry
Tick Chart
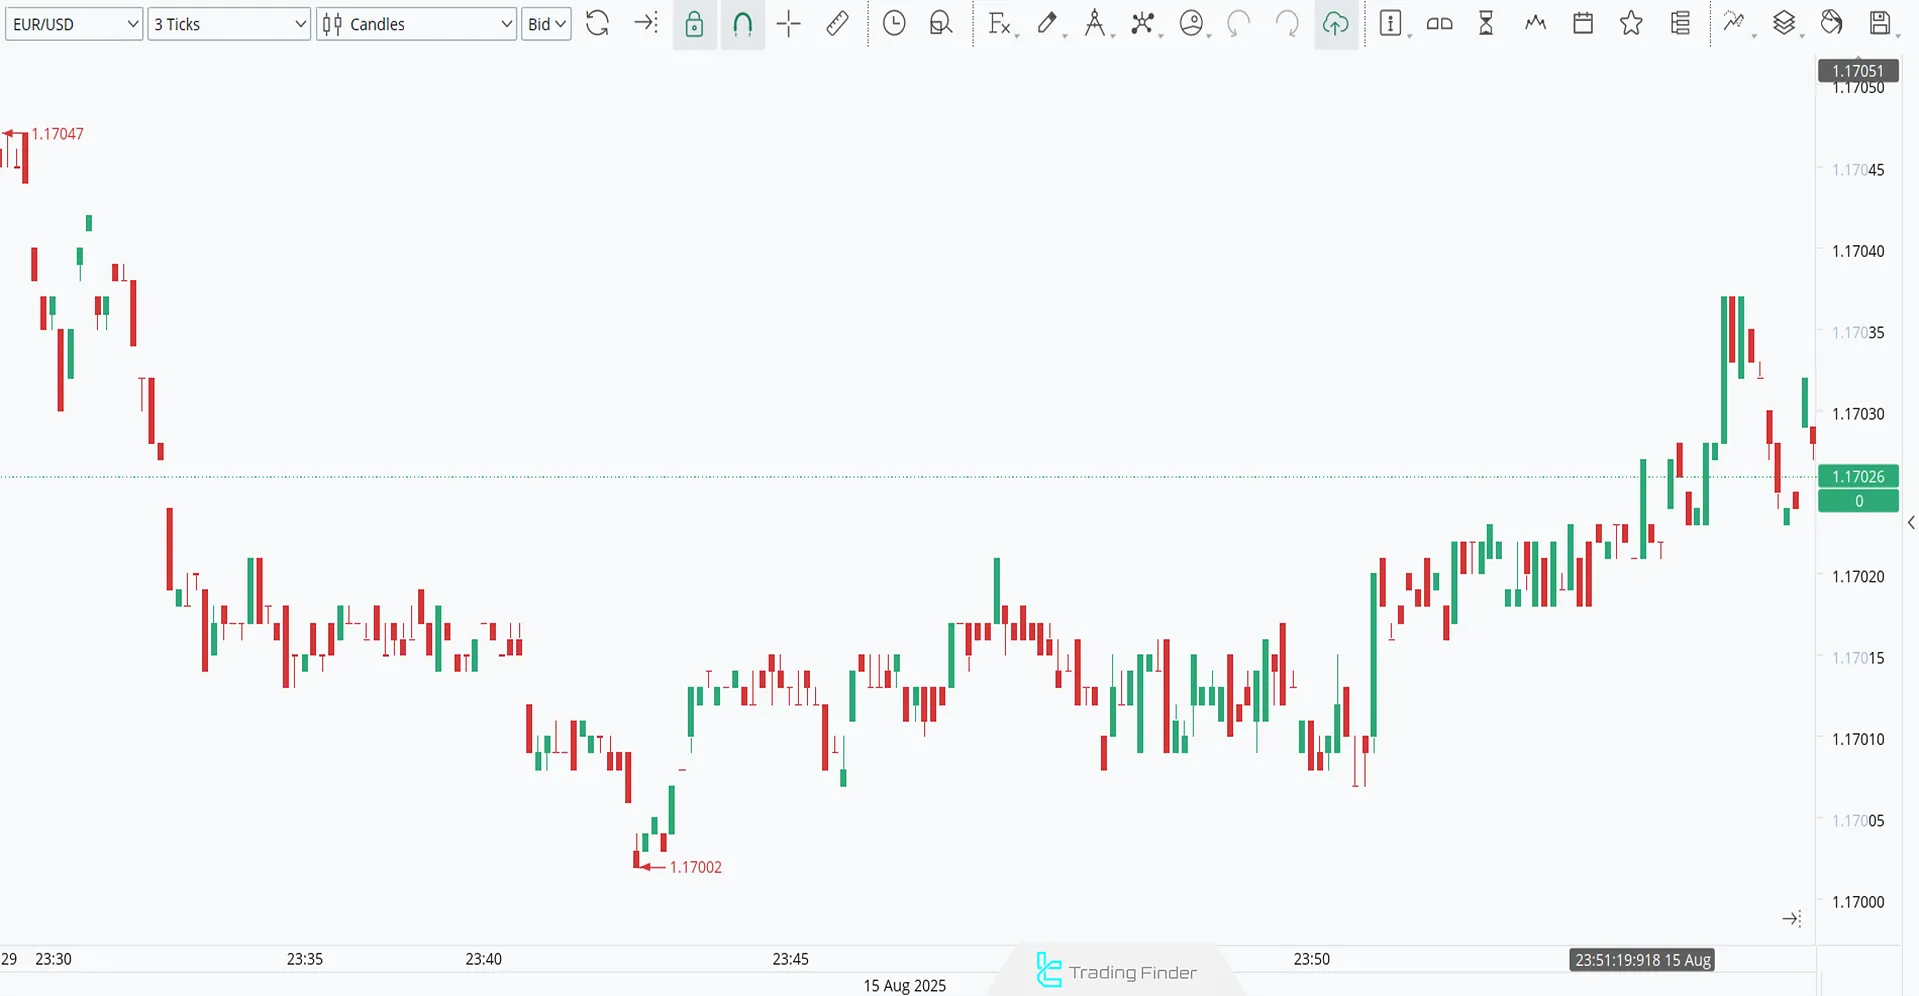
A Tick Chart is a type of chart built not based on time, but on the number of trades (ticks). Each tick or candle is formed after a set number of trades occur.
Due to its ability to provide a more detailed view of price movement, the tick chart is commonly used in turbo and ultra-fast trades where real-time monitoring is required.
The suggested setup for tick charts is the Turbo Trading strategy, applied mainly during the London or New York sessions, also known as binarie chart session.
Price plotted by number of trades (ticks) regardless of time in a Tick Chart
Application of Tick Charts in Binary Options Trading
Using tick charts provides a clear outlook on price changes before a one-minute timeframe candle is formed. Other professional applications of tick charts in binary options trading include:
Suitable for binary options scalping on high-volume currency pairs such as EUR/USD during the London or New York sessions;
Applying them in high-frequency trades with expiry times of less than 30 seconds;
Combining them with indicators such as Parabolic SAR for rapid entries.
Advantages and Disadvantages of Using Tick Charts in Binary Options
Advantages
Disadvantages
Shows precise real-time fluctuations
Requires fast and stable internet connection
Suitable for scalping in high-volume markets
Less suitable for low-volume markets
Clarifies real market moves
Difficult for managing expiry times in binary trading
Renko Chart
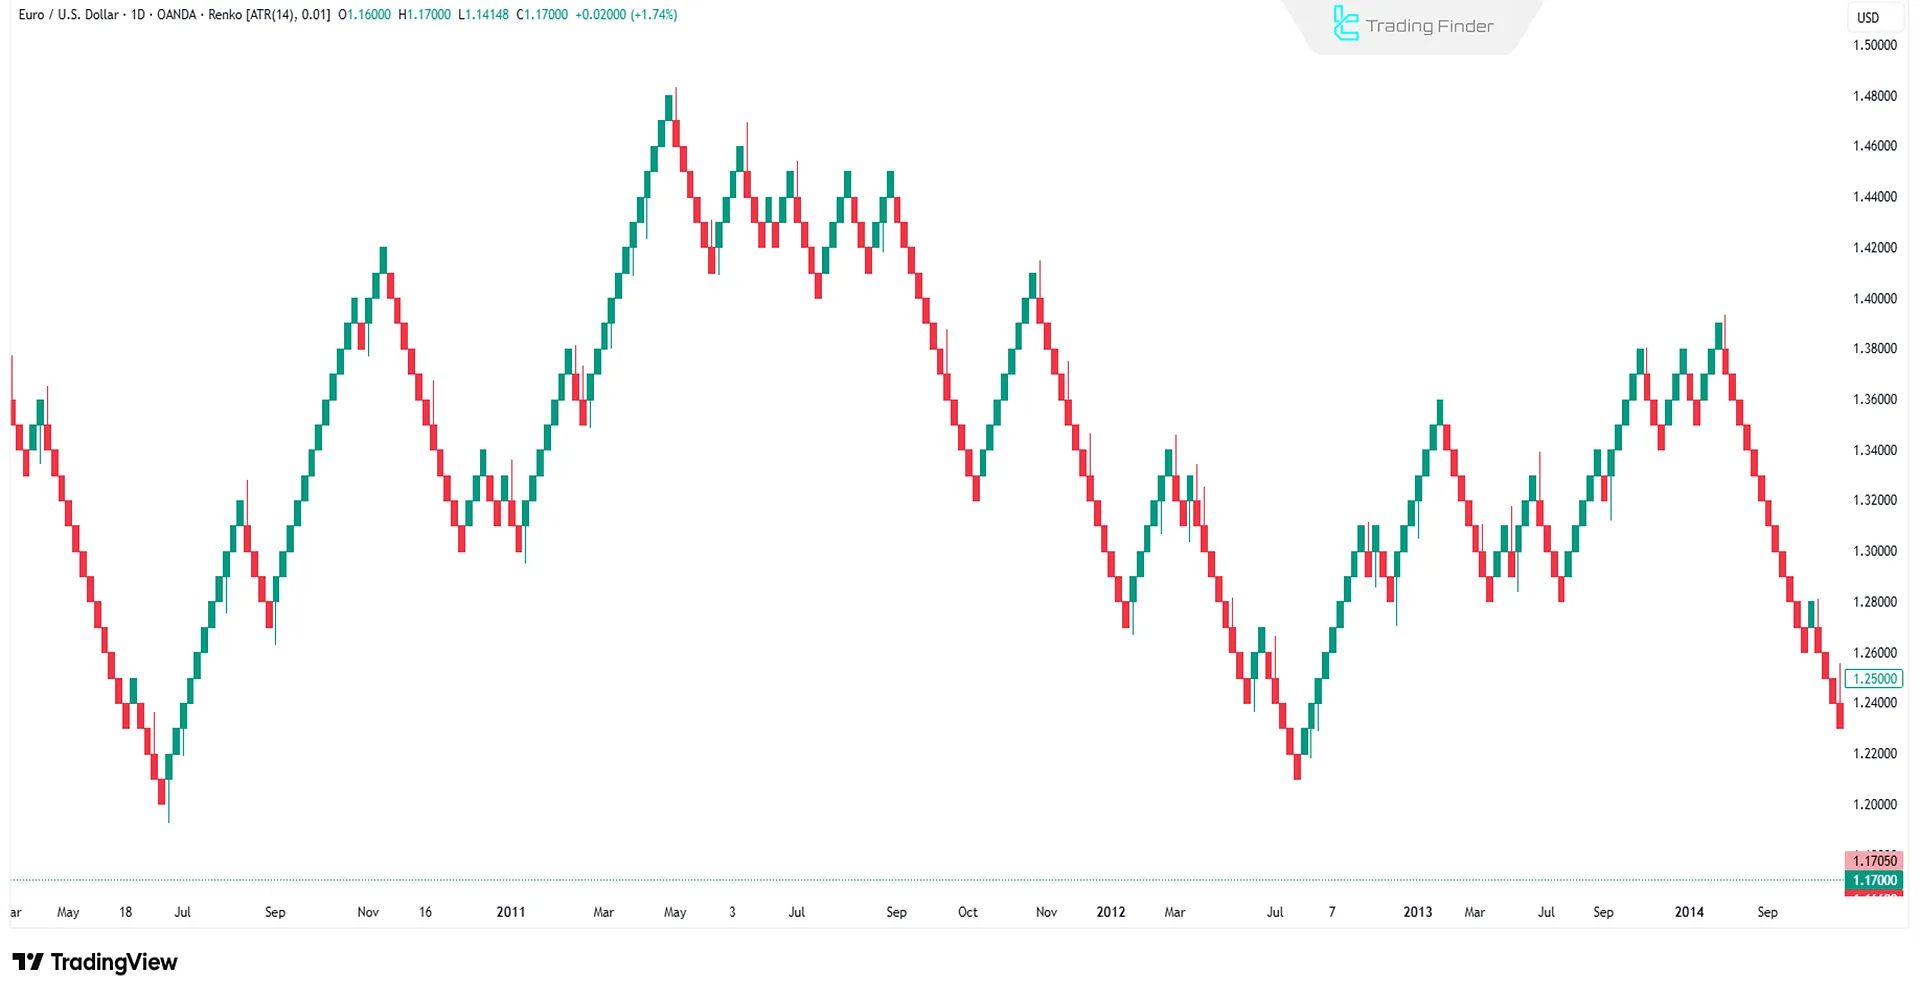
Renko Chart is a price chart built based on price movement rather than time. It only shows significant moves, filtering market noise and clarifying trends.
Renko chart displaying price movement with bricks regardless of time
Application of Renko Charts in Binary Options Trading
Renko charts focus on price movements within stable trends regardless of time. Other applications of Renko charts in binary options trading include:
Filtering minor moves and focusing on larger price changes;
Combining with the ATR indicator to set Renko brick size based on market volatility;
Identifying major reversal points without timeframe noise.
Advantages and Disadvantages of Using Renko Charts in Binary Options
Advantages
Disadvantages
Filters small moves, focusing on trend
Lag in showing sudden reversals
Clearer trend identification
Does not display exact timing of moves
Suitable for continuation trades
Less suitable for scalping signals
Renko Chart Indicator
The Renko indicator is a tool for trend analysis in financial markets, available for free on the MetaTrader platform.
This indicator eliminates price noise and focuses on the core market movements, enabling traders to detect trends and key levels with greater clarity.
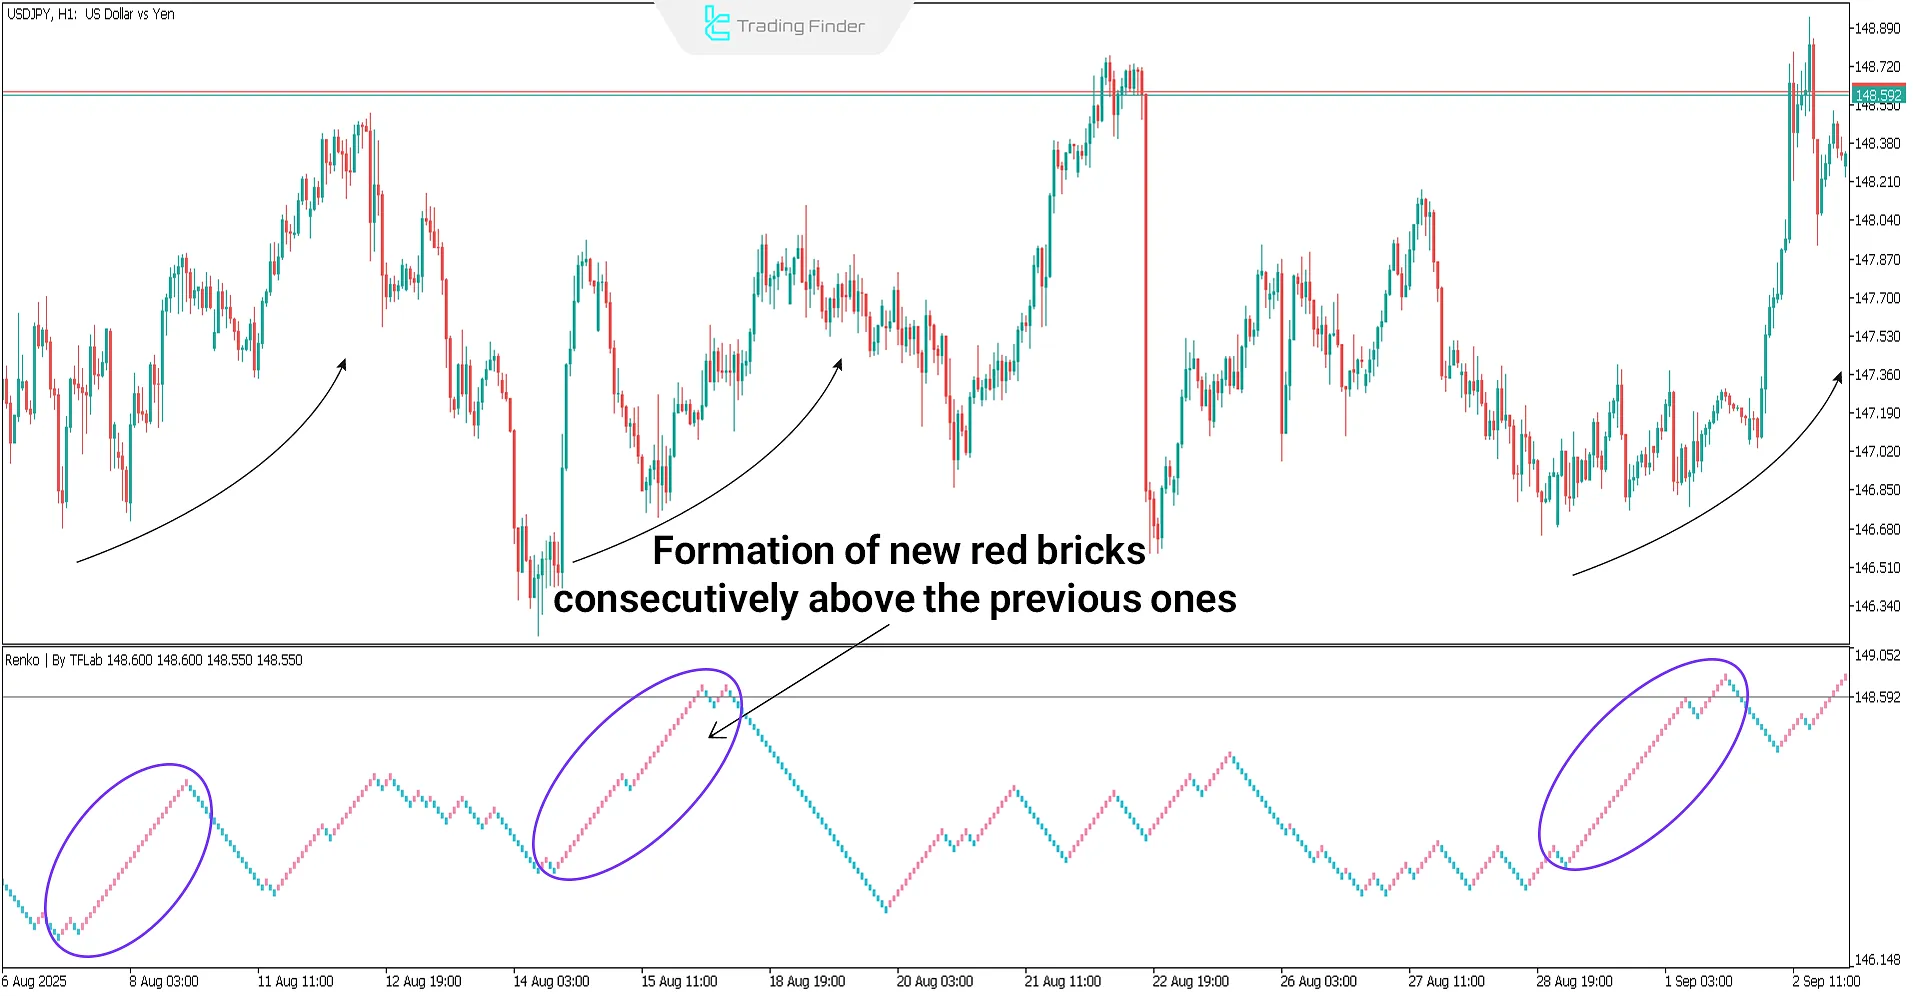
In this tool, red bricks indicate buying pressure, while blue bricks reflect selling pressure.
For comprehensive guidance and a better understanding of how to use the Renko indicator in binary trading, traders can refer to the educational video on the TradingFinder channel:
The Renko bricks indicator on MetaTrader is highly practical for detecting trends and reversal points.
By removing the time factor and focusing solely on actual price changes, this chart provides a simplified and clearer market perspective.
Traders can apply it across Forex, cryptocurrency, stocks, and commodities.
Combining this indicator with other analytical tools such as RSI or MACD increases the strength of analysis and creates more reliable entry and exit opportunities, which is essential for reading binary options charts for accurate entry.
Unlike conventional binary options charts based on time, the Renko chart builds its bricks solely on price movement.
This unique feature allows the main trends and support/resistance levels to be identified with much greater clarity.
Combining the Renko chart with price charts provides a broader analytical perspective for binary options education and helps filter out irrelevant noise.
On the 1-hour EUR/USD chart, when new bricks consistently form above previous ones, it signals buyer strength and a sustainable bullish trend.
Renko indicator showing an uptrend pattern on the USD/JPY H1 chart
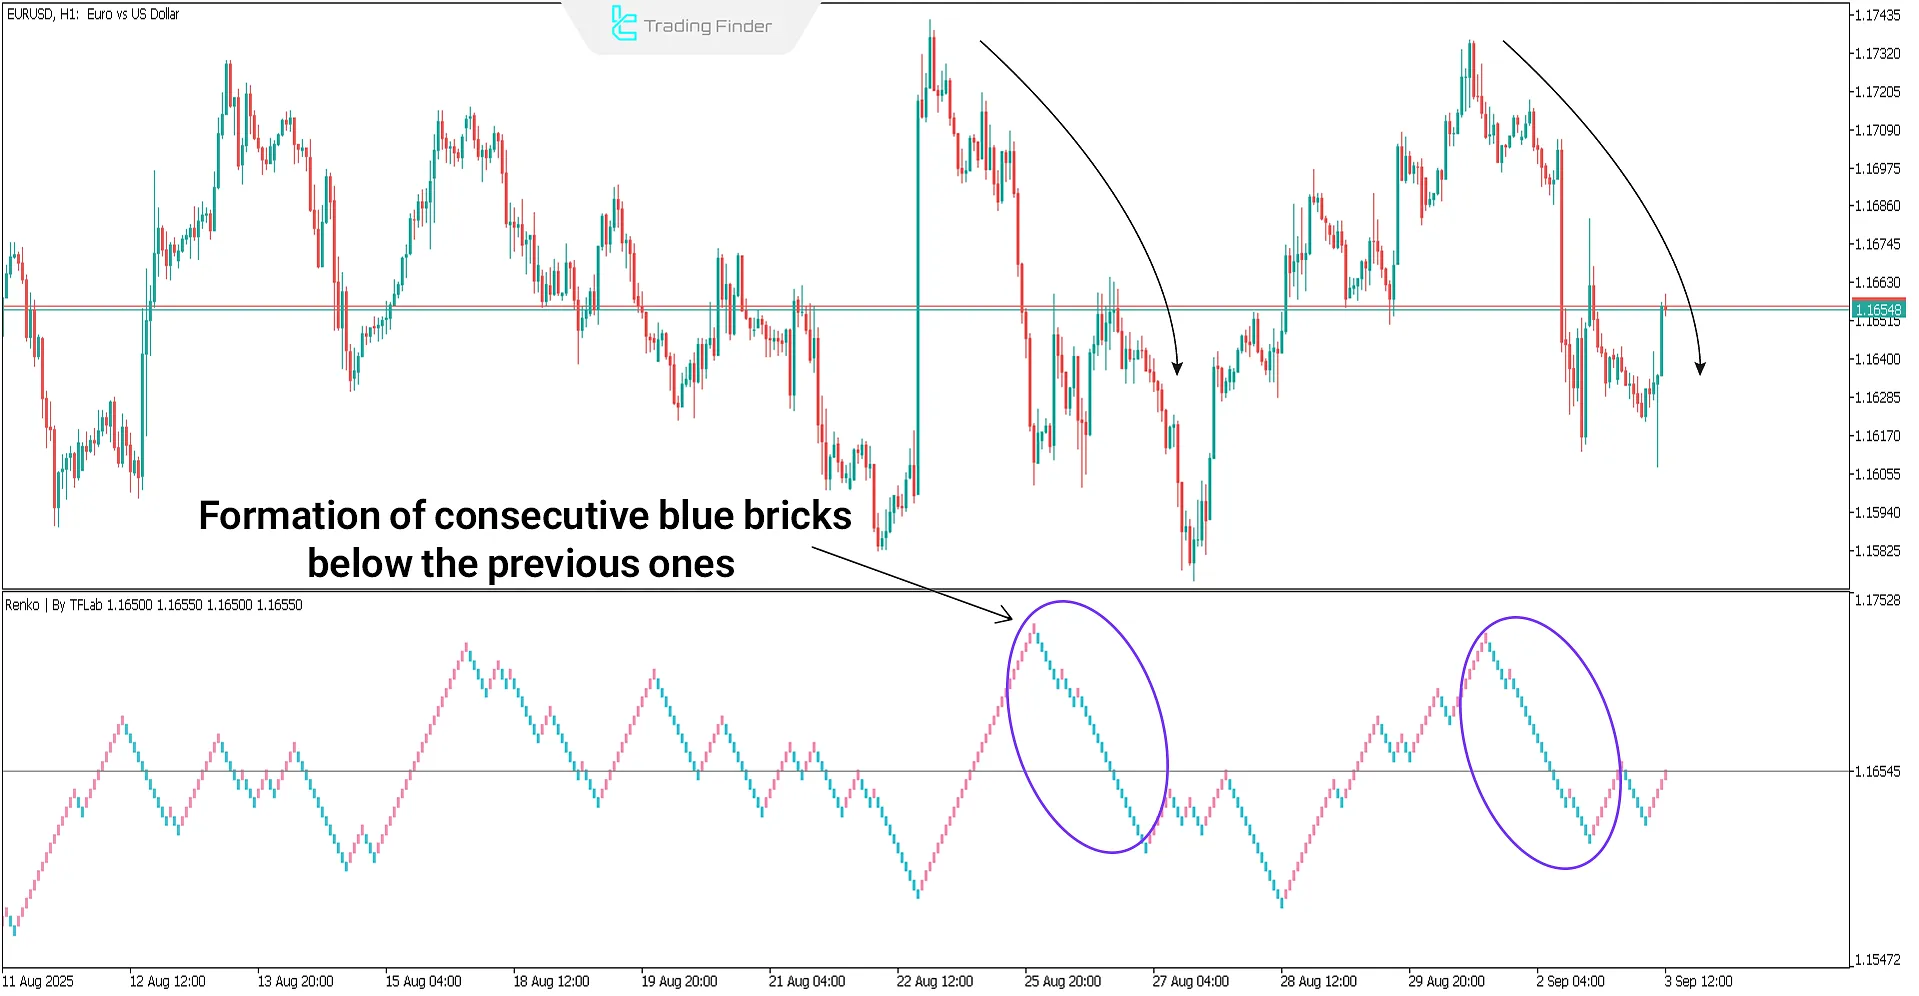
On the 1-hour EUR/USD chart, when blue bricks consistently form below the previous ones, it signals strong selling pressure and a clear bearish trend.
Downtrend pattern displayed with the Renko chart indicator on the EUR/USD symbol
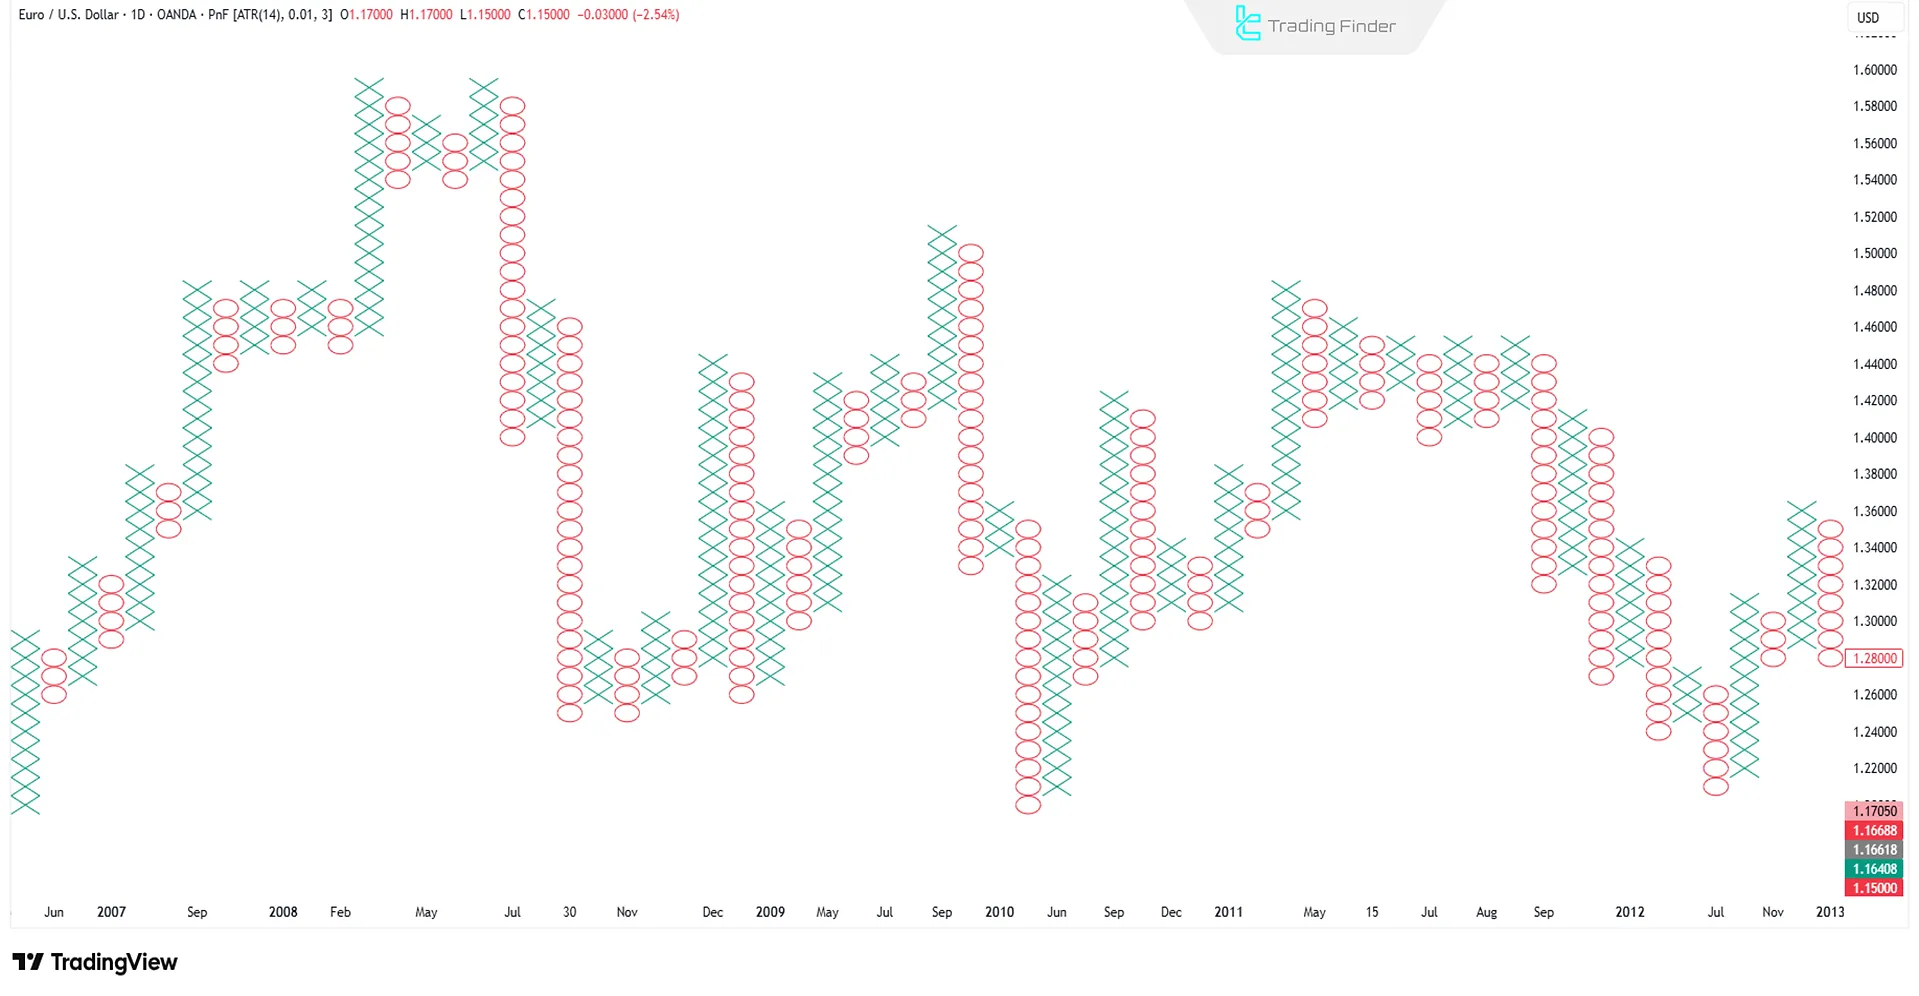
Point & Figure
Point & Figure is a charting method in technical analysis that shows price fluctuations independent of time.
In this chart, only price changes matter, with X representing increases and O representing decreases.
These charts help identify trends, support and resistance levels, and entry/exit points.
Advantages and Disadvantages of Using Point & Figure in Binary Options
Advantages
Disadvantages
Removes time noise, focusing only on price direction
Complex for beginners
Effective for identifying key levels
Less common in binary platforms
Detects real breakouts
Requires precise unit size adjustments
Applications in binary options trading:
Identifying strong support and resistance before longer trades;
Detecting false breakouts in candlestick or bar charts and recognizing valid ones;
Useful for traders focusing on Price Structure rather than timeframes;
Combined with volume indicators for breakout confirmation.
Point & Figure chart displaying only price changes without time factor
Comparison Table of Binary Options Chart Types
The following table compares different types of binary options charts in terms of definition, advantages, disadvantages, and practical applications:
Chart Type
Definition
Advantages
Disadvantages
Application
Bar (OHLC / Bar)
Displays open, close, high, and low prices
High accuracy, complete details, suitable for technical analysis
Complexity for beginners
Determining precise entry and exit points (binary options entry and exit)
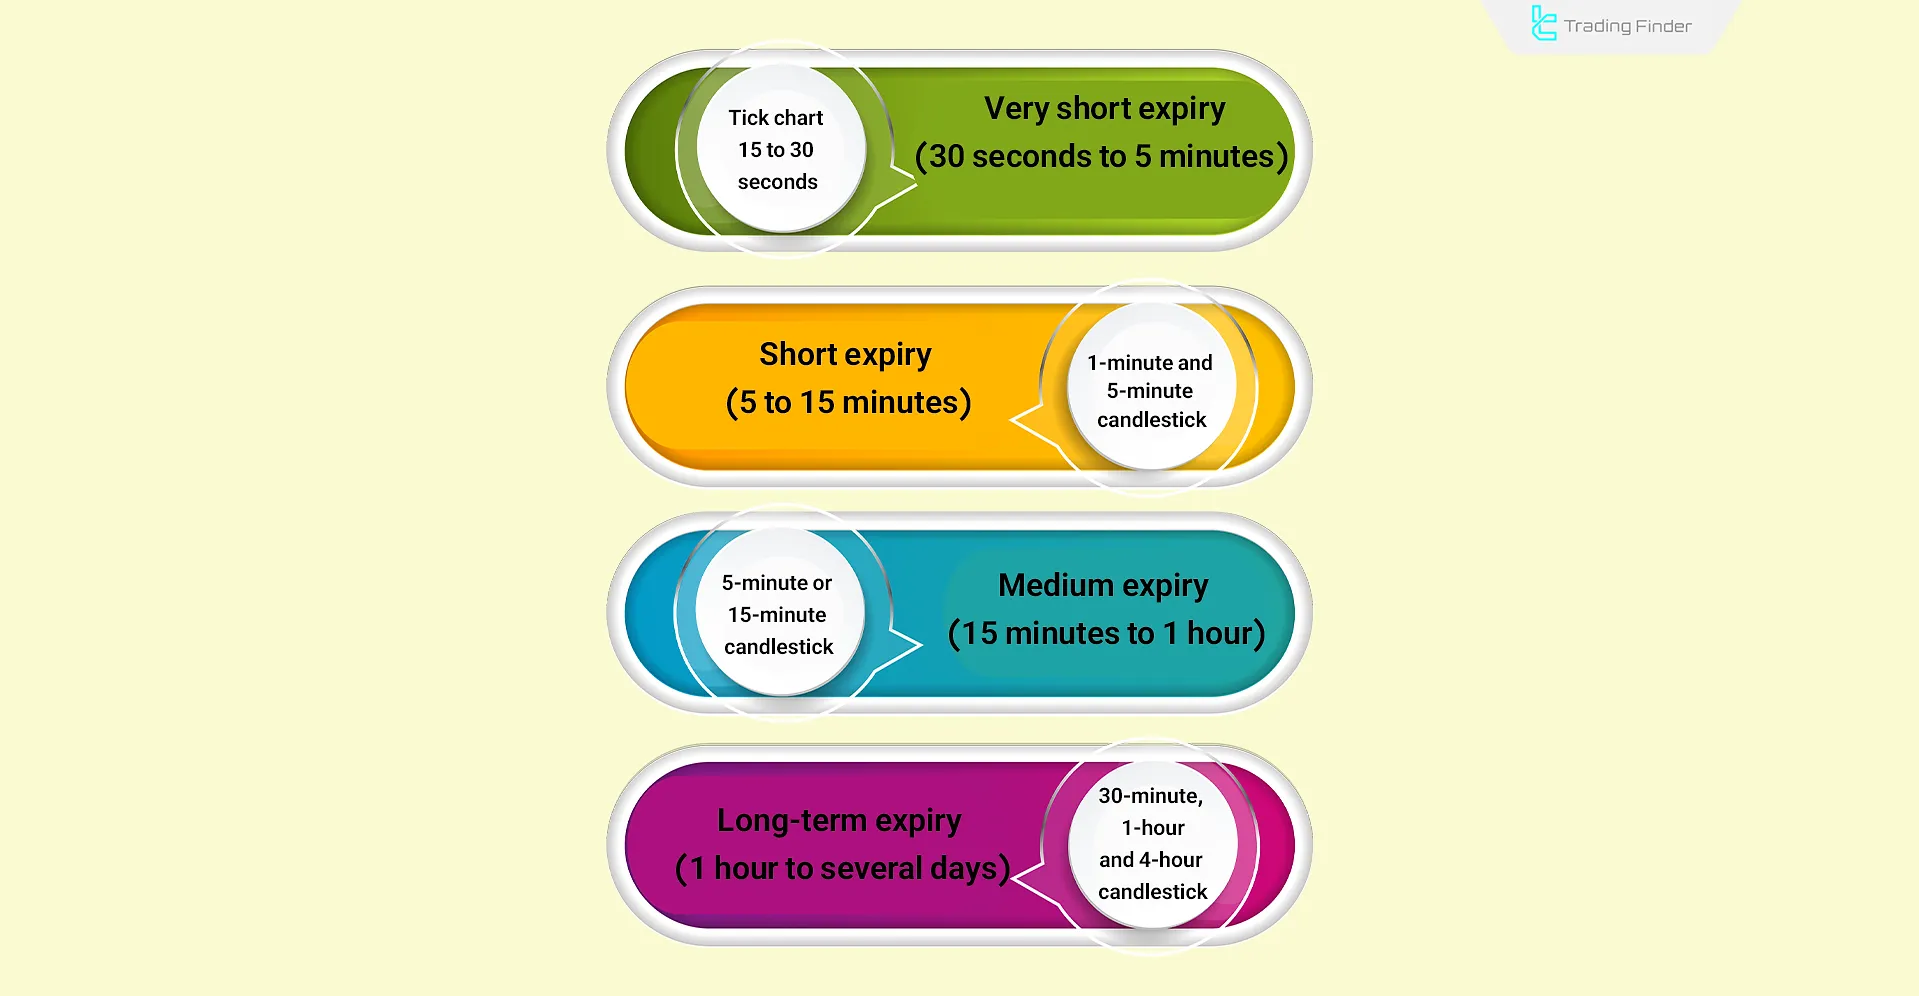
Chart selection according to expiry horizon depends on the trader’s time frame. The shorter the timeframe, the greater the need for details and accuracy.
For longer-term horizons, simpler charts are sufficient.
Very short expiry (30 seconds to 5 minutes): The best choice is the tick chart or candlestick with 15–30 seconds, since it shows micro-movements quickly (candlestick timing binary options);
Short expiry (5 to 15 minutes): Best option is 1-minute or 5-minute candlestick charts, since price action and candlestick patterns are very effective here (how to read binary options charts);
Medium expiry (15 minutes to 1 hour): 5 or 15-minute candlestick combined with a line chart to confirm overall direction, giving both short-term and mid-term structure;
Long expiry (1 hour to several days): Best option is 30-minute, 1-hour, or 4-hour candlestick charts, where major trends and support/resistance are more reliable (binary options entry and exit).
Types of binary charts suitable for different expiry horizons in binary options trading
Choosing Charts by Trading Strategy
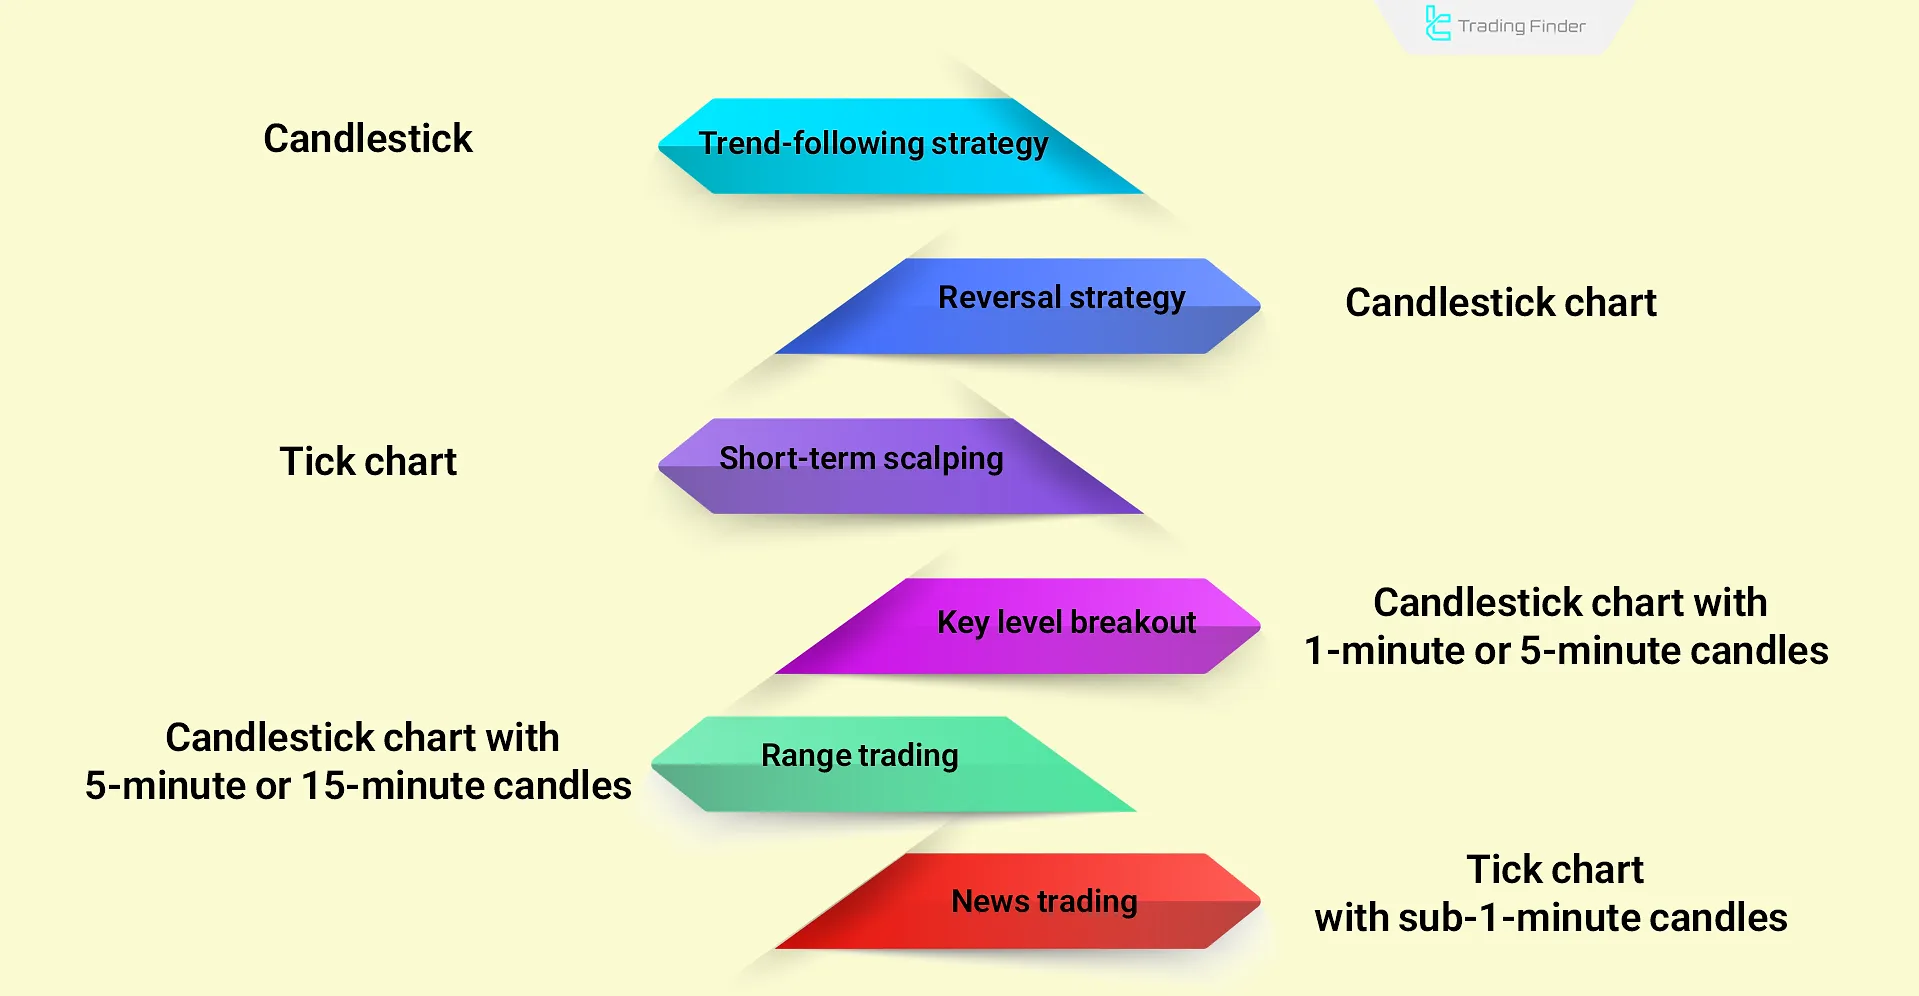
Each chart type has unique features suitable for different trading styles. Below are recommendations according to strategy:
Trend-Following Strategy: Candlestick chart, as it reduces market noise and makes trends clearer (binary trend finder);
Reversal Strategy: Candlestick chart, because it highlights price reversals effectively;
Short-term Scalping: Tick chart, as it reflects fast fluctuations more accurately (seconds chart mt5);
Breakout Strategy: 1-minute or 5-minute candlestick chart, since breakouts usually occur with volume surges;
Range Trading: 5 or 15-minute candlestick charts, combined with Bollinger Bands, to identify overbought/oversold zones for entry and exit;
News Trading: Tick chart with candles below 1 minute, since news causes sudden moves that require instant monitoring (binary options chart reading).
Choosing chart types based on trading strategies for binary options
How to Read Binary Options Charts?
Chart reading in binary options is the foundation of a trader’s decision-making. Success is achieved when price is analyzed within the framework of trend, level, and timing.
For a better understanding of how to read binary options charts, you can also watch the MARK TRADER educational video on YouTube:
To use charts more effectively in binary options, follow these steps:
#1 Identify Market Structure
Market direction is determined by analyzing highs, lows, and key zones. Higher highs indicate an uptrend, lower highs a downtrend, and flat ranges signal consolidation.
Trading decisions must align with this structure.
#2 Recognize Key Levels
Support and resistance zones, supply and demand areas, and daily highs/lows are vital points for price reactions.
Entries at these points optimize risk-to-reward and avoid emotional trades in the middle of price ranges.
#3 Select Chart Type Matching Your Strategy
To execute a trading strategy correctly, the right chart type must be chosen:
Candlestick charts are suitable for price action analysis;
Heiken Ashi clarifies trends;
Renko removes noise;
Line charts are useful for drawing support/resistance quickly.
#4 Analyze Candles and Chart Components
In candlestick patterns, candle bodies show momentum while long wicks represent rejection of levels.
Patterns like Pin Bar or Engulfing are valid only in key zones. Candlestick reading defines the exact entry moment.
Expiry should be 1 to 2 times the signal timeframe. For M1, usually 60–120 seconds is suitable; For M5, 5–10 minutes is recommended. Correct expiry ensures the price move is fully completed.
Choosing the Right Expiry Time for Binary Options:
Practical Note
Expiry
Signal Timeframe
Do not enter during last 20 seconds of the candle
60–120 seconds
M1
Better for divergence setups
90–180 seconds
M2–M3
Only when M15 aligns
5–10 minutes
M5
ATR-Based Expiry Rule in Binary Options
The ATR (Average True Range) is a tool for measuring actual market volatility. In binary options, one of the biggest mistakes is choosing an expiry time inconsistent with volatility.
The ATR rule provides a numeric method to synchronize expiry time with real market conditions.
The advantage of this method is avoiding trading noise in very short expiries and reducing the risk of premature or delayed exits. To apply the ATR rule, consider the following:
High ATR = high volatility → shorter expiry is more suitable
Low ATR = low volatility → longer expiry is more suitable
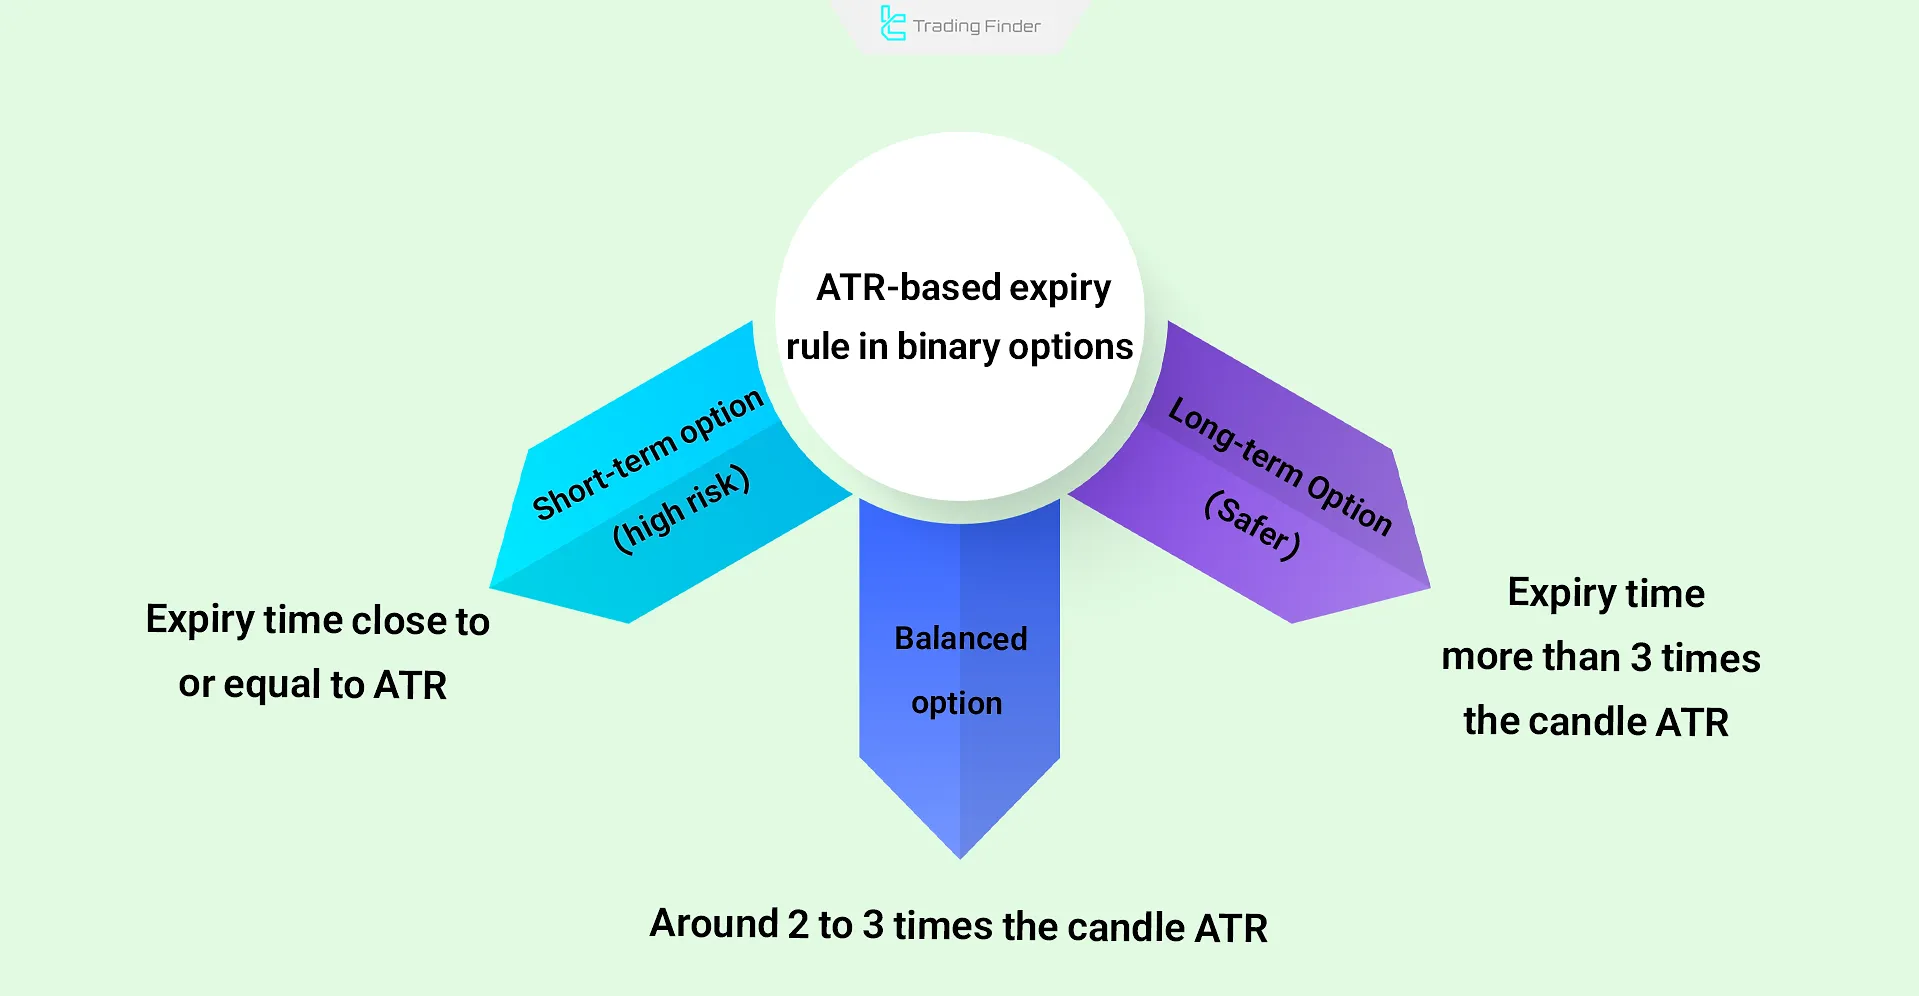
Example of ATR-Based Expiry Rule in Binary Options
The ATR indicator guides the trader to select expiry time that matches real market conditions and avoids early or late entries.
For instance, assume that on the 5-minute timeframe, the ATR value of the candle is 4 points. This means that on average, the market fluctuates 4 points every 5-minute candle.
Trader’s choices according to the ATR expiry rule in binary trading:
Short-term (High Risk): Choosing an expiry near 5 minutes (equal to the candle timeframe), mostly for scalping and fast movements;
Balanced Option: Expiry about 2–3 times the ATR of the candle, i.e., 10–15 minutes, which provides the best balance between price movement and reaching the target;
Long-term (Safer): Expiry longer than 15 minutes, giving the trader time to neutralize short-term fluctuations and confirm the main trend.
Example of ATR-based expiry rule in binary options for different trading strategies
This approach is an important part of binary options education and helps traders learn how to trade binary options by aligning expiry with volatility.
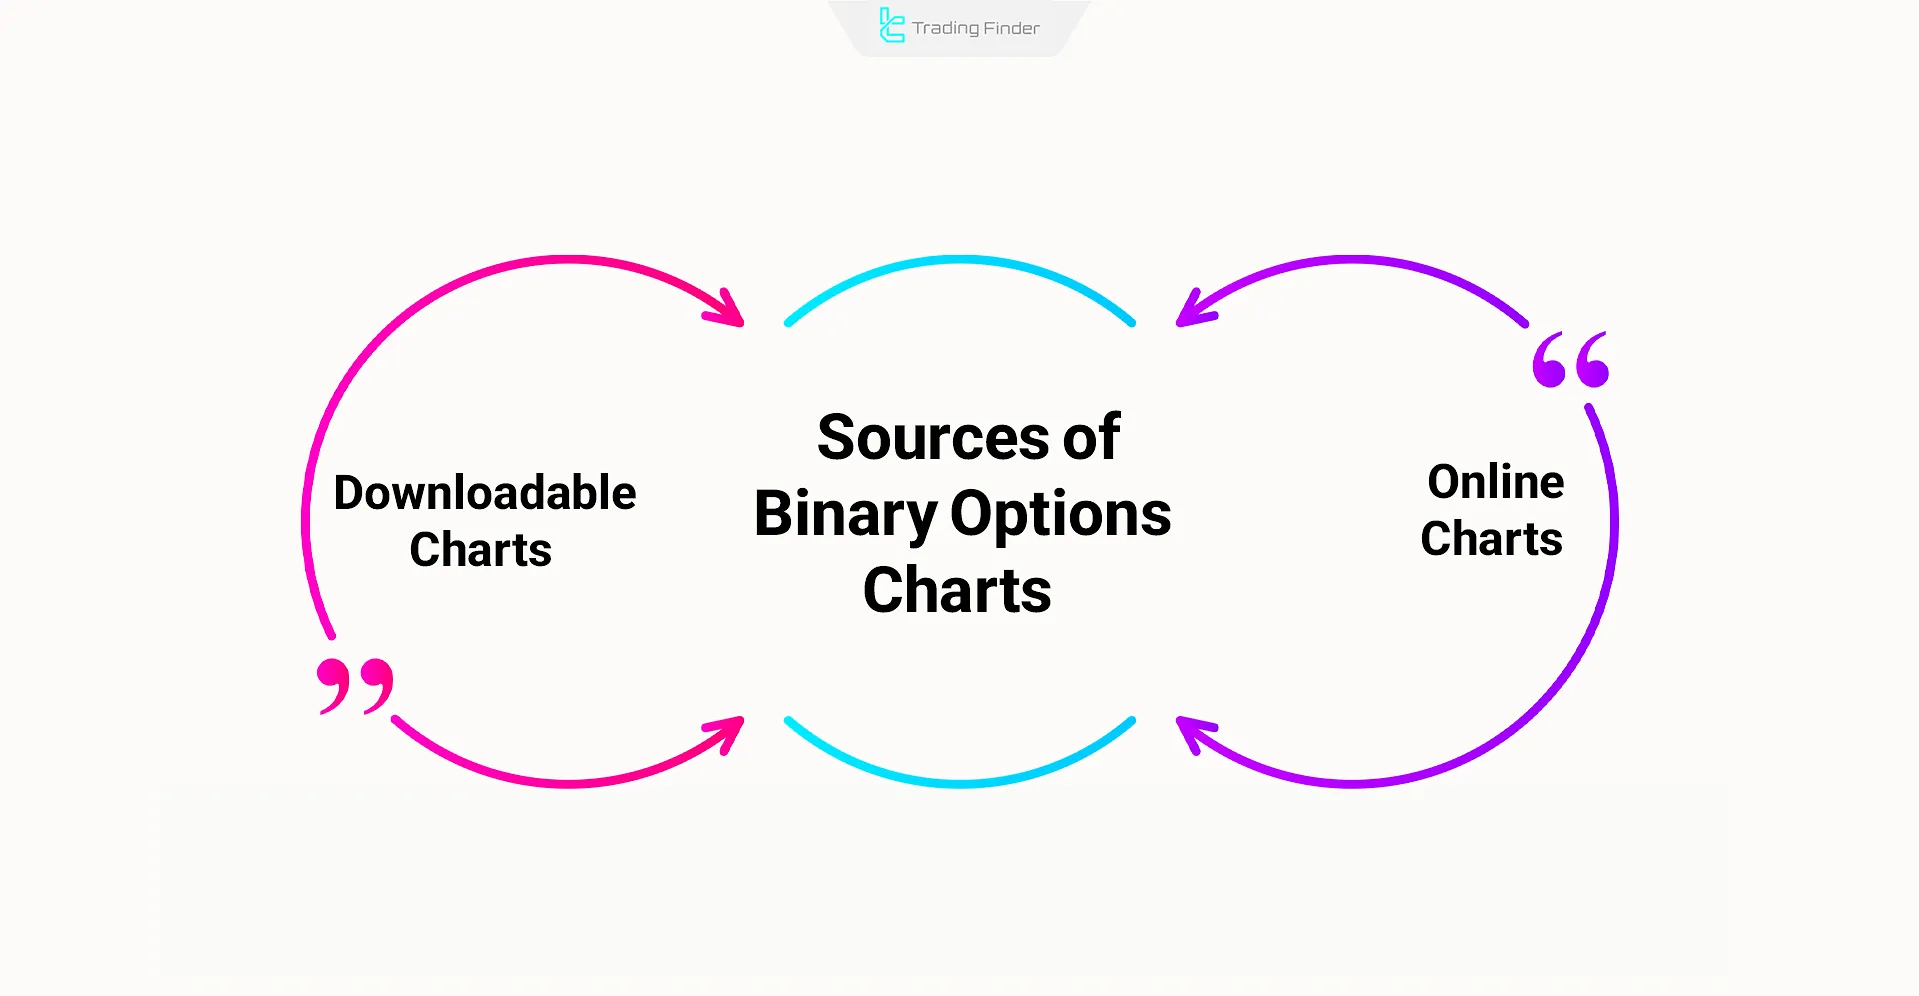
Sources of Binary Options Charts
To use Types of Binary Options Charts, traders have access to two main sources:
Downloadable Charts: Usually available as software, offering high customization, historical data saving, and advanced technical indicators;
Online Charts: Web-based or broker-integrated, often accessible without installation.
Types of chart sources in binary options (online and downloadable)
Downloadable Charts
These tools are installed on desktops and used for deeper market analysis:
MetaTrader 4 (MT4): One of the most used platforms for Forex and binary options, supporting indicators and expert advisors;
MetaTrader 5 (MT5): An advanced version of MT4 with more tools and extended timeframes;
MultiCharts: Suitable for professional traders with multiple data feeds;
NinjaTrader: Professional software for technical analysis and Trading strategy execution.
Online Charts
These do not require installation and run directly in the browser:
TradingView: Online charting tool with customizable indicators and scripts;
My FX Dashboard (by OFX): Free platform for viewing exchange rates and charts;
Investing.com Charts: Live charts for Forex, stocks, indices, and cryptocurrencies;
CoinMarketCap & CoinGecko Charts: Specially designed for crypto prices and token charts.
Price Feed Discrepancy Between Binary Options Brokers and External Sources
One of the hidden but influential challenges in binary options trading is the price feed discrepancy between the broker’s platform and external charts such as TradingView, MetaTrader, or tick-by-tick price sources.
This discrepancy may equal several pips or even fractions of a second in execution time, which can decide profit or loss in time-based binary option contracts.
Risk Management Solutions for Price Feed Discrepancy:
Use the internal broker chart (optionscharts) for analysis;
Choose brokers directly connected to recognized liquidity providers;
Base timing on candlestick sessions rather than external delays;
Compare with multi-source price-checking tools;
Trade on higher timeframes to reduce the effect.
For traders learning how to read binary data correctly, being aware of these differences is essential. In practice, this can also be combined with a binary to text chart analysis to validate signals.
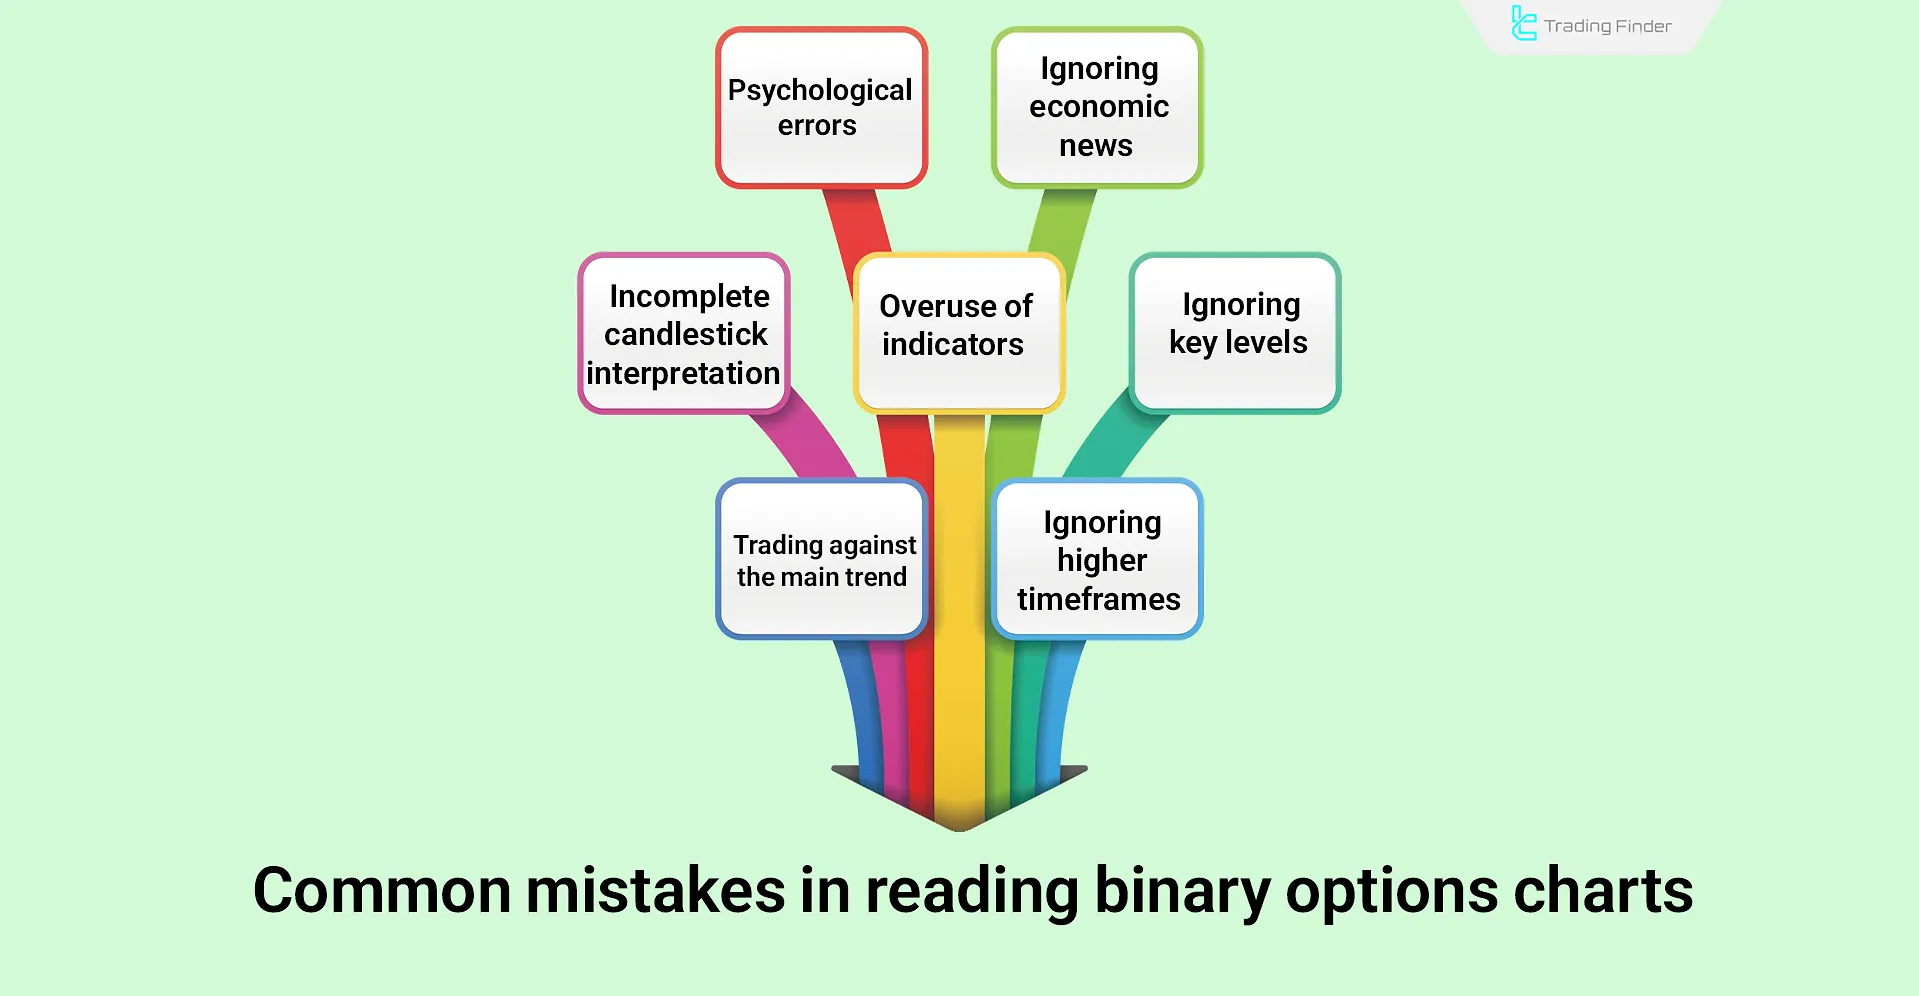
Common Mistakes in Reading Binary Options Charts
Among the most common trader mistakes is ignoring higher timeframes and focusing only on 1 or 5-minute binary options charts, which leads to false signals. Other frequent errors include:
Trading against the main trend: Entering opposite to the dominant market direction increases the risk of loss;
Incomplete candlestick interpretation: Ignoring shadows and the candle close location disrupts reading binary options charts for accurate entry;
Overuse of indicators: Applying too many tools creates conflicting signals;
Ignoring key levels: Entering without considering support and resistance levels;
Disregarding economic news: Sudden news-driven movements can override technical analysis and distort binary options chart patterns;
Psychological errors: Over-analyzing or imagining non-existent setups often causes emotional trading.
Types of common mistakes traders make when reading binary options charts
Conclusion
In binary options trading, accuracy in Reading Binary Options Charts determines profit or loss, since each chart provides unique information about price.
For example, candlestick charts are essential for price action and market psychology and bar charts for breakout identification.
To properly read Binary options charts, traders must proceed step by step: identify structure, recognize key levels, choose the right chart, analyze chart components, and select appropriate expiry.
Learn to Read Binary Options Charts PDF
Learn to Read Binary Options Charts PDF
Click to download Learn to Read Binary Options Charts PDF
Quiz
5 Questions
Q1: What is the primary characteristic that makes binary options trading different from other forms of trading in terms of chart analysis precision?
Q2: Which chart type is specifically designed to remove market noise by averaging price data?
Q3: What does each bar in a Bar Chart (OHLC) display?
Q4: What is the recommended expiry time ratio compared to the signal timeframe?
Q5: What type of chart is built based on the number of trades rather than time intervals?
FAQs
Why is chart reading important in binary options?
Because trade outcomes are simply yes or no, proper chart reading can make the difference between profit and losing the entire investment.
Which chart is best for price action in binary options?
The candlestick chart, as it shows market psychology and candlestick patterns, is the foundation of price action in binary options.
Is a line chart suitable for precise analysis?
Line charts are more for viewing overall trend direction; they are limited for detailed price action and entry points.
What is the advantage of using Heiken Ashi in binary options?
Heiken Ashi removes market noise and clarifies trends, but due to lag versus real price, it should be used with the main chart.
What is the use of Renko charts in binary options?
Renko removes small price moves and highlights main trends, making it useful for continuation trades and identifying support/resistance.
Are Tick Charts suitable for all traders?
No, Tick Charts are better for scalpers and high-frequency traders in liquid markets, but can be difficult for beginners due to speed.
How should expiry time be aligned with charts?
Expiry should be 1–2 times the signal timeframe. For M1 signals, 60–120 seconds is logical.
Are indicators essential for reading binary charts?
Indicators like RSI and Stochastic can complement price action for precise binary options entry and exit, but they are not sufficient on their own.
What makes Point & Figure charts different?
They show price changes without considering time, useful for identifying valid breakouts and key levels.
Can line charts cause mistakes?
Yes, since they only show closing prices and omit Open, High, and Low data, which are vital for some strategies.
Which chart is best for turbo or scalping trades?
Candlestick and Tick Charts are best, as they display real-time detail for precise entries.
Which software is most professional for binary options analysis?
MetaTrader 4 & 5 and NinjaTrader are among the most advanced tools.
Do all binary platforms provide all chart types?
No, many brokers only offer candlestick and line charts. For advanced charts, external software is needed.
To improve binary options education, traders can also download reliable software for binary charts, including tick, line, candlestick, and even advanced tools showing heikin ashi disadvantages or comparing types of binaries across platforms.
How can fake signals in charts be detected?
By combining candlestick reading, checking key levels, and using confirming indicators, weak or fake breakouts can be filtered.