


The RTM Diamond Pattern is one of the main patterns in the RTM style that deceives both buyers and sellers. This pattern appears when market makers and large financial institutions are accumulating liquidity in the market.
The technical Diamond Pattern usually forms at the end of strong trends and signals an imminent market reversal.
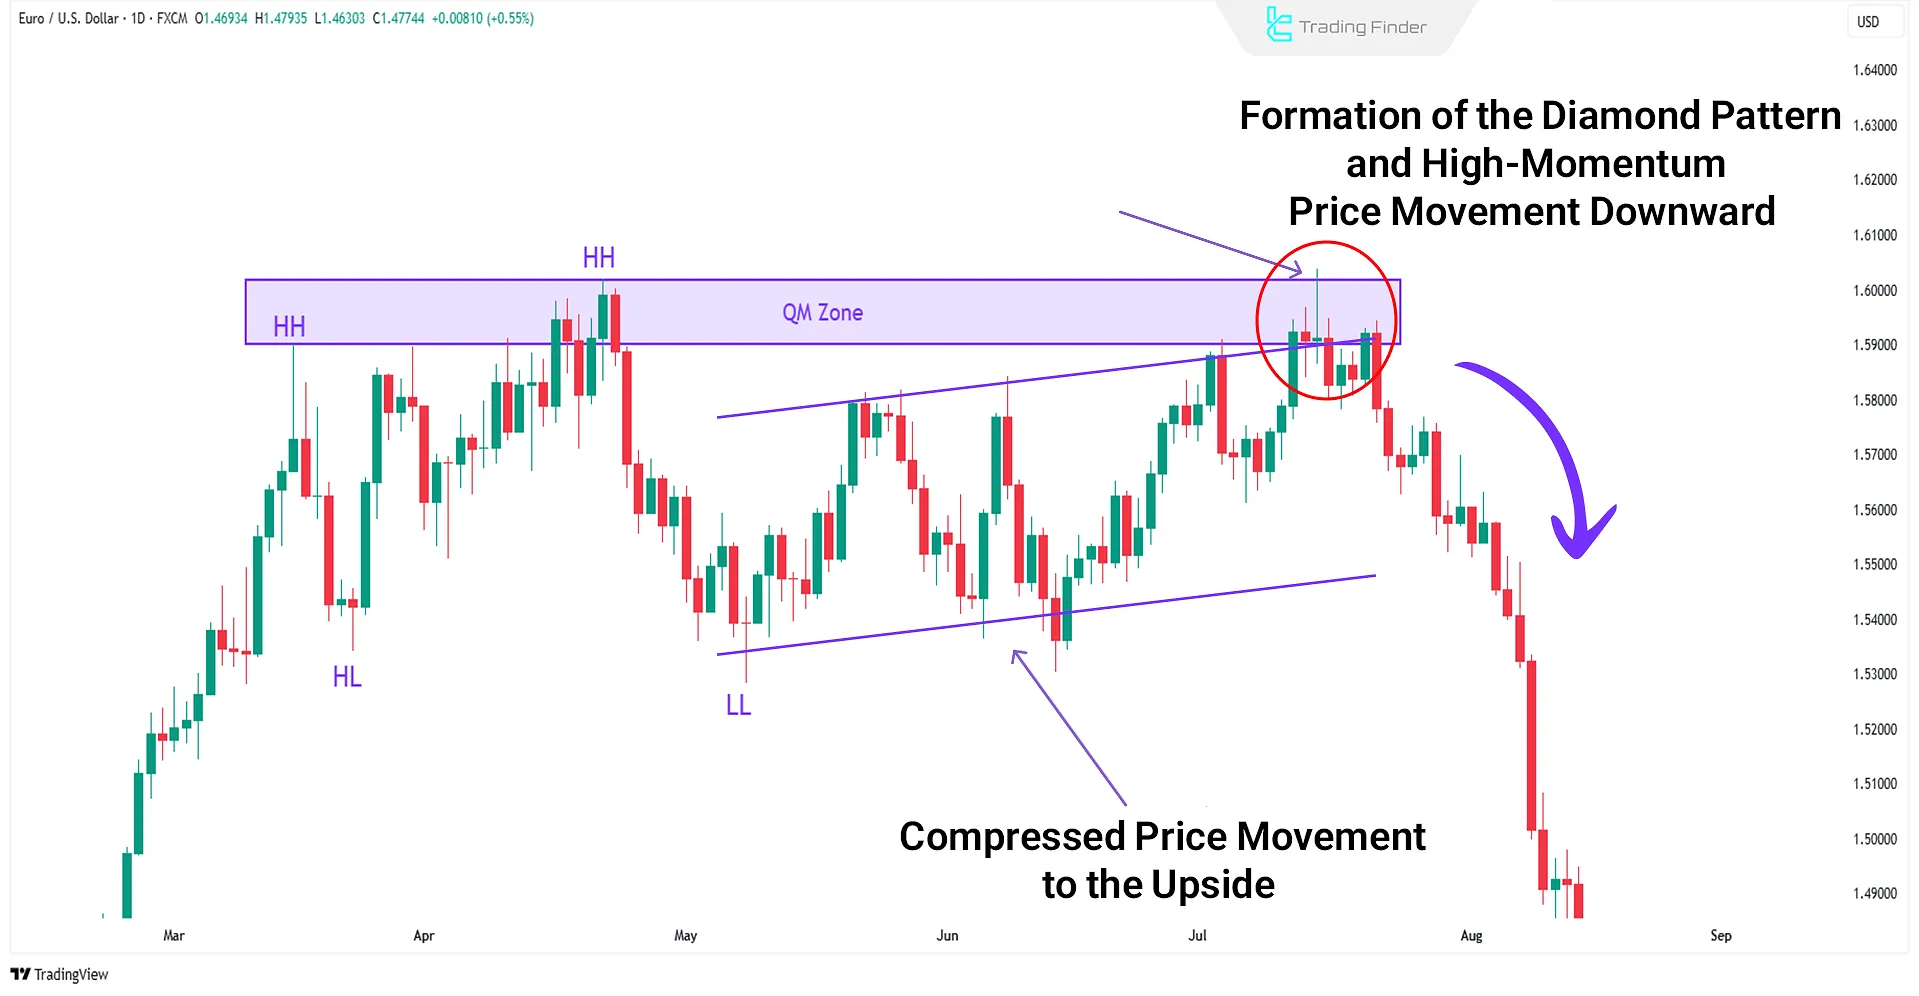
This structure combines false breakouts, volatility compression, and a gradual expansion of price movement range a situation that often traps retail traders in deceptive moves engineered by market makers.
In essence, the Diamond Pattern represents a phase of smart distribution or accumulation, during which major financial institutions use the liquidity generated by false breakouts to complete their large buy or sell positions.
Definition of the Diamond Pattern
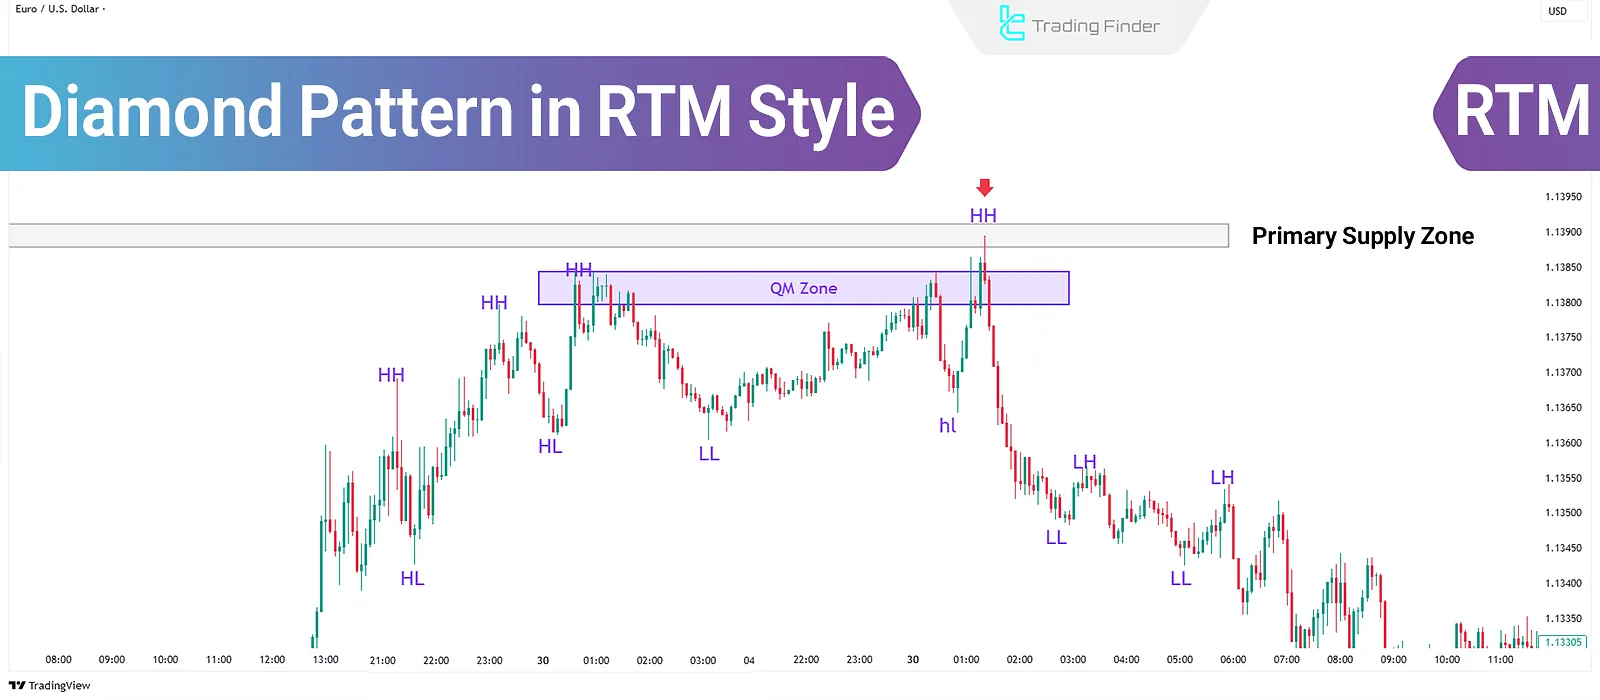
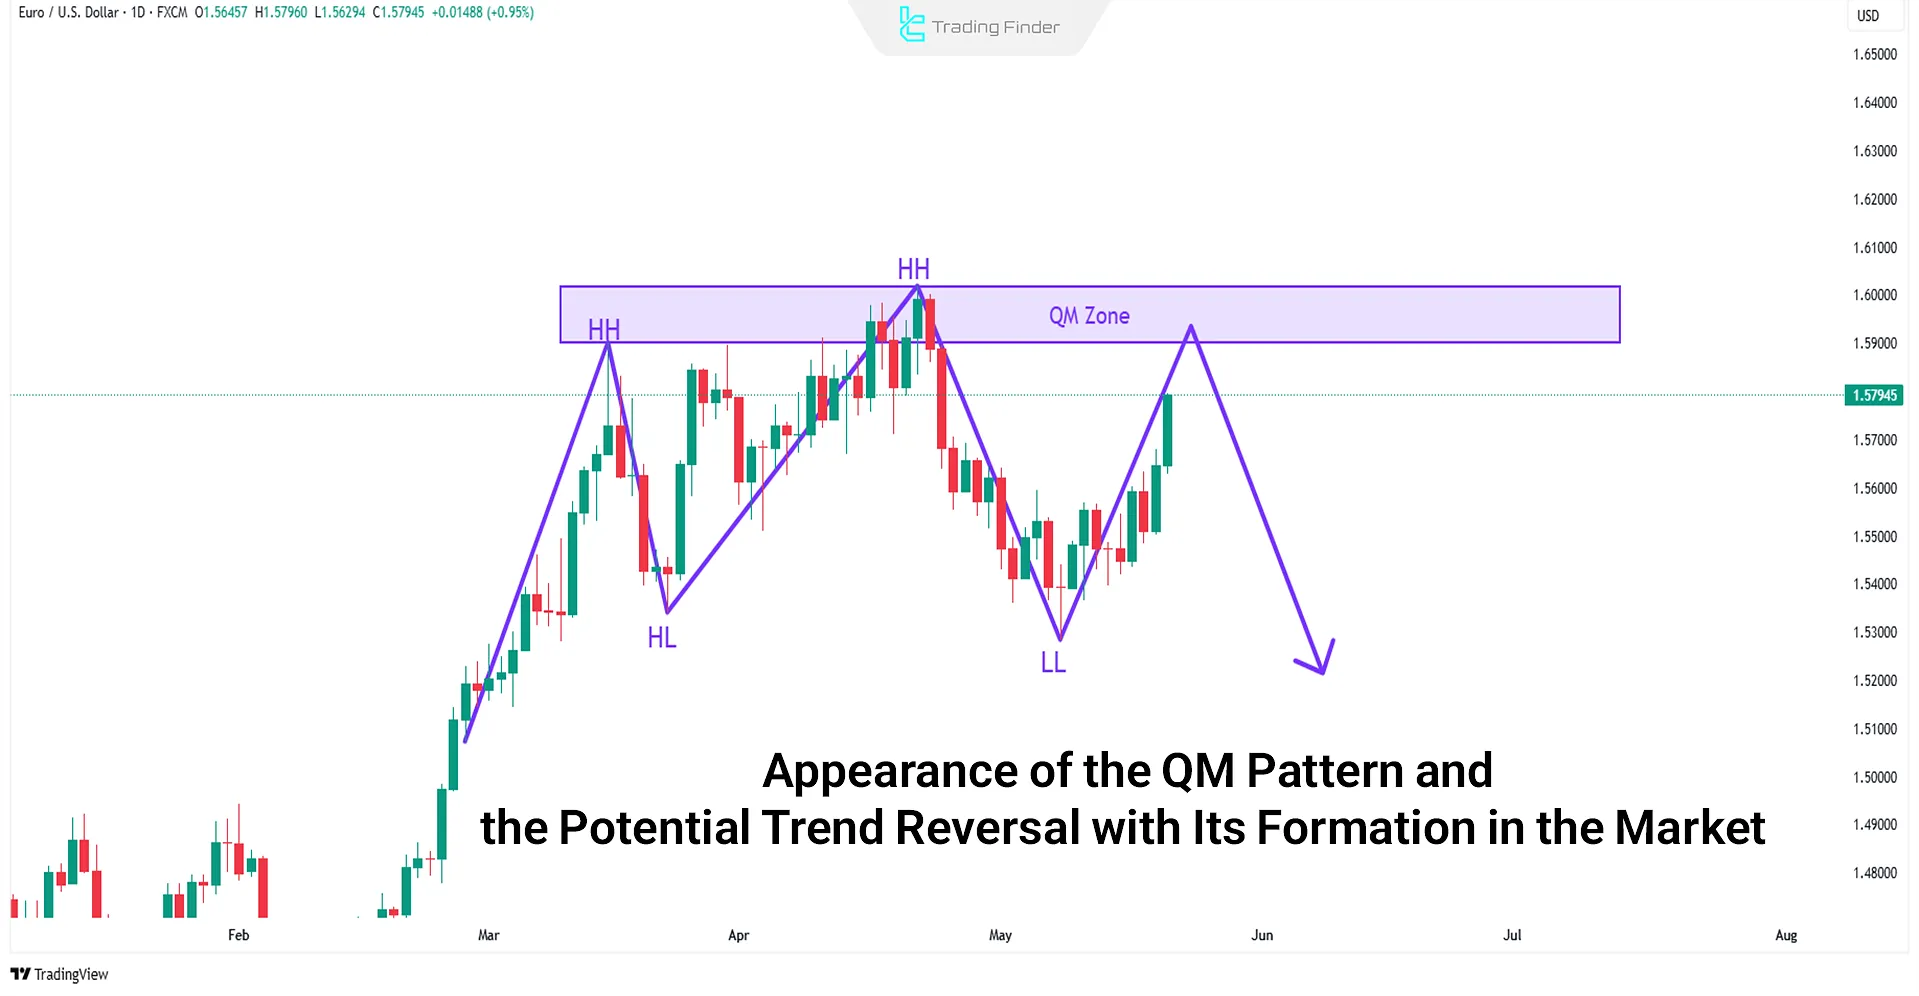
The RTM diamond pattern is a reversal setup that usually forms at key market tops and bottoms. It appears once the Quasimodo (QM) pattern has been violated.
For the pattern to form, price must revisit the QM Zone without reacting in a Quasimodo manner and must instead sweep traders’ stops.On the next move, after collecting those QM stops, price reverses direction and the diamond pattern RTM materializes.
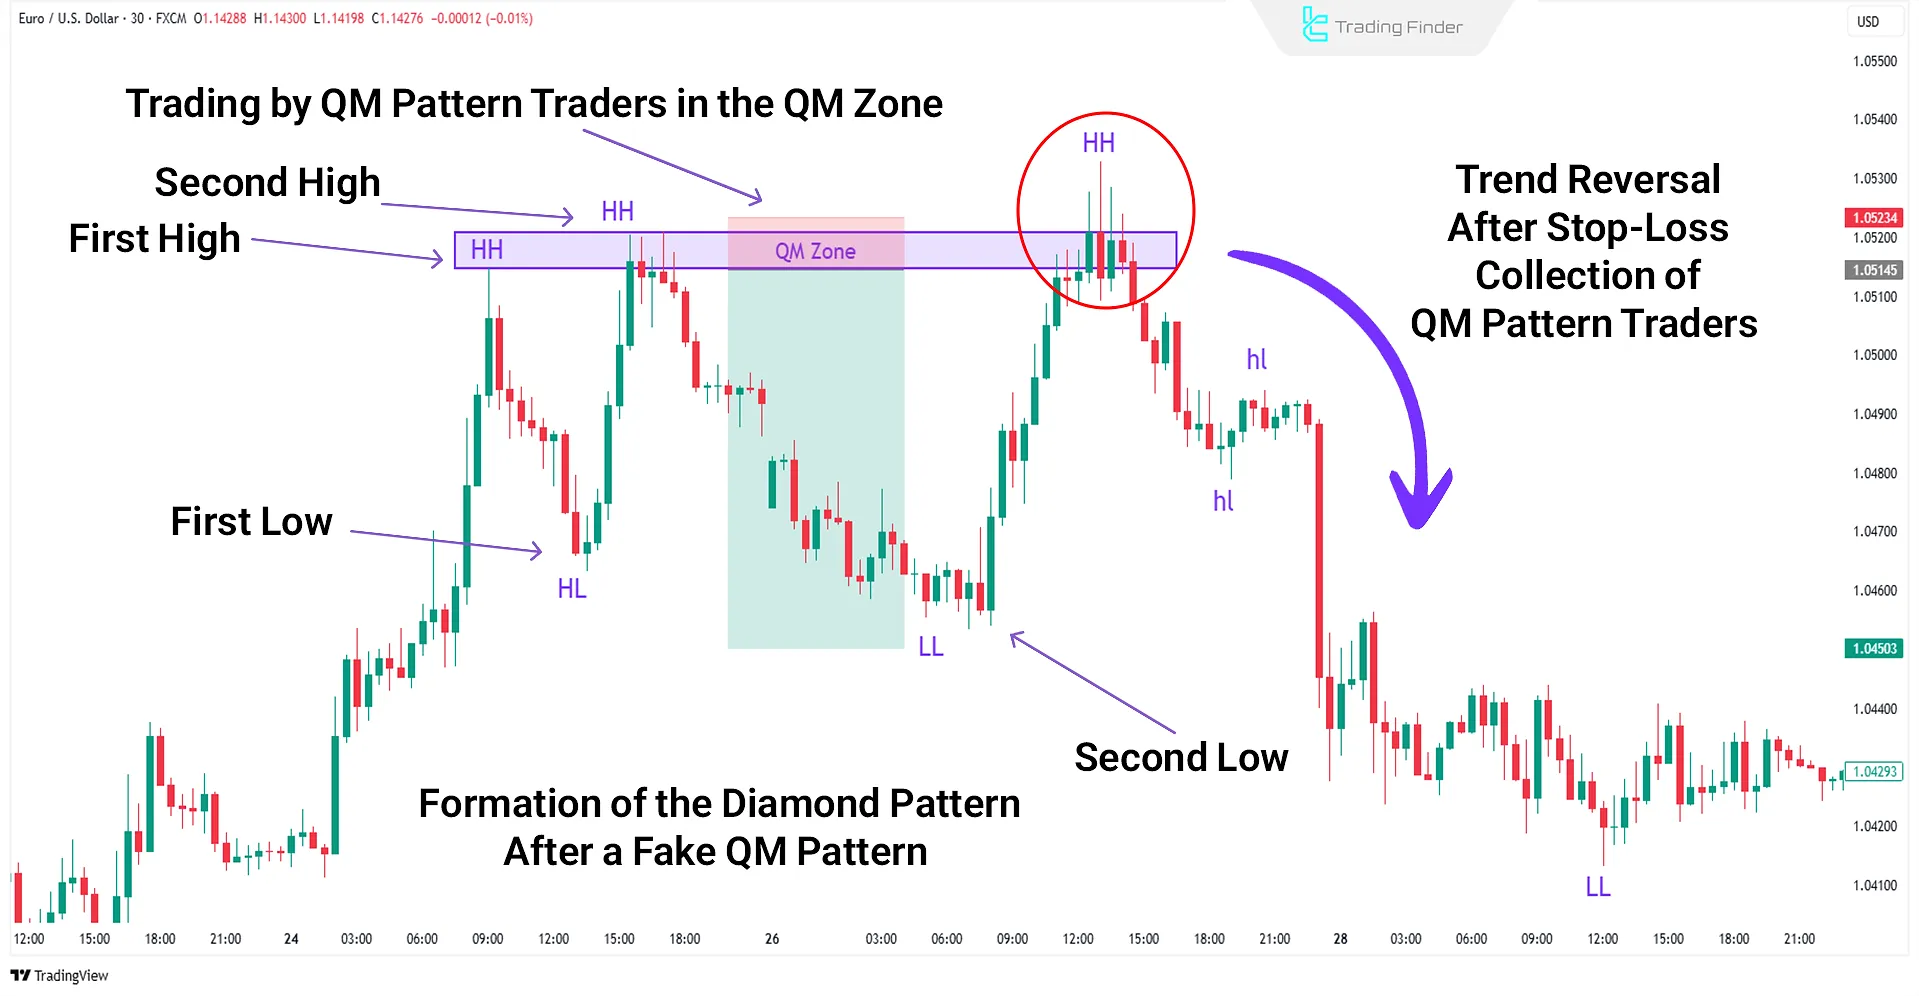
In a Diamond Pattern in RTM Style, the stop-losses of five groups of traders are triggered:
- Sellers at the first high
- Buyers at the first low
- Sellers at the second high
- Buyers at the second low
- Sellers within the QM Zone
Difference Between the RTM Diamond Pattern and the Classic Diamond Pattern
Unlike the classic Diamond Pattern, which is analyzed based on intersecting trendlines and price breakouts, the RTM style focuses primarily on liquidity behavior and fake breakouts.
The table below presents a detailed comparison between the RTM and classic Diamond patterns:
Features/Criteria | RTM-Style Diamond Pattern | Classic Diamond Pattern |
Analytical Basis | Based on Liquidity Behavior and Fake Breakouts | Based on intersecting trendlines and actual price breakouts |
Initial Structural Formation | Violation of QM (Quasimodo) structure, focus on Market Structure Shift (MSS) and liquidity manipulation | Formation of symmetrical and converging swings |
Key Analytical Concept | CP (Compression), Stop Hunting, and institutional order flow behavior | Chart pattern and trendlines, with no deep focus on order flow |
Entry Trigger | Based on Fake Breakout or reversal from a liquidity accumulation zone before the final apparent breakout | Confirmed breakout of trendline or support/resistance level |
Common Formation Area | Key Supply & Demand Zones and high-liquidity regions | Mid-trend or market reversal phases |
Analytical Accuracy and Noise Filtering | High precision in identifying price manipulation and hidden liquidity, less noise | Highly sensitive to price noise with a higher risk of false signals |
Risk-to-Reward Ratio (R:R) | Higher ratio due to earlier entry before the apparent breakout and smaller stop loss | Lower ratio due to later entry and reliance on breakout confirmation |
View on Breakout | Fake breakout as a sign of smart money entry | Real breakout as a signal of trend reversal |
User Level and Complexity | Advanced level, requiring deep understanding of RTM concepts and market psychology | Simple level, based on traditional technical analysis, suitable for general traders |
Diamond Identification Guide
The Diamond Pattern generally appears in two main reversal forms:
- Bullish Reversal Diamond: Forms at the end of a downtrend and signals the potential start of a new uptrend;
- Bearish Reversal Diamond: Appears at the end of an uptrend and indicates the beginning of a bearish phase in the market.
To identify the Bullish and Bearish Diamond Pattern, you need solid knowledge of RTM supply-and-demand zones so that you only act when the setup appears in a valid price area.
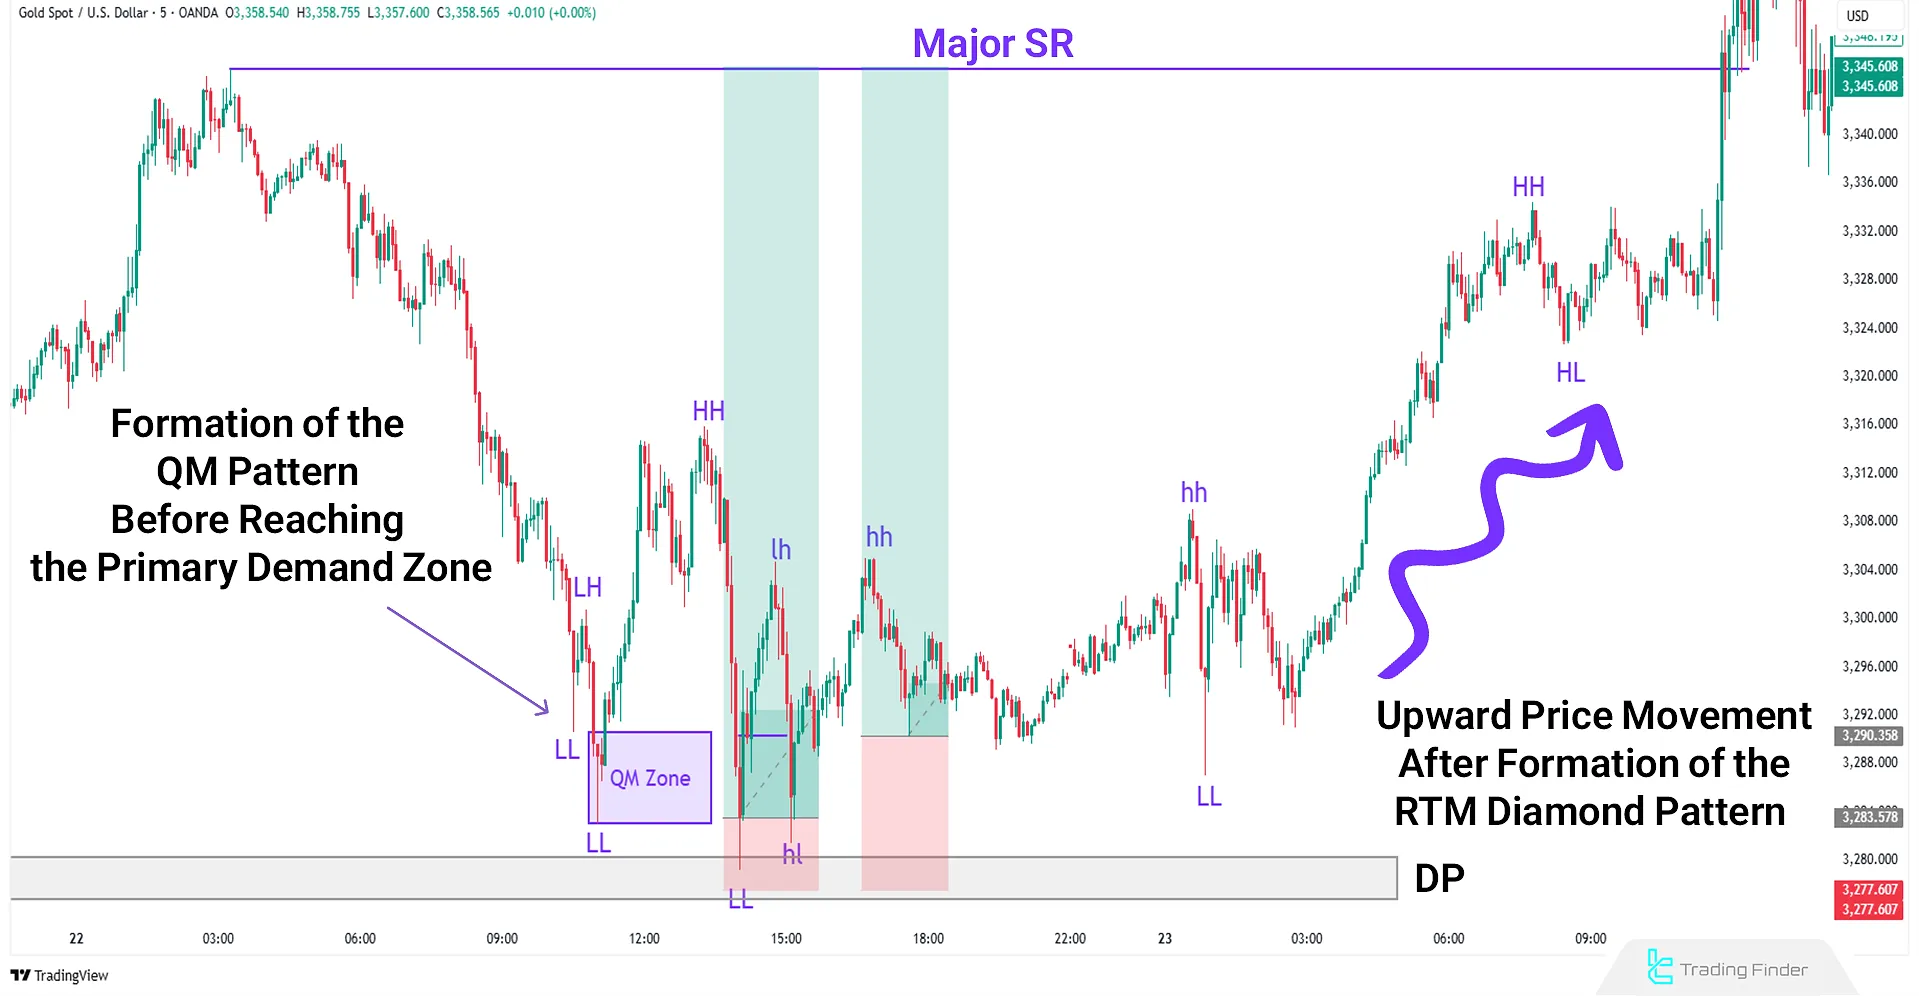
Typically, the RTM diamond pattern shows up when price has yet to reach the main supply or demand zone and the Quasimodo fails to confirm.
Put differently, a fake QM forms before price taps the primary zone; After liquidity is taken, the diamond forms and a trend reversal follows.
Trading Steps for the Diamond Pattern
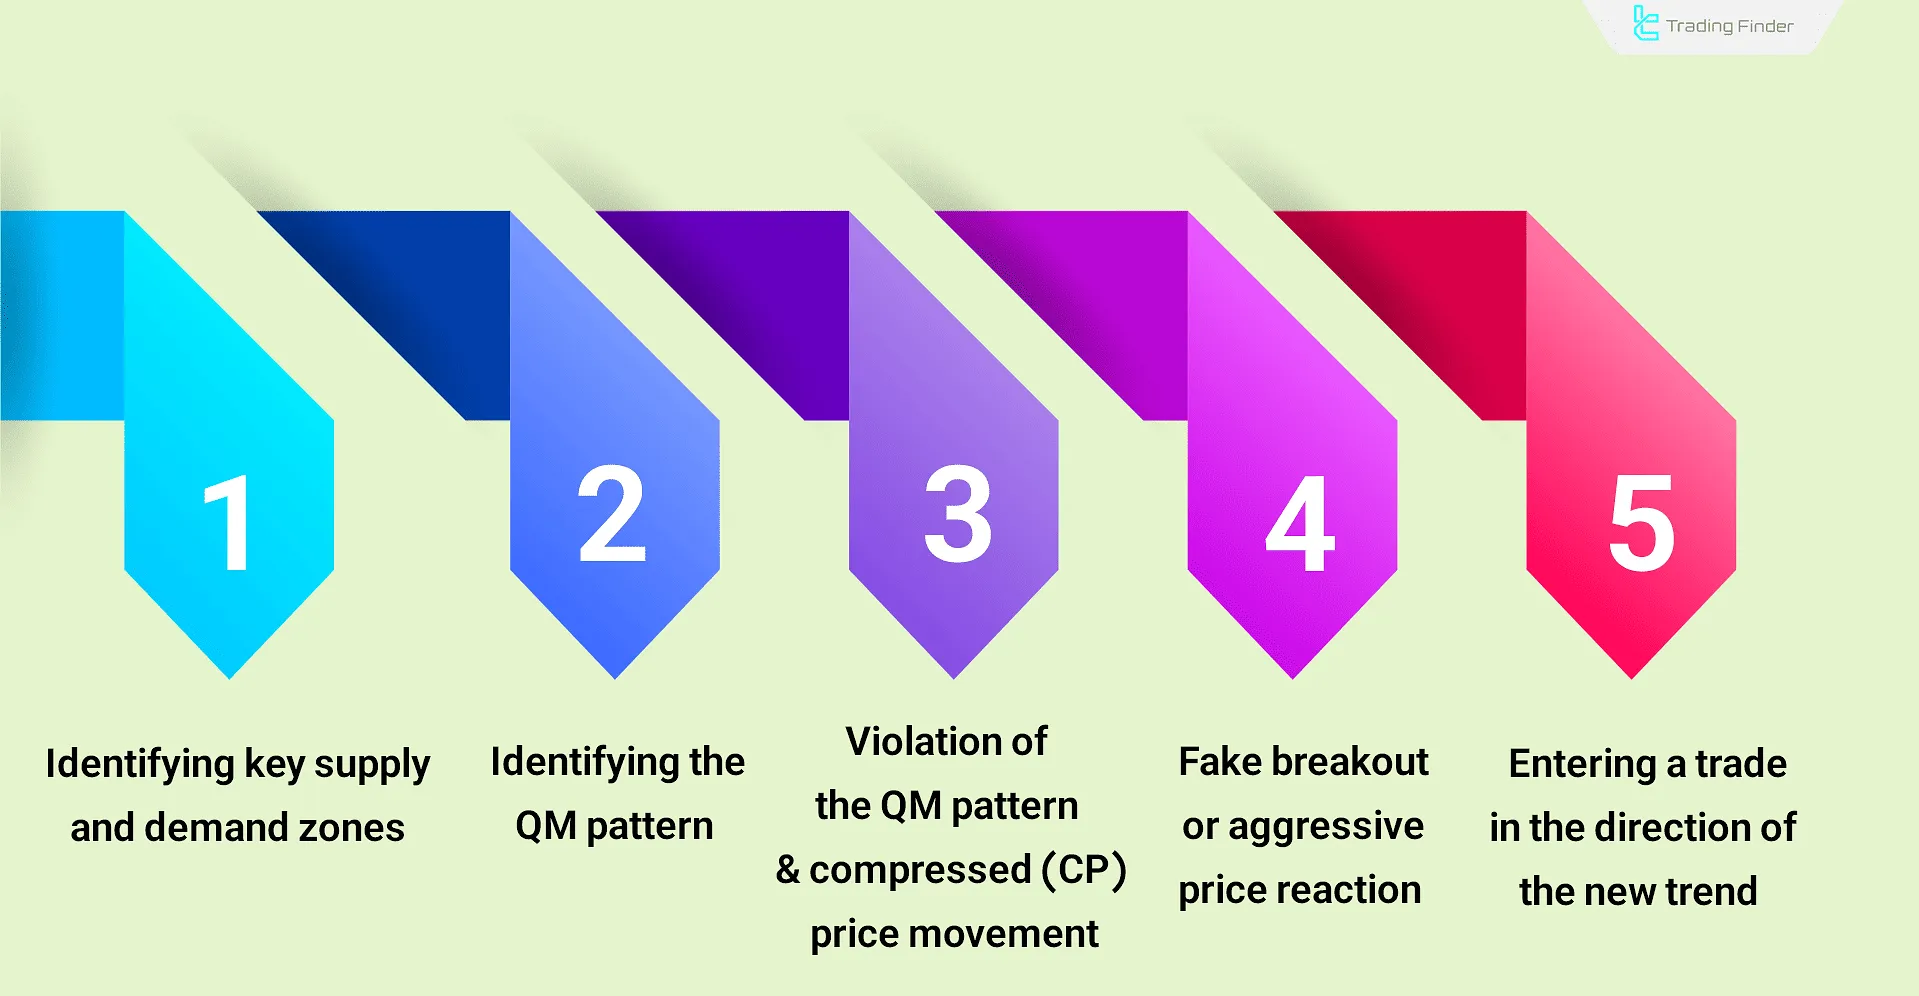
To learn the RTM Diamond Pattern, you should follow the steps below:
- Identify primary supply and demand zones;
- Spot the QM pattern;
- Watch for QM violation and a compressed price (CP) move inside the QM Zone;
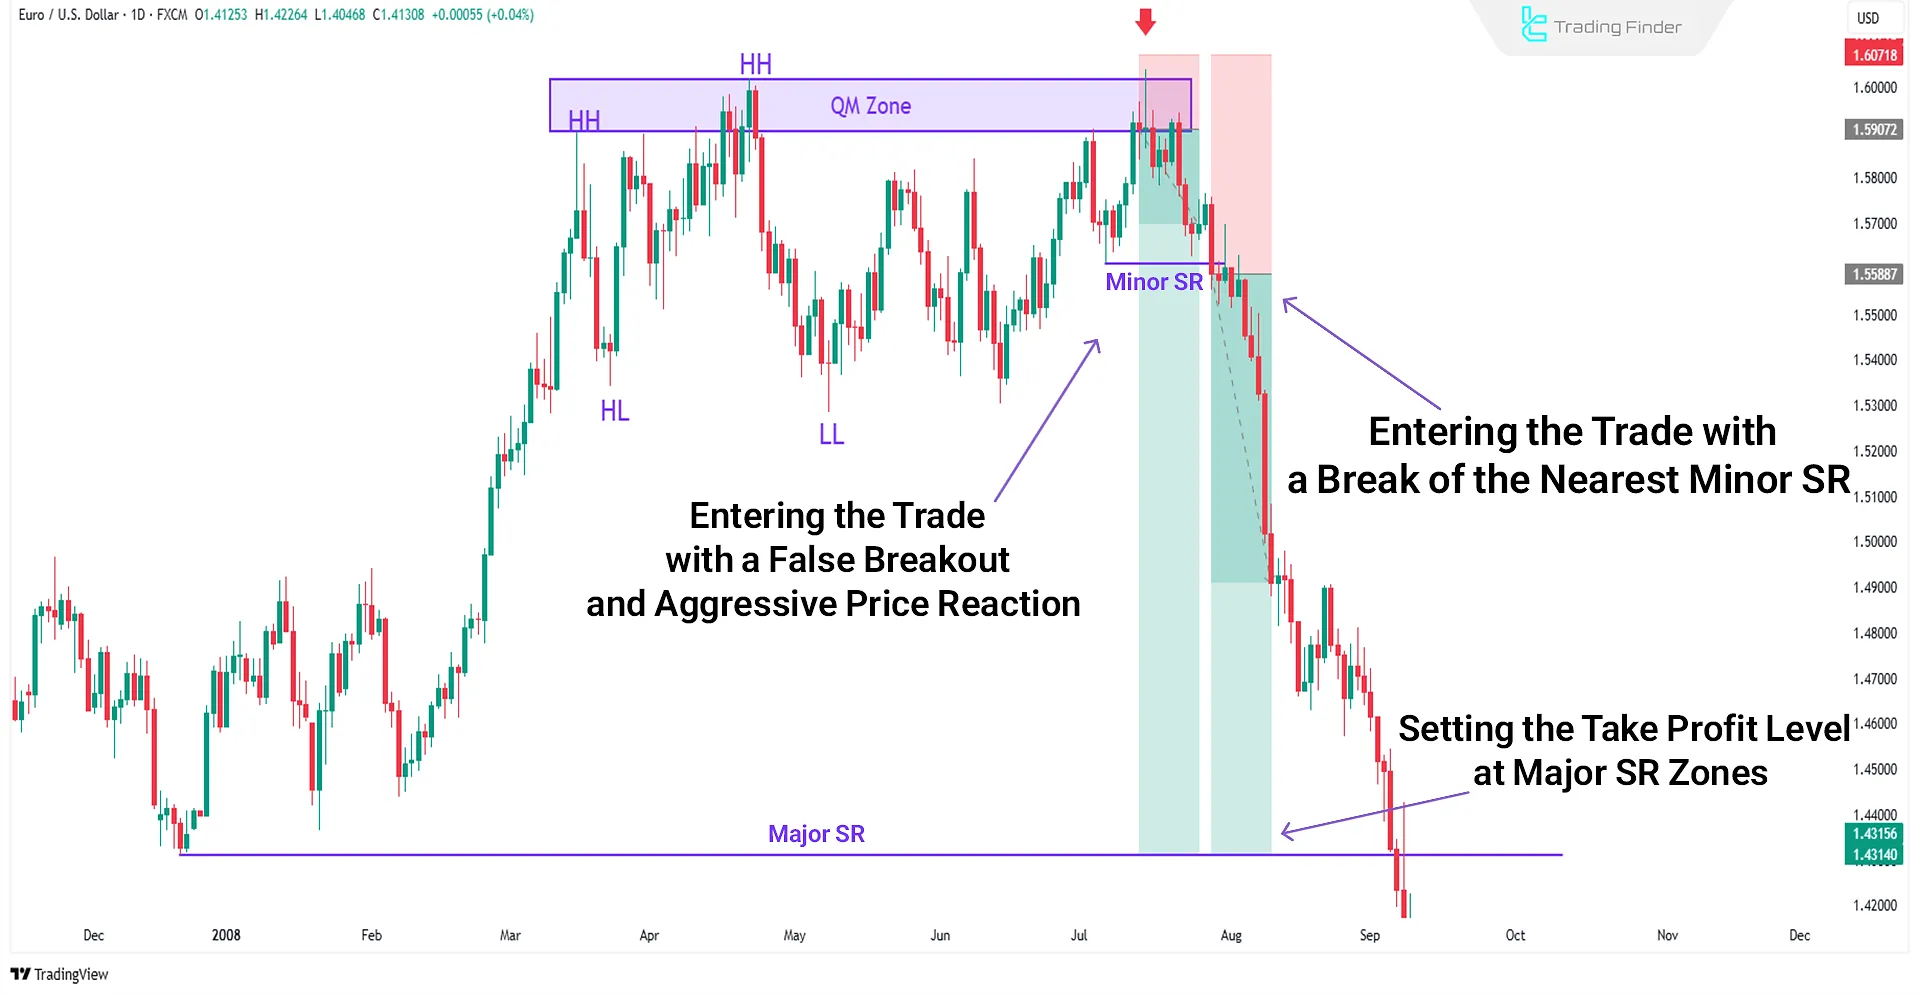
- Look for a fake break or aggressive price reaction;
- Enter in the direction of the new trend.
#1 Identify Primary Supply and Demand Zones
To mark core RTM zones, you must master elements such as FTR, Flag, DP and more. After plotting a zone, ensure price actually taps it even a single-pip penetration counts.
The educational video from the Smart Risk YouTube channel provides training on identifying the best supply and demand zones in the market, which interested viewers can benefit from.
#2 Spot the QM Pattern
Next, price should form a QM before reaching the zones. Traders unsure of their levels often trade the Quasimodo; When that stop is hit, the odds of an RTM diamond pattern rise.
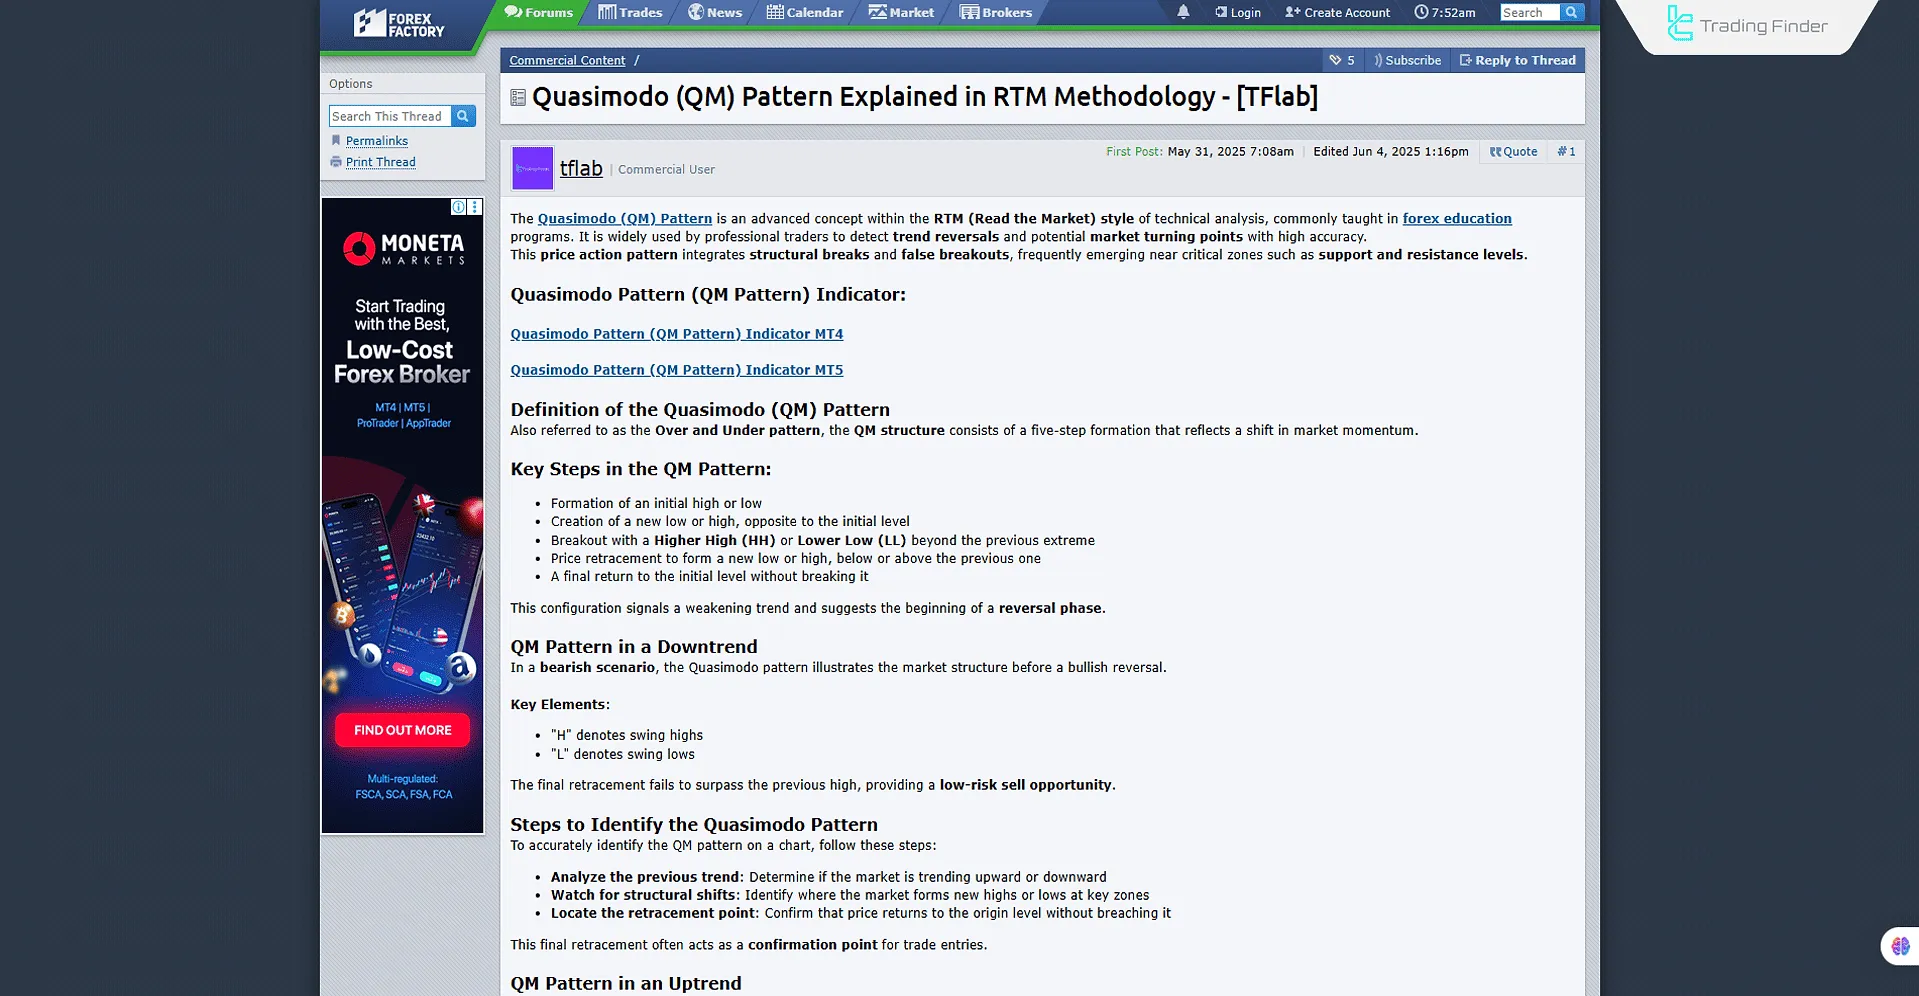
For a better understanding of the QM pattern, you can refer to the Quasimodo (QM) Pattern training article on forexfactory.com.
Note that sometimes a QM stop-out is inevitable and becomes one of the clues for the diamond.
#3 QM Violation and CP Move Inside the QM Zone
In most cases, during the QM violation, price compresses (CP) inside the QM Zone, then sweeps stops.
A CP move here is a strong hint that a diamond pattern RTM may follow.
#4 Fake Break or Aggressive Reaction
After violating the QM, price must sweep stops via a fake break or aggressive candles with long wicks.
That sweep provides the liquidity banks and institutions need, and the new trend kicks off.
#5 Enter in the New Trend Direction
Post fake-break, price reverses with strong momentum. Using candle confirmation or technical indicators, you can enter and place the stop behind the high/low created by the fake break.
Take-profit for the RTM diamond pattern sits at subsequent SR levels, anticipating a sustained trend reversal.
Example Trade with the Diamond Pattern
Below is another bullish-reversal example after an RTM diamond pattern forms:
Key Points When Using the Diamond Pattern
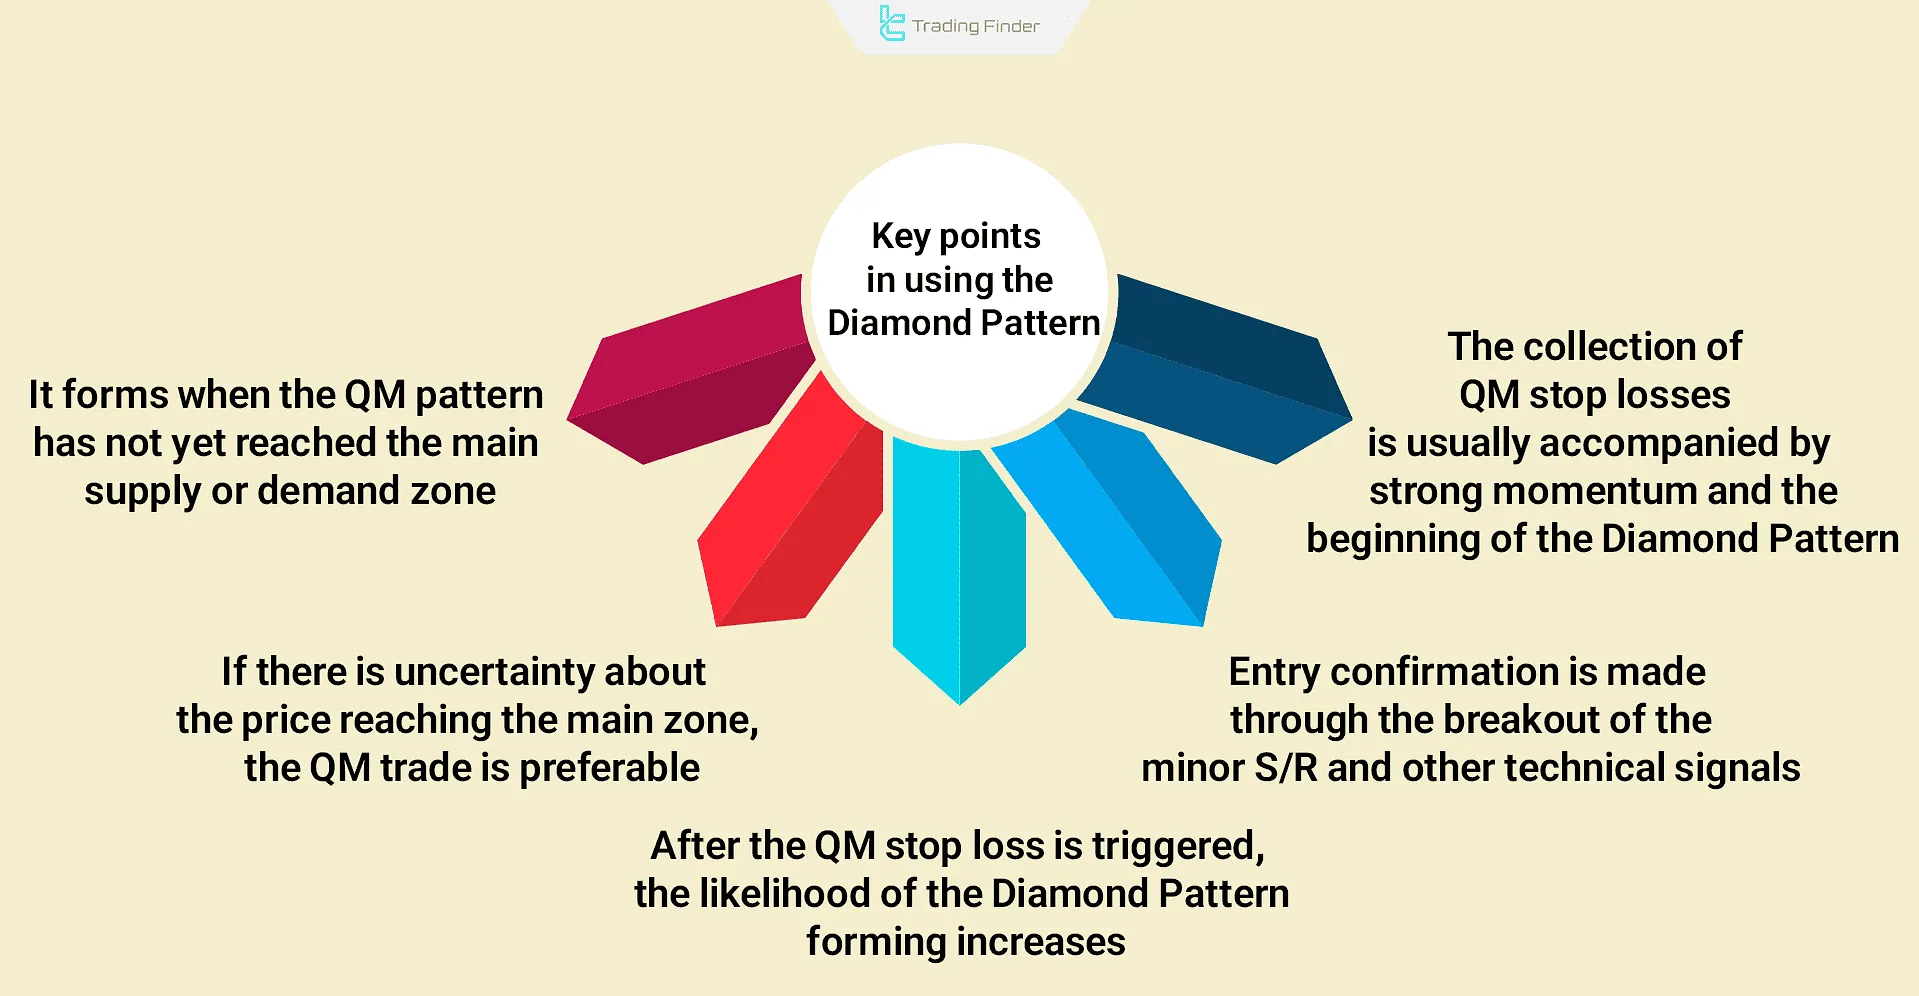
When using the RTM Diamond pattern, keep the following points in mind:
- When the QM hasn’t yet reached the primary supply/demand (FL, DP, FTR, etc.), the RTM diamond pattern becomes likely;
- When confidence is low that price will hit the primary zone, trading the QM is recommended;
- Professional traders, once stopped out on the QM, look for the diamond pattern RTM to appear and trade it;
- To confirm, wait for the nearest minor SR break; you can also use additional technical analysis signals;
- After sweeping QM stops, price usually reverses with higher momentum another clue that the Diamond Pattern in RTM Style is forming.
Application of the RTM Diamond Pattern Across Different Timeframes
The Diamond Pattern in the RTM style behaves differently depending on the trading timeframe:
- Higher Timeframes (H4, Daily): Signals are more reliable, and liquidity phases can be identified with greater clarity;
- Lower Timeframes (M15, M5): Allow for more precise entries but come with increased risk.
The best results are achieved when confirmation of the pattern on a higher timeframe is combined with precise entries on a lower timeframe.
Advantages and Limitations of the RTM Diamond Pattern
The table below provides a concise analysis of the key strengths and weaknesses of the Diamond Pattern structure in the RTM style.
Advantages | Disadvantages |
High accuracy of reversal signals in liquidity zones | Difficult to identify on lower timeframes |
Very high risk-to-reward ratio compared to other RTM patterns | Requires full mastery of QM, CP, and FL concepts |
Can be combined with candlestick or indicator confirmations | Possibility of errors in low-liquidity markets |
Diamond Pattern Indicator in MetaTrader
The Diamond Pattern Indicator for MetaTrader is a practical technical analysis tool designed to detect the classic Diamond Pattern on price charts.
This pattern is recognized as one of the market’s reversal structures, capable of identifying potential trend reversal points in key market zones.
The indicator functions by combining ZigZag lines and detecting consecutive peaks and troughs to automatically display the Diamond structure on the chart.
- Download Diamond Pattern Indicator for MetaTrader 5
- Download Diamond Pattern Indicator for MetaTrader 4
A Bullish Diamond Pattern usually forms at the end of a downtrend, indicating a possible shift toward upward movement. Conversely, a Bearish Diamond Pattern appears at the end of an uptrend, signaling the potential start of a price decline.
Traders can use this indicator alongside support and resistance levels or during a retracement phase to confirm a trend reversal.
On a 15-minute currency pair chart, detection of a Bullish Diamond Pattern triggers a buy position after a breakout above the upper trendline of the pattern.
In this setup, the stop loss is placed below the last swing low, and the take profit target is set equal to the height of the diamond.
In another example, on a 1-hour currency pair chart, a Bearish Diamond Pattern generates a sell position once the lower boundary of the pattern is broken.
In the settings section, the Show ZigZag Line option enables the display of the ZigZag structure, while visual properties such as color, width, and line style (Dashdot) can be customized.
The Show Diamond Pattern option activates the display of the pattern itself, typically highlighted in dark blue. Ultimately, the Diamond Pattern Indicator can be effectively applied in forex, cryptocurrency, stock, and commodity markets.
Combining it with higher timeframe trend analysis enhances the accuracy of signals and creates trading opportunities with greater success potential.
Conclusion
The RTM diamond pattern is a prime reversal setup that usually forms at major highs and lows. It reflects sophisticated liquidity grabs by large institutions.
The formation appears after a Quasimodo violation; once QM stops are swept, price often powers into a new trend. When traded correctly, the pattern offers attractive risk-to-reward (R:R) opportunities.


