


The ICT 30 Pips a Day Strategy incorporates various concepts from the ICT Style such as Draw On Liquidity (DOL), Optimal Trade Entry (OTE), Market Structure Shift (MSS), and more. This setup is widely used for day trading.
Thanks to its structure, this ICT Daily 30 Pips Trading Strategy is designed to yield a minimum of 30 pips per trade, hence the name.
What Is the ICT 30 Pip a Day Trading Setup?
The ICT 30 Pip Trading Setup uses Top Down Analysis to define the Daily Bias, analyzing price movements, and identify entry and exit points.
Higher timeframes (HTF) are used to determine the bias and key swings, while lower timeframes (LTF) are used to pinpoint exact trade entries and exits.
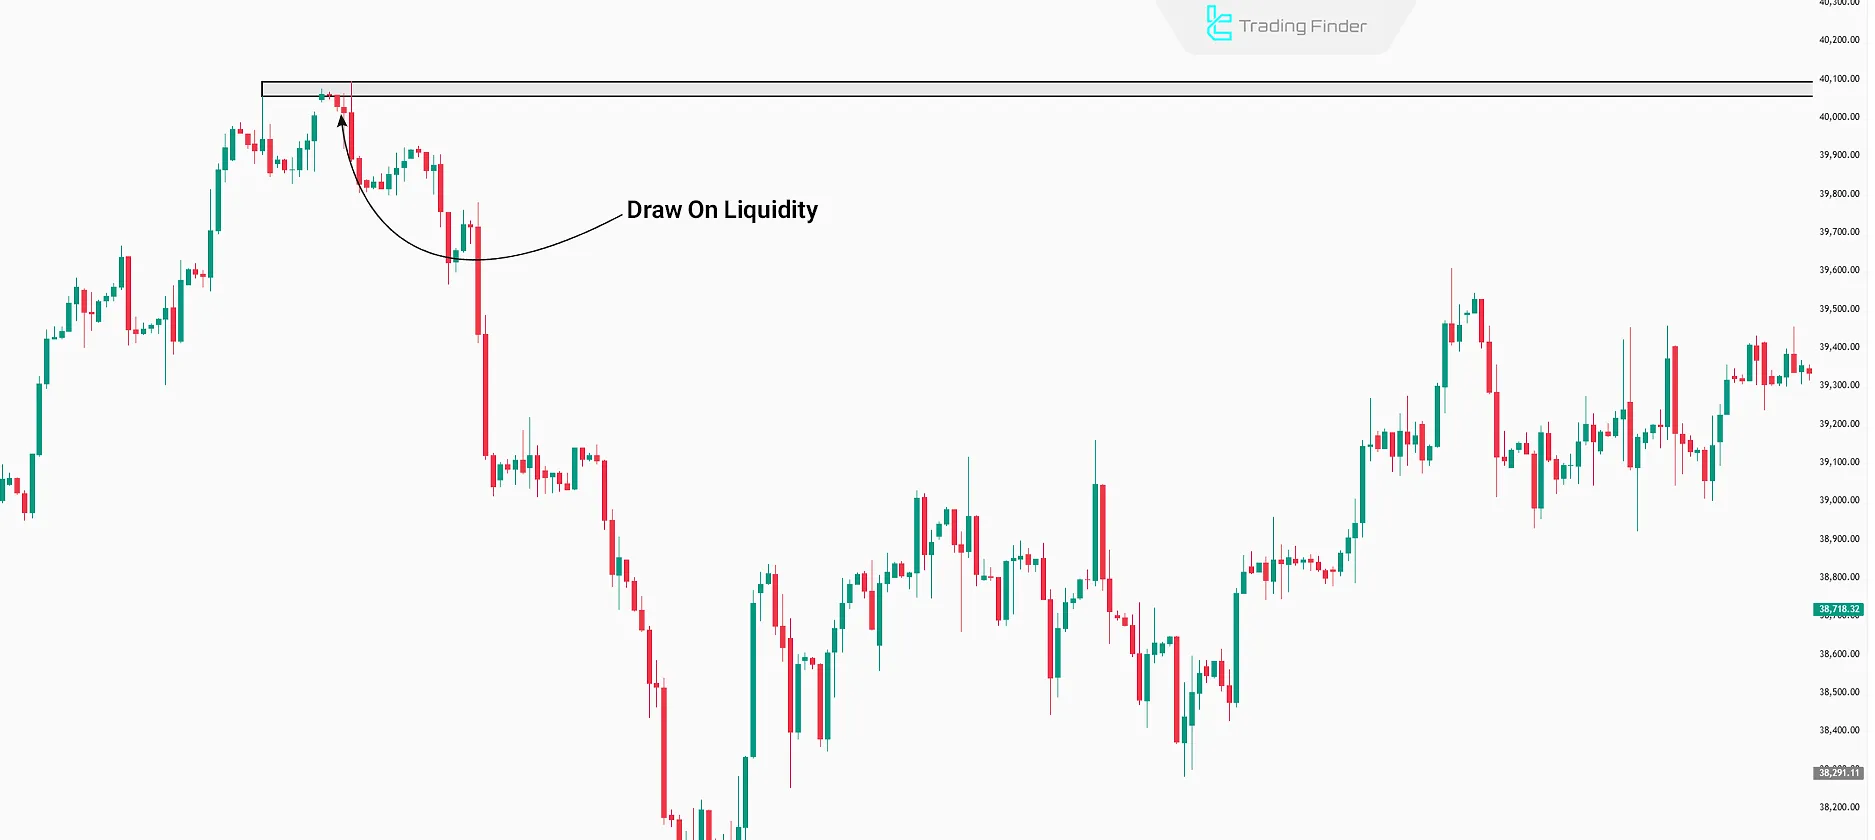
What Is the Role of Draw On Liquidity (DOL)?
In the ICT methodology, price moves are analyzed based on liquidity behavior. Draw On Liquidity (DOL) refers to price moving toward areas with the highest available liquidity.
In the ICT 30 Pip a Day Strategy, DOL is mainly used to identify take profit levels.
What Is the Role of Optimal Trade Entry (OTE)?
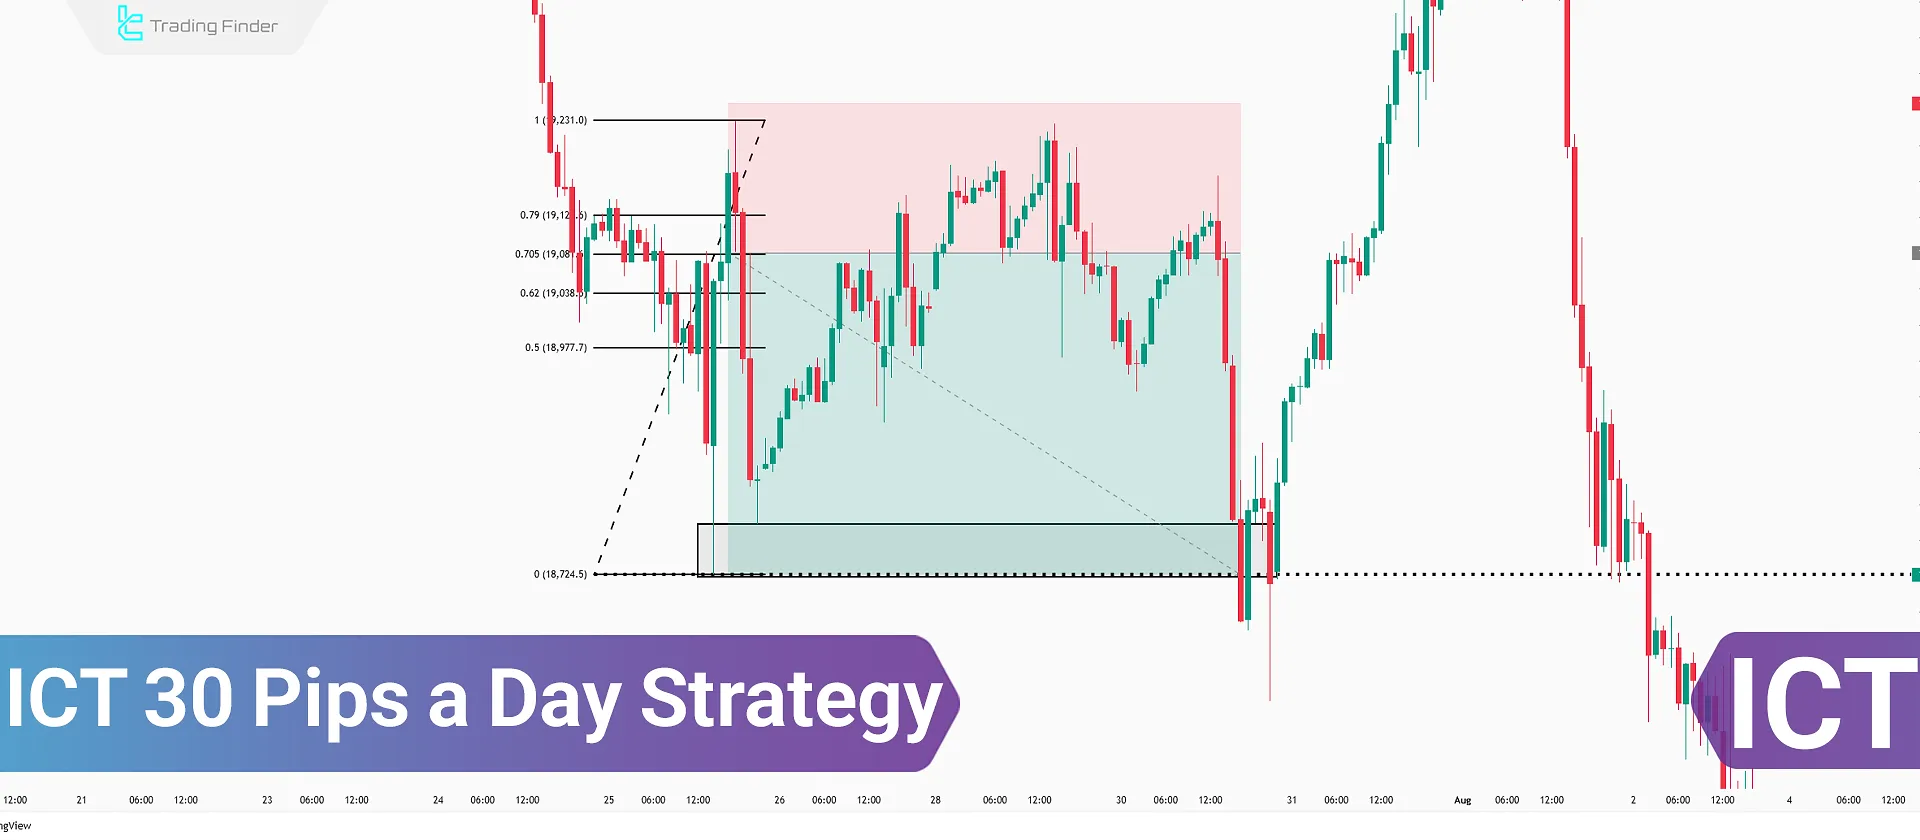
OTE zones are defined using Fibonacci retracement levels and represent the most efficient areas to enter a trade within the ICT framework.
The key Fibonacci levels used for identifying OTE are:
- 0
- 0.5
- 0.62
- 0.705
- 0.79
- 1
Steps for Trading the ICT Daily 30 Pips Strategy
This strategy starts with market analysis on HTF and proceeds to identify trade entries/exits on LTF, applying ICT concepts like Market Structure Shift and DOL.
The concept of market structure shift is fully explained in the article Market Structure Shift Tutorial on the FXOpen website.
#1 Identifying the Daily Bias
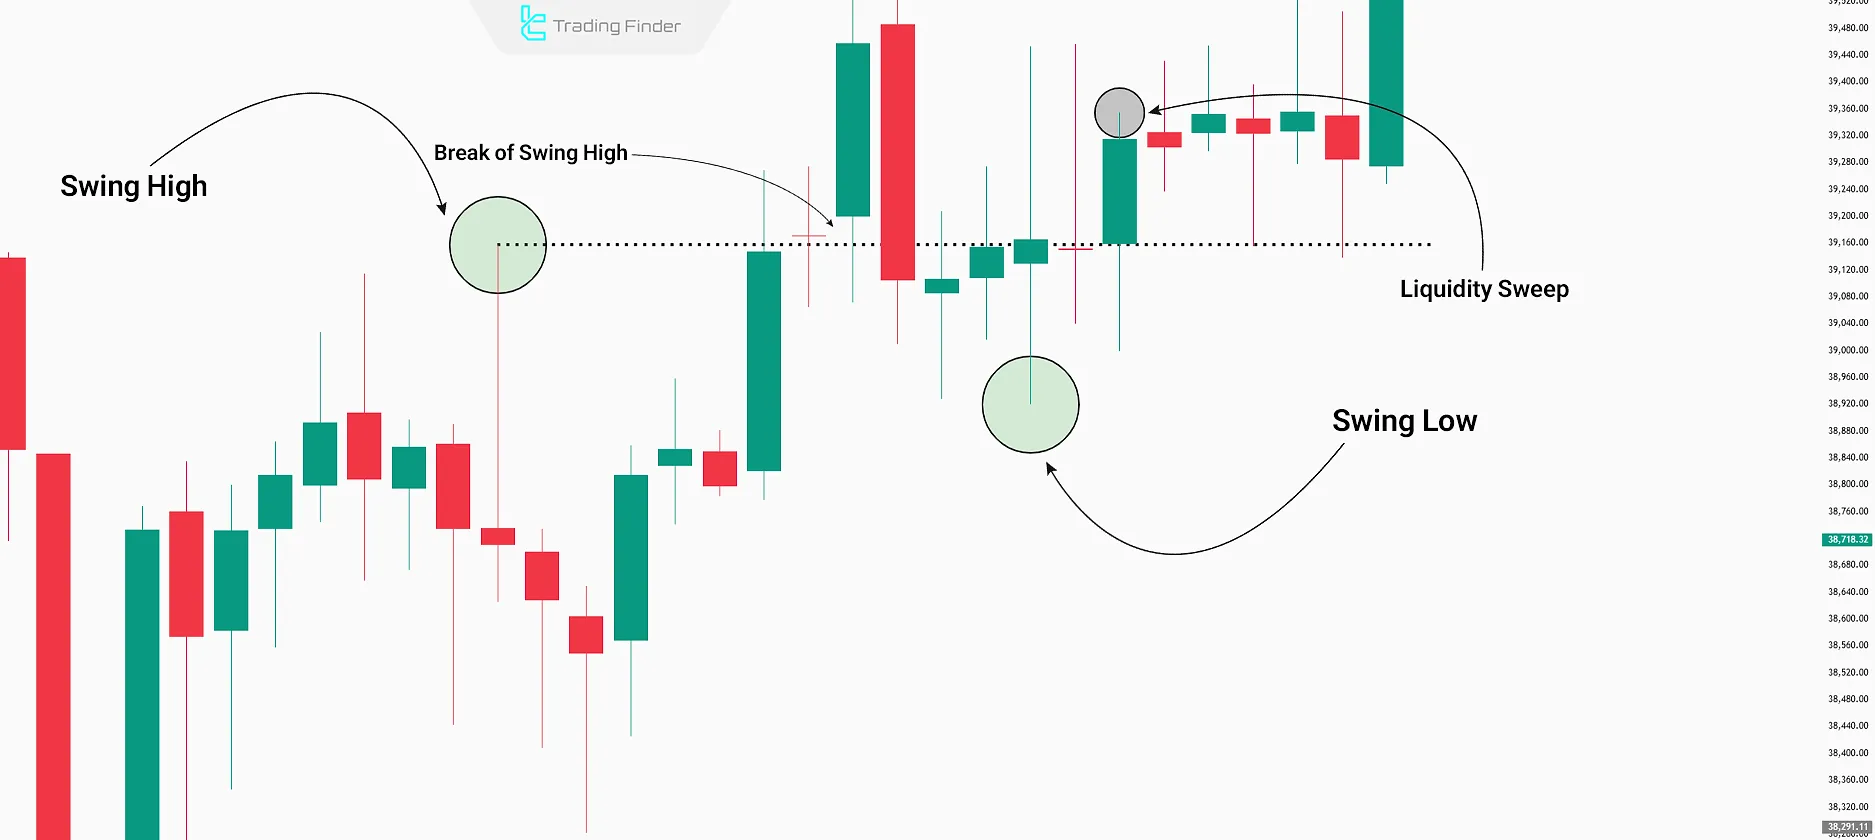
The process starts by observing whether a Swing High or Swing Low is broken.
Bullish Bias
Wait for a Swing High to break on the daily timeframe. Once broken, wait for a Swing Low to form without breaking the previous low.
Then, look for a liquidity sweep above the high of the third candle after the Swing Low.
The concept of liquidity and how to use it in ICT-style analysis is explained in a video tutorial on Justin Werlein’s YouTube channel:
Bearish Bias
Wait for a Swing Low to break. After the break, wait for a Swing High to form without breaking the prior high.
Then, watch for a liquidity sweep below the low of the third candle after the Swing High.
#2 Identifying the Next Probable DOL
Once the Daily Bias is defined, the next potential Draw On Liquidity zone is identified in that direction.
This could include Equal Highs or Lows, old highs/lows, or significant support/resistance zones, depending on historical market reactions.
#3 Entering the Trade Using OTE
After defining the Daily Bias and DOL target, wait for price retracement to the OTE zone of the third candle after the swing.
Once the price reaches the OTE zone, enter the trade upon confirmation by ICT reversal concepts like Market Structure Shift (MSS) or Change In Delivery (CISD).
- Bullish Bias: Enter long after retracement and confirmation by MSS;
- Bearish Bias: Enter short after retracement and confirmation by CISD.
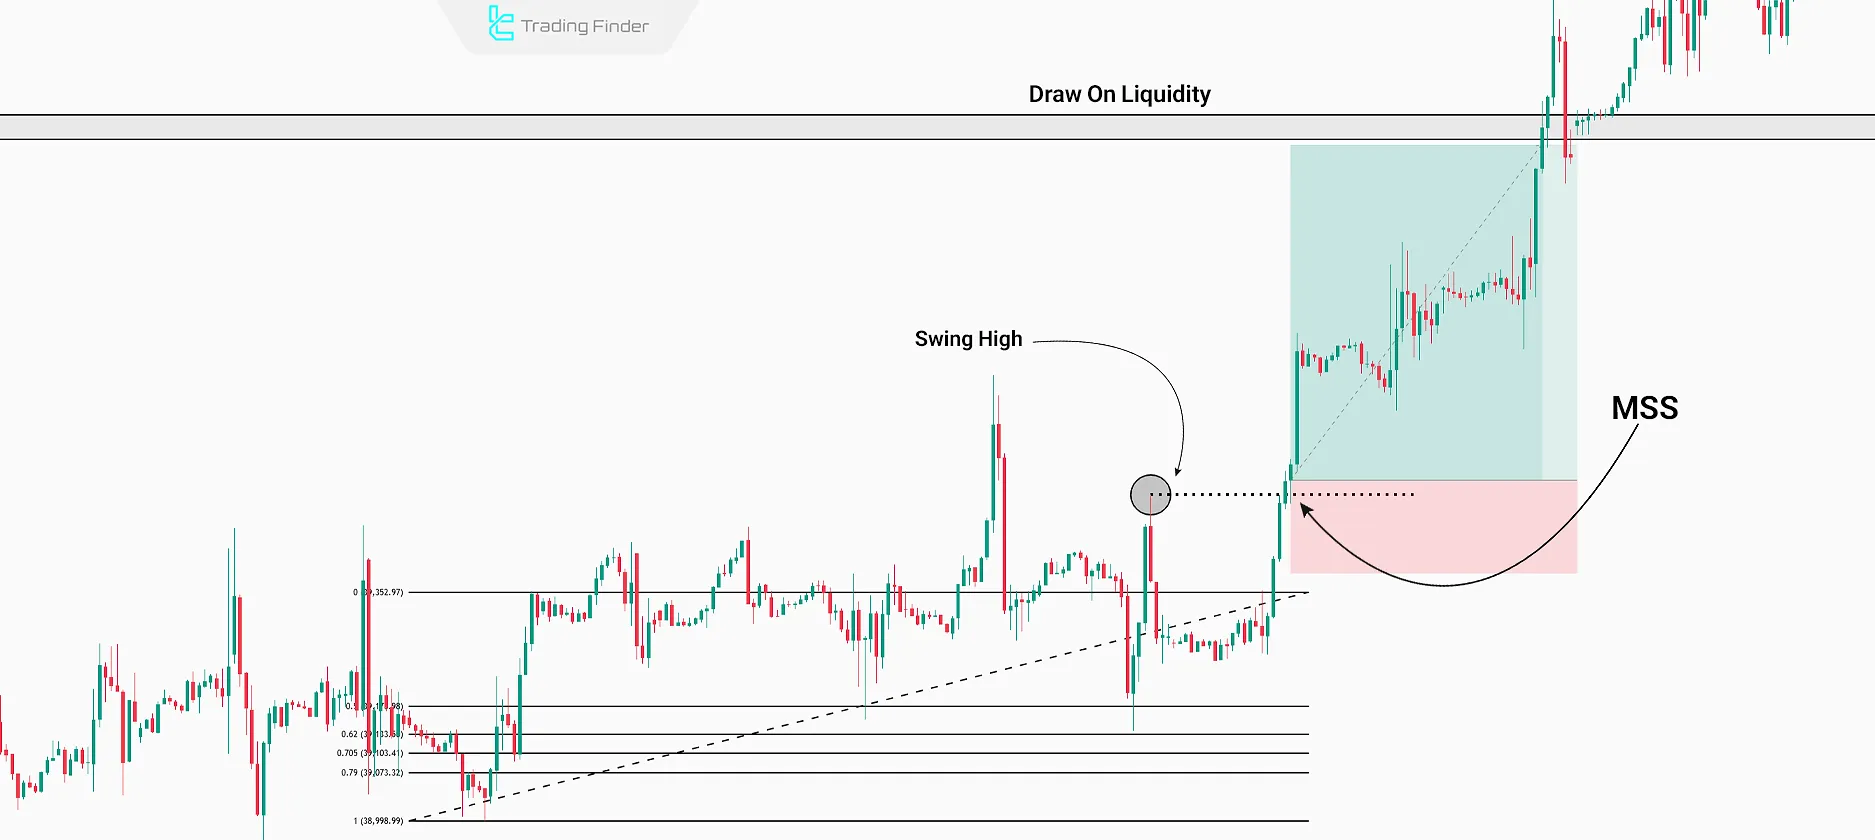
Example of a Trade Using the ICT 30-Pip-a-Day Setup
In this chart, the breakout of swing highs indicates a shift in bias toward bullish movement.
After the MSS confirmation, the price makes a minor retracement before entering an upward phase, targeting the liquidity above daily highs.
This structure represents a classic example of the 30-pip daily setup aligned with the overall trend, illustrating how the concept of liquidity sweep meaning helps identify potential reversal points.
Best Timeframes for Executing the ICT 30-Pip-a-Day Strategy
Transitioning from higher to lower timeframe analysis is the key to identifying precise entries aligned with the daily trend.
This process is also recognized as one of the core principles in the ict top down analysis approach.
- Daily Bias: Daily timeframe (D1)
- Market Structure Confirmation: 1-hour timeframe (H1)
- Trade Entry: 15-minute (M15) or 5-minute (M5) timeframe
Combining the ICT 30-Pip-a-Day Strategy with Other ICT Concepts
To improve entry accuracy and filter out false setups, other ICT principles can be applied alongside the OTE concept.
The most important include Order Block, Fair Value Gap (FVG), and Market Structure Shift (MSS).
- Enter trades when OTE and MSS occur simultaneously within an FVG zone;
- Exit trades once price reaches the opposing liquidity pool;
- Confirm entries on a lower timeframe before executing the final trade.
This combination, when enhanced with ideas such as swing high and swing low liquidity, provides a deeper understanding of liquidity flow and improves precision in trade execution.
Additional Notes for Using the ICT 30 Pip Trading Setup
To increase effectiveness with this strategy, consider the following:
- Trading Time: Apply this setup during London and New York Kill Zones;
- Risk Management: Due to the scalping nature, risk only 1–2% per trade;
- Risk-Reward Ratio: Don’t enter trades with an RR less than 1:2.
Best Time to Execute the ICT 30-Pip-a-Day Setup
In the ICT 30-Pip-a-Day strategy, trade timing plays a crucial role since major price movements usually occur within specific time windows known as Kill Zones in the ICT methodology.
Kill Zones are considered the optimal times for trade entries and exits because the highest liquidity volume is transacted during these sessions.
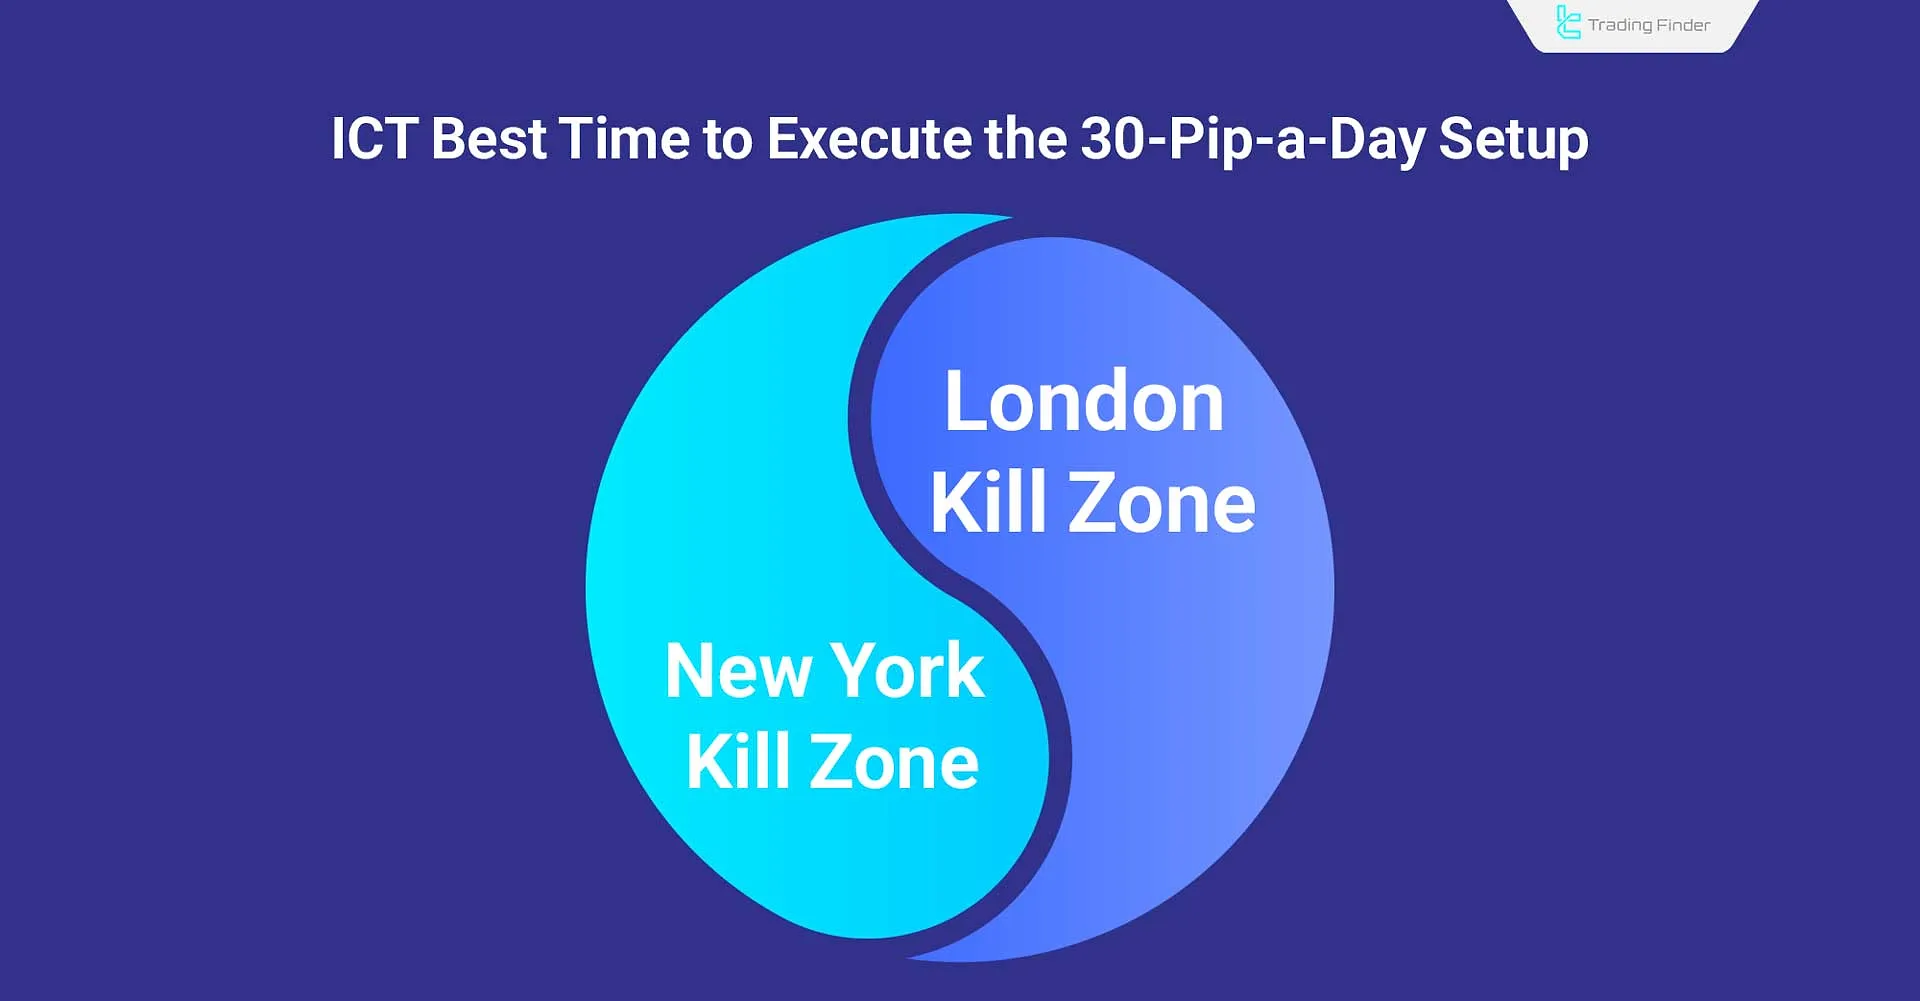
In most cases, the daily high or low forms within one of these sessions. Therefore, aligning analysis and trade execution with these Kill Zones significantly increases the strategy’s success rate.
Capital Management in the ICT 30-Pip-a-Day Strategy
One of the key reasons traders fail when applying scalping strategies is ignoring capital management principles.
In the ICT approach, it is also advised to define risk, stop loss, and profit targets before entering any trade.
- Maximum allowable risk per trade: between 1 and 2 percent of total capital
- Minimum risk-to-reward ratio: 1 to 2 or higher
- Position size: should be adjusted based on stop loss distance
- Trade volume adjustment: increase position size only after several weeks of consistent profitability
Following these principles helps maintain capital control even after a few losing trades.
Advanced Tips for More Precise Execution of the ICT 30-Pip-a-Day Strategy
To achieve a more professional level of execution, paying attention to the following details is essential:
- Evaluate liquidity on both sides of the daily range;
- Confirm the daily bias using a higher timeframe;
- Enter only when MSS, OTE, and FVG align simultaneously;
- Avoid trading during high-impact news releases;
- Use volume analysis to filter false breakouts.
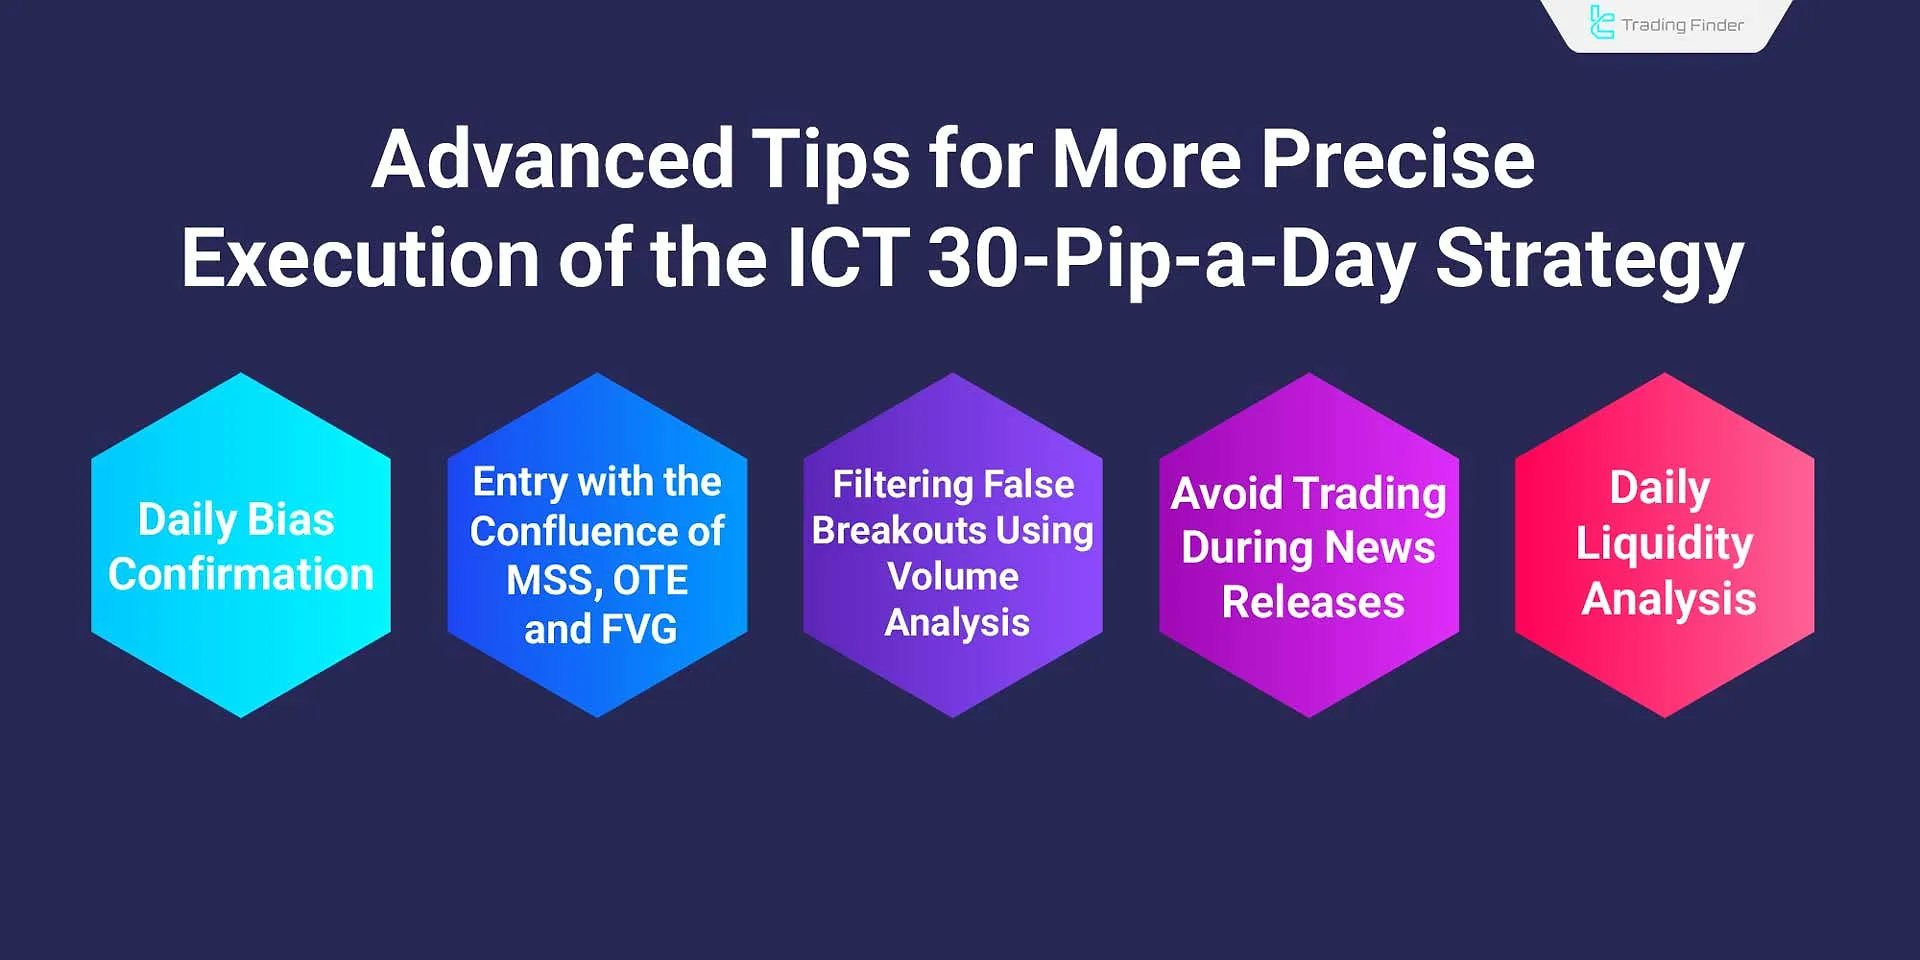
These tips enhance analytical accuracy and significantly reduce the likelihood of errors.
Pros and Cons of the ICT 30 Pip Trading Setup
This ICT 30 Pip Trading Setup provides a high win rate, but setting it up may take several days.
Advantages | Disadvantages |
High win rate | Setup formation can be time-consuming |
Applies key ICT concepts | Requires experience and deep ICT understanding |
Offers favorable risk-reward ratios | Low number of trades per week |
Comparison of the ICT 30-Pip-a-Day Strategy Performance Across Markets
The following table presents a comparison of this strategy’s accuracy and profitability in different markets:
Trading Market | Average Daily Return | Effective Kill Zone | Average Volatility | Signal Accuracy |
Forex | 30 to 50 pips | London and New York | Medium | Very High |
Cryptocurrencies | 0.7 to 1.2 percent | New York and Asia | High | Medium |
Indices (NASDAQ, DAX) | 25 to 40 points | London | High | High |
Combining this strategy with lower timeframes proves most effective in Forex, while in crypto markets it requires synchronization with session timings.
This alignment is also emphasized within the inner circle trader framework, where time and liquidity serve as the core decision-making elements.
Return Expectations and Realism in the ICT 30-Pip-a-Day Strategy
The main goal of this strategy is to achieve consistent and realistic daily returns.
Under normal market conditions, this setup typically delivers between 30 and 50 pips of net profit per trade. However, the number of valid setups per week is limited and requires patience.
- Average return per setup: 30 to 50 pips
- Average risk-to-reward ratio: around 1 to 2
- Number of reliable setups per week: 2 to 4 trades
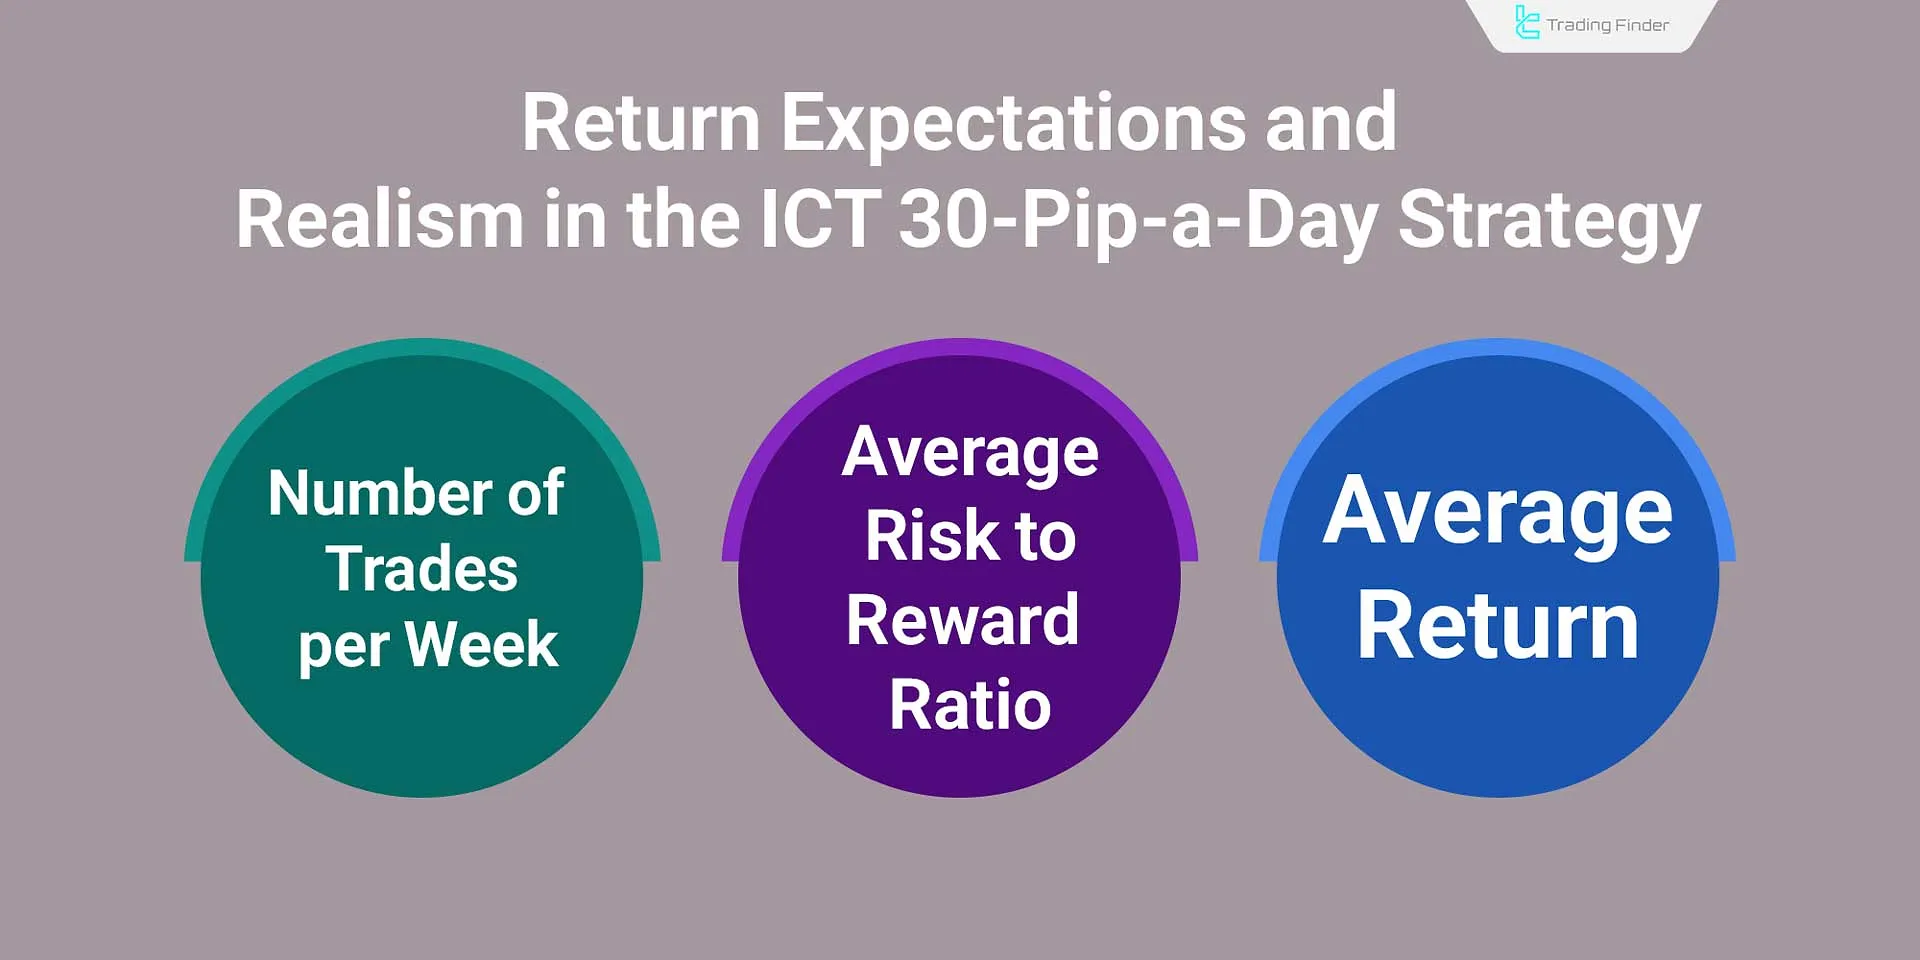
This strategy is designed for traders with strong focus, emotional control, and analytical vision. The goal is steady, rational profit not trading every single day.
Is This Strategy Suitable for All Traders?
The ICT 30-Pip-a-Day strategy suits traders who are comfortable with fast market conditions and quick decision-making on short timeframes.
If you prefer slower-paced or medium-term trades, it is better to use swing or structural strategies within the ICT methodology.
It is strongly recommended to practice on a demo account before applying it to a live trading account to evaluate your personal performance.
Crypto Version of the ICT 30-Pip-a-Day Strategy
In the crypto market, due to 24-hour activity and higher volatility, a customized version of this strategy is more practical.
- The daily profit target is defined in percentages (0.5 to 1.5 percent) instead of pips;
- The best liquidity-hunting windows are the overlapping Asia and New York sessions;
- Entry confirmation occurs within an FVG zone or after an MSS on 1- to 5-minute timeframes;
- Stop loss is kept small, and profit targets are set based on daily volatility.
Final Checklist for Executing the ICT 30-Pip-a-Day Strategy
To apply the ICT 30-Pip-a-Day strategy accurately and systematically, follow these steps in sequence. Each step is based on top-down analysis logic and market liquidity structure:
- Check the daily bias on the D1 timeframe;
- Identify the liquidity range (DOL);
- Wait for price retracement toward the OTE zone;
- Look for MSS or CISD confirmation on a lower timeframe;
- Enter during the London or New York Kill Zone;
- Set risk between 1 and 2 percent;
- Close the trade at the opposing liquidity zone.
At this stage, understanding dol in ict helps you better identify the Daily Open Line (DOL) and make more precise entry or exit decisions.
ICT Concepts Indicator
The ICT Concepts Indicator is one of the most advanced analytical tools in the Smart Money framework, designed as an expert advisor that visually presents key ICT concepts through a professional interface.
In its latest version, two new components Unicorn and Inducement have been added to enhance the accuracy of liquidity flow and price manipulation analysis. The license for this tool can be obtained through Trading Finder’s support on Telegram or WhatsApp.
This indicator integrates key ICT concepts such as Order Block, Breaker Block, Fair Value Gap, Balanced Price Range, Market Structure, and Key Time Zones (Kill Zones) in one unified environment. By enabling or disabling each module, traders can focus only on the components needed within their preferred timeframe.
Through the ZigZag feature, trend structures and price highs/lows are identified. The Order Block mode marks smart money entry zones, and if broken, they convert into Breaker Blocks to form new support or resistance areas.
The Fair Value Gap module detects price imbalance zones, allowing traders to pinpoint potential reversal areas.
In the Unicorn model, the combination of FVG, Breaker Block, and KQ structure highlights strong price reaction zones. The Inducement feature identifies levels where liquidity accumulates, after which the main market trend resumes once the liquidity sweep occurs.
This indicator suits professional traders in Forex, stocks, indices, and cryptocurrencies, and requires enabling the “Allow automated trading” and “Allow DLL imports” options.
The ICT Concepts Indicator is a complete analytical tool for understanding liquidity behavior, market structure, and precise trading decisions. It aligns perfectly with educational principles related to draw on liquidity trading.
Conclusion
The ICT 30 Pip a Day Strategy is built on core ICT concepts such as OTE, Daily Bias, MSS, and more, making it ideal for scalping and day trading.
Using Top Down Analysis, it aligns entries with the daily trend, enhancing win rate and trade quality.
While the minimum target is 30 pips, this can vary depending on market conditions.


